



Table of contents
No native network publishes roofing CTR, cost-per-lead or conversion benchmarks, so a roofing native benchmark has to be assembled from three labelled parts: cross-industry native feed data, roofing paid-search costs from LocaliQ, and storm-loss data that tells you when a roofing ad is relevant at all.
Key Takeaways
- Wind and hail caused 42.5% of US homeowners insurance losses in 2023.
- Over 2018-2022, 2.8% of insured homes had a wind or hail claim.
- Wind and hail claims averaged USD 14,747 in severity over 2019-2023.
- Roofing search ads cost USD 228.15 per lead in LocaliQ's 2025 study.
- Roofing search conversion rate was 3.70%, among the lowest in home services.
- Roofing search CPC was USD 10.70, third-highest of the home services categories.
- OpenAdLibrary's practitioner band for widget CTR is about 0.05% to 0.3%, cross-industry.
- Its June 2026 native index counts 589,036 creatives across 42 networks.
- Taboola says Realize reaches 600 million-plus daily active users.
Roofing native benchmarks at a glance
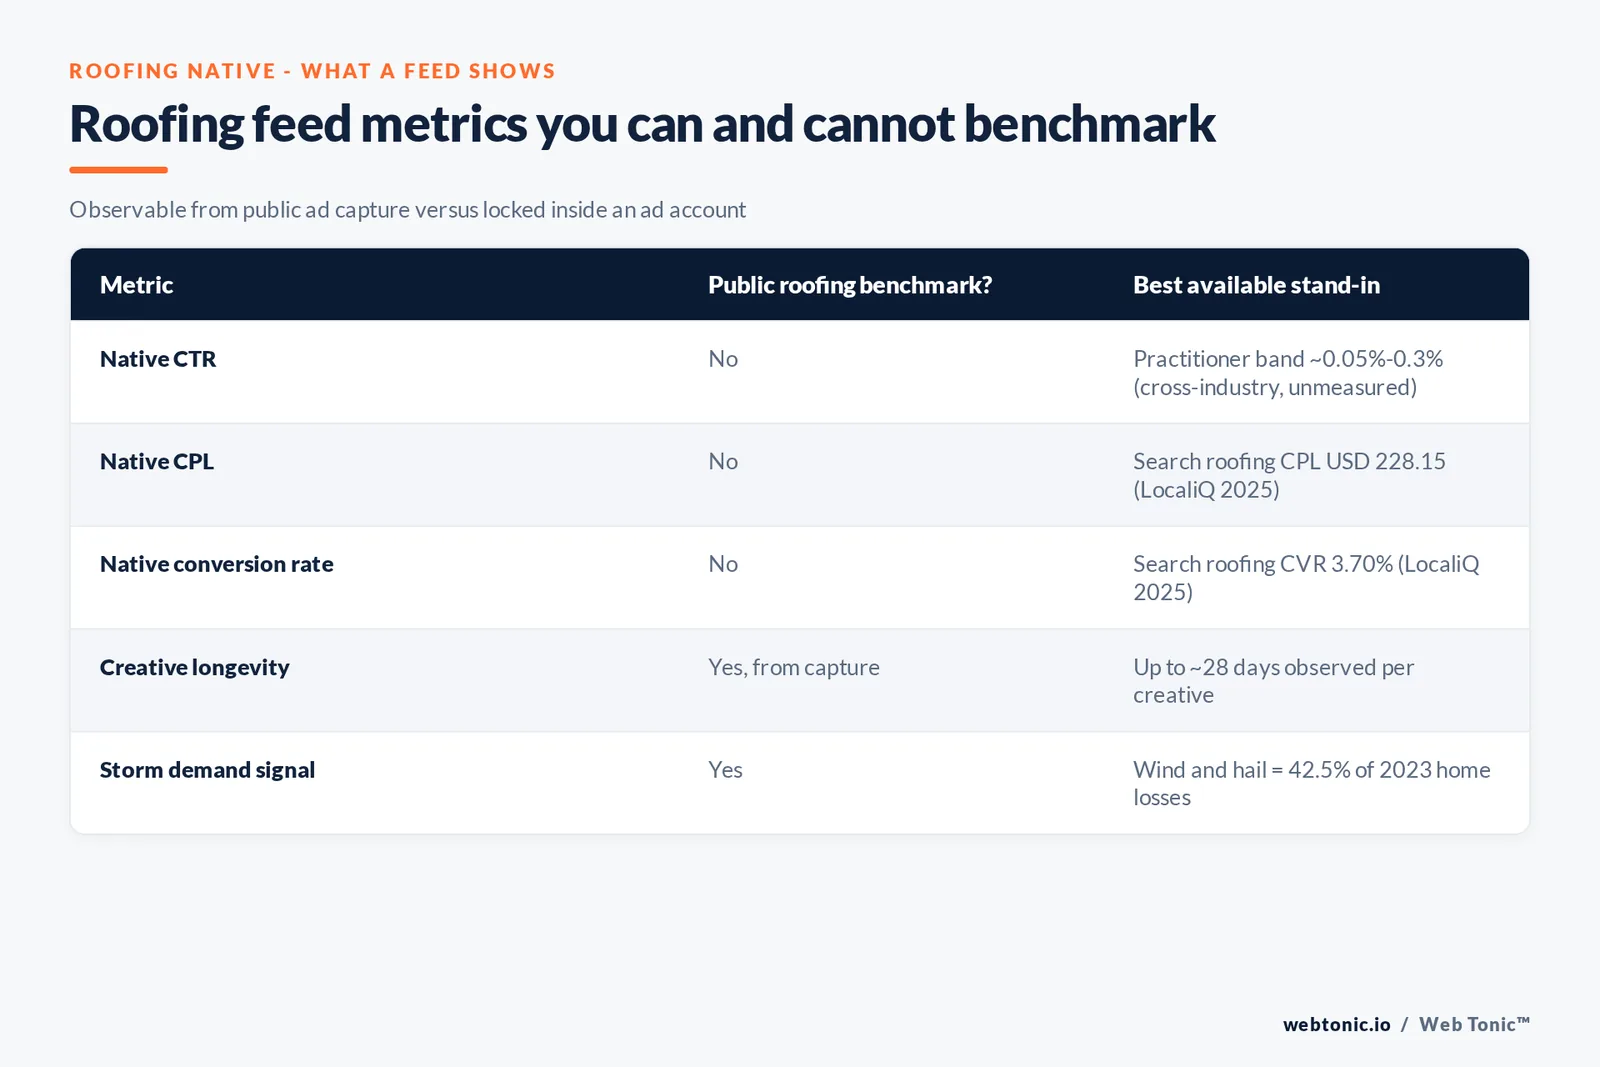
The table separates what exists from what does not. Every native-specific roofing cell is empty because no issuer publishes it; the filled rows are comparators, each labelled with its channel.
| Benchmark | Roofing figure | Channel | Issuer |
|---|---|---|---|
| Native CTR | Not published | Native | None |
| Native cost per lead | Not published | Native | None |
| Cost per lead | USD 228.15 | Paid search, 2025 | LocaliQ (vendor) |
| Conversion rate | 3.70% | Paid search, 2025 | LocaliQ (vendor) |
| Widget CTR band | ~0.05%-0.3% | Native, cross-industry, practitioner-reported | OpenAdLibrary (vendor) |
Storm losses set the roofing calendar
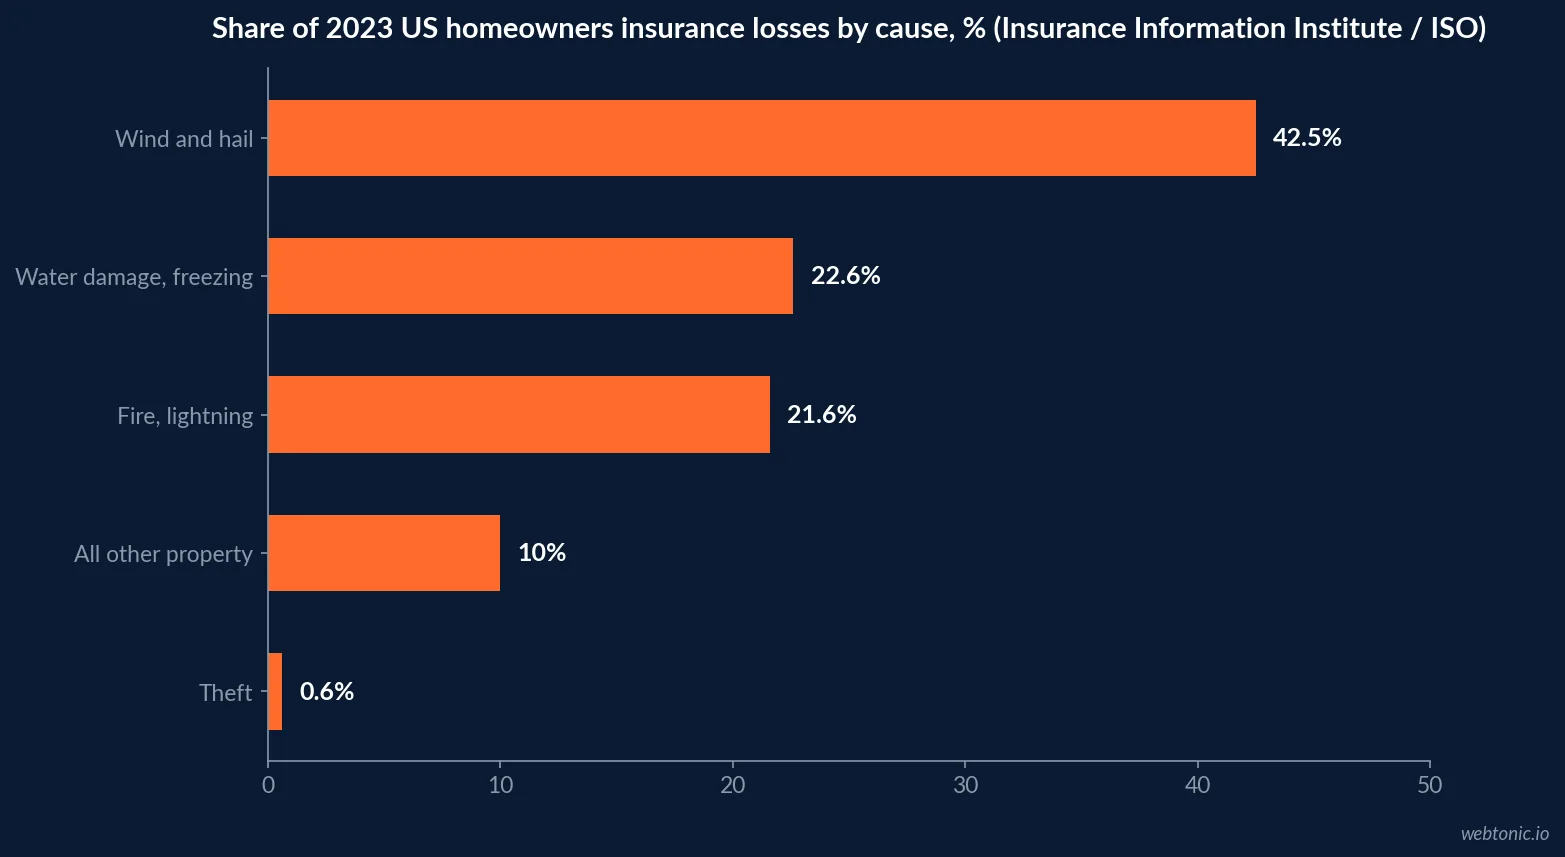
Roofing demand is weather-led, and the Insurance Information Institute publishes the cleanest national proxy. Using ISO data, it shows wind and hail as the largest cause of homeowners insurance losses in every year from 2019 to 2023, peaking at 47.7% in 2020 and standing at 42.5% in 2023. The same page reports that 5.8% of insured homes had a claim of any kind over 2018-2022, and wind and hail accounted for the largest share, with 2.8% of insured homes having such a loss.
For a native buyer, this is a timing input, not a performance figure. Interruption formats work when the headline matches something the reader already has on their mind, and a hail week is the one time a roof is on most homeowners' minds.
| Year | Wind and hail share of losses | Water damage and freezing | Fire and lightning |
|---|---|---|---|
| 2019 | 38.1% | 28.7% | 21.2% |
| 2020 | 47.7% | 19.8% | 21.2% |
| 2021 | 38.9% | 23.7% | 22.8% |
| 2022 | 45.4% | 25.8% | 18.7% |
| 2023 | 42.5% | 22.6% | 21.6% |
What a native feed actually lets you measure
OpenAdLibrary, a native-ad spy-tool vendor, states plainly that no native network publishes CTR benchmarks. The bands it prints are a summary of what media buyers report: below-article recommendation widgets at roughly 0.05% to 0.15% on desktop and 0.1% to 0.3% on mobile, and mid-article in-feed units at about 0.1% to 0.3% desktop and 0.2% to 0.5% mobile. Those are cross-industry, practitioner-reported ranges. They are not roofing figures and should never be presented as one.
What capture data can show reliably is creative behaviour: how many distinct ads an advertiser runs and how long each stays live. OpenAdLibrary's capture method observes each creative for up to about 28 days, so a roofing ad seen running for weeks is one its buyer has chosen not to switch off.
The same page makes a point roofers should keep in front of any CTR report: at realistic click prices, a campaign at 0.08% CTR converting at 2% beats one at 0.4% CTR converting at 0.2%. It also notes that mobile placements typically beat desktop and that mid-article units beat below-article footers. For a roofer, that means judging a feed on cost per inspection booked, with CTR used only to spot a broken creative.
| Placement (cross-industry) | Desktop band | Mobile band | Status of figure |
|---|---|---|---|
| Below-article widget | ~0.05%-0.15% | ~0.1%-0.3% | Practitioner-reported |
| Mid-article in-feed unit | ~0.1%-0.3% | ~0.2%-0.5% | Practitioner-reported |
| Portal or homepage feed | ~0.1%-0.4% | ~0.15%-0.5% | Practitioner-reported |
The search price roofing native is measured against
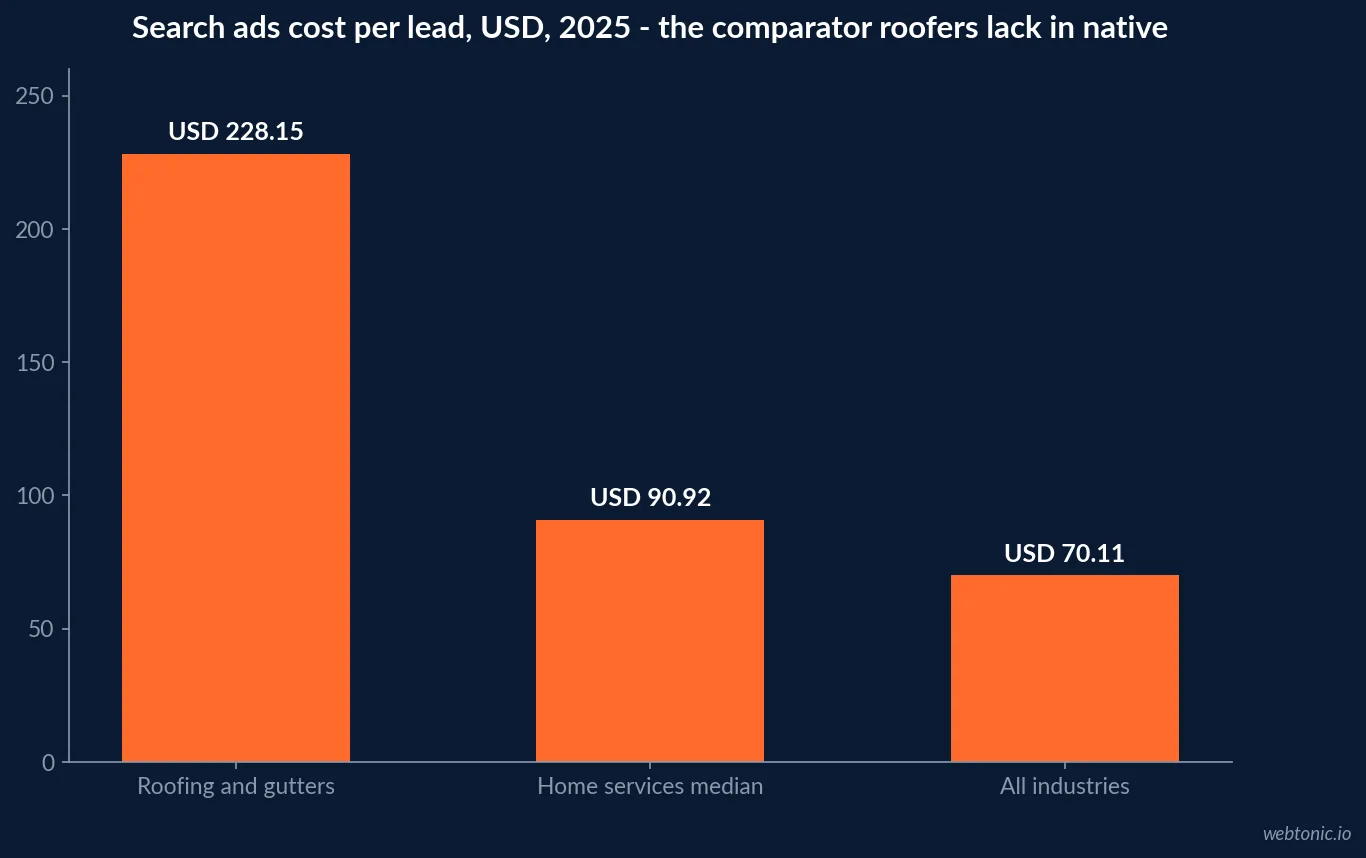
The LocaliQ 2025 home services benchmarks cover 3,211 US search campaigns run between April 1, 2024 and March 21, 2025, with at least 103 campaigns per category and medians reported as averages. Roofing and gutters posted the highest cost per lead in the study at USD 228.15, a 3.70% conversion rate, a 5.66% click-through rate and a USD 10.70 cost per click. Across all home services the medians were 6.37%, USD 7.85, 7.33% and USD 90.92.
Those numbers frame native's job for a roofer. A native lead does not need to beat search on conversion rate; it needs to arrive at a total cost below what search is charging, which in 2025 meant below USD 228.15 for a roofing lead.
| Search metric, 2025 | Roofing and gutters | Home services median | All industries (WordStream) |
|---|---|---|---|
| Click-through rate | 5.66% | 6.37% | 6.66% |
| Cost per click | USD 10.70 | USD 7.85 | USD 5.26 |
| Conversion rate | 3.70% | 7.33% | 7.52% |
| Cost per lead | USD 228.15 | USD 90.92 | USD 70.11 |
Why roofing leads cost more everywhere
LocaliQ attributes high roofing costs partly to consumer focus on repairing damage rather than adding features, and notes that conversion rates dipped across home services as search results added more ad types such as Local Services Ads and map ads. The all-industry WordStream 2025 report, built from 16,446 campaigns, shows cost per lead rising from USD 66.69 to USD 70.11, a 5.13% increase, while LocaliQ reports that cost per lead rose for 69% of home services businesses, by 10.51% on average. Roofing sits at the expensive end of an already rising curve.
Scale of the feeds roofers can buy
The open-web inventory is large but crowded. OpenAdLibrary's State of Native Advertising 2026, the native-ad spy-tool vendor's report on its own index, counted 589,036 creatives from 25,933 advertisers across 42 networks in June 2026, with Taboola alone at 157,727 captured creatives. Taboola reports that Realize reaches over 600 million daily active users. Home-improvement advertisers compete in those widgets with health, finance and insurance offers, the three largest verticals in the index.
Below Taboola the index drops quickly: Outbrain, now part of Teads after the February 2025 acquisition, carried 84,252 captured creatives and MGID 49,689 in June 2026. OpenAdLibrary describes Taboola's Realize and Teads as the premium open-web supply, with MGID and Revcontent carrying more aggressive direct-response demand. A roofing brand that cares about where its name appears will usually start on the premium pair and treat the long tail as a separate, closely watched test.
| Feed signal | Figure | Date | Issuer |
|---|---|---|---|
| Native creatives indexed | 589,036 | June 2026 | OpenAdLibrary |
| Advertisers in the index | 25,933 | June 2026 | OpenAdLibrary |
| Taboola captured creatives | 157,727 | June 2026 | OpenAdLibrary |
| Realize daily active reach | 600 million-plus | FY2025 release | Taboola |
| Observation window per creative | ~28 days | 2026 method note | OpenAdLibrary |
Google's in-platform feed alternative
Roofers who want feed placements without open-web widgets usually test Demand Gen. Google's Demand Gen help page lists YouTube, Discover, Gmail and the Google Display Network as serving surfaces and claims reach to more than 3 billion monthly active users. That is a platform claim, not a roofing benchmark, and Google does not publish Demand Gen lead costs for roofing either. The IAB/PwC full-year 2025 report puts US digital ad revenue at nearly USD 300 billion, up 13.9%, but its public summary does not separate native.
The practical difference for a roofer is control. Demand Gen lets an advertiser choose channels inside Google's own surfaces and use the same conversion tracking as search, while open-web native buys placements on third-party publishers through each network's own platform. Neither route has a published roofing benchmark, so whichever is tested first, the measurement plan has to be built from the roofer's own call and inspection data.
Testimonials, storm claims and the FTC
Roofing native ads lean on two risky ingredients: reviews and urgency. The FTC native advertising guide requires the unit to be identifiable as an ad before the click and any needed disclosure to be clear and prominent. For reviews, the Endorsement Guides, 16 CFR Part 255 (88 FR 48102, July 26, 2023) define a clear and conspicuous disclosure as difficult to miss and easily understandable, and require material connections to be disclosed. An advertorial styled as storm news, with an unlabelled discount for reviewers, fails both tests.
Claim size versus lead cost
The same Insurance Information Institute page explains why roofers tolerate expensive leads. Wind and hail claims averaged USD 14,747 in severity over 2019-2023, at a frequency of 2.80 claims per 100 insured house-years. Across all perils, average claim severity rose from USD 13,884 in 2019 to USD 20,062 in 2023, while frequency stayed between 5.33 and 6.37 claims per 100 house-years. Set against a USD 228.15 search lead, the median wind and hail claim is roughly 65 times the lead cost. That is arithmetic on two public figures, not a measured return, but it explains why roofing sits at the top of every home services cost table.
| Year | Claims per 100 house-years (all perils) | Average claim severity | Wind and hail share of losses |
|---|---|---|---|
| 2019 | 5.37 | USD 13,884 | 38.1% |
| 2020 | 6.37 | USD 14,864 | 47.7% |
| 2021 | 5.34 | USD 16,601 | 38.9% |
| 2022 | 5.81 | USD 19,740 | 45.4% |
| 2023 | 5.33 | USD 20,062 | 42.5% |
Roofing among the exterior trades
Roofing is not the only exterior trade with expensive leads. In LocaliQ's 2025 data, doors and windows sales posted a USD 200.34 cost per lead and a 4.41% conversion rate, general construction and contractors USD 165.67 and 2.61%, and paint and painting USD 138.38 with the highest cost per click in home services at USD 13.74. Roofing's USD 228.15 still tops them all. For native planning, the useful read is that big-ticket exterior jobs share the same pattern: low conversion on intent channels and high value per job, which is the profile where an upper-funnel test can be worth running.
Building a roofing native test that means something
- Set the ceiling first: your own search CPL, or the USD 228.15 LocaliQ median if you have none.
- Launch around storm weeks, when wind and hail, 42.5% of 2023 losses, put roofs in the news.
- Judge CTR only inside its band; below 0.05% on a widget usually means the creative, not the channel.
- Track creative age against the ~28-day window competitors are visible for.
- Label the ad and every incentivised review before launch.
Market-wide native figures are in our native advertising statistics, and roofing search visibility is covered in our roofing enterprise SEO data. For the broader channel mix, see the advertising statistics hub or talk to our growth marketing team.
Frequently Asked Questions
Is there a published native-ad CTR for roofing companies?
No. No native network publishes roofing-specific click-through, cost-per-lead or conversion benchmarks. OpenAdLibrary, a native-ad spy-tool vendor that captures public native ads across dozens of networks, says no native network publishes CTR benchmarks at all; its cross-industry band of roughly 0.05% to 0.3% for in-article widgets is practitioner-reported, not measured.
What lead cost should a roofer compare native against?
The closest public figure is paid search. LocaliQ's 2025 home services study puts roofing and gutters at a USD 228.15 median cost per lead, the highest of its home services categories, against USD 90.92 for home services overall. Use it as a ceiling for what a native lead is worth, not as a native rate.
Why does storm data matter for roofing native campaigns?
Because native feeds are an interruption channel, timing decides relevance. Insurance Information Institute data from ISO shows wind and hail caused 42.5% of US homeowners insurance losses in 2023, and 2.8% of insured homes had a wind or hail claim over 2018-2022. Those are the moments a roofing headline fits the reader's week.
Can roofers use customer testimonials in native ads?
Yes, with disclosure. The FTC Endorsement Guides at 16 CFR Part 255, revised July 26, 2023, require any material connection between the roofer and a reviewer to be disclosed clearly and conspicuously, and the FTC's native guide requires the unit itself to be identifiable as an ad.
Sources
Insurance Information Institute, Facts + Statistics: Homeowners and renters insurance
LocaliQ, Home Services Search Advertising Benchmarks 2025
WordStream, Google Ads Benchmarks 2025
OpenAdLibrary, Native Ad CTR Benchmarks by Vertical and Network (2026)
OpenAdLibrary, State of Native Advertising 2026
Taboola, Q4 and full year 2025 results
Google Ads Help, About Demand Gen campaigns
IAB/PwC Internet Advertising Revenue Report, full year 2025
FTC, Native Advertising: A Guide for Businesses
eCFR, 16 CFR Part 255 Endorsement Guides


