



Table of contents

CoStar and Tourism Economics now expect US RevPAR to grow 4.4% for full-year 2026, upgraded from an earlier 2.8% forecast. That number changes what a hotel marketing budget has to protect, not just what it has to generate: rate-driven growth is worth less once an OTA commission is subtracted from it.
Key Takeaways
- US RevPAR is forecast to grow 4.4% in 2026, up from a 2.8% prior estimate.
- Average daily rate is forecast to rise 3.1% and occupancy to reach 63.1%.
- Hotels sold 11.4 million more room nights in H1 2026 than in H1 2025.
- Room revenue climbed more than USD 5.4 billion in the same window.
- GOPPAR is expected to rise 4% in 2026 and a further 1% in 2027.
- 2027 RevPAR growth is forecast to slow to 2.1% as event tailwinds fade.
- Luxury ADR is forecast to grow 5.9% for full-year 2026.
- Select-service RevPAR is forecast at roughly 3.6% for 2026.
- Published hotel marketing budgets run 4% to 8% of revenue, excluding payroll.
- Actual US hotel marketing spend sits under 2.5% of room revenue including payroll.
- Gartner's 2026 cross-industry average is 7.8% of revenue for marketing budgets.
- Travel and hospitality sits below 7% of revenue on the same measure.
- OTA commissions typically run 15% to 30% of the booking value.
- OTA bookings cancel at 21.8%, against 10.6% for direct bookings.
- Independent-hotel marketing guidance sits at 4% to 6% of revenue.
- Reported email marketing ROI reaches 3,000% to 5,000% for hotel campaigns.
- Reported hotel SEO ROI runs 400% to 900% over 9 to 18 months.
- Martech's share of marketing budget fell to 19.4% in 2026, a five-year low.
The forecast a 2026 hotel budget is built against
CoStar and Tourism Economics upgraded their full-year 2026 US hotel forecast at the 18th Annual Hotel Data Conference, raising projected RevPAR growth to 4.4%, average daily rate growth to 3.1% and occupancy to 63.1%. STR president Amanda Hite attributed the upgrade to a first half in which the industry sold 11.4 million more room nights than the same period a year earlier, with room revenue up more than USD 5.4 billion, fueled in part by the World Cup and America 250 celebrations.
The same release put gross operating profit per available room (GOPPAR) growth at 4% for 2026, moderating to 1% in 2027 as rising expenses outpace inflation. That gap between top-line and bottom-line growth is exactly where a marketing budget earns or loses its keep.
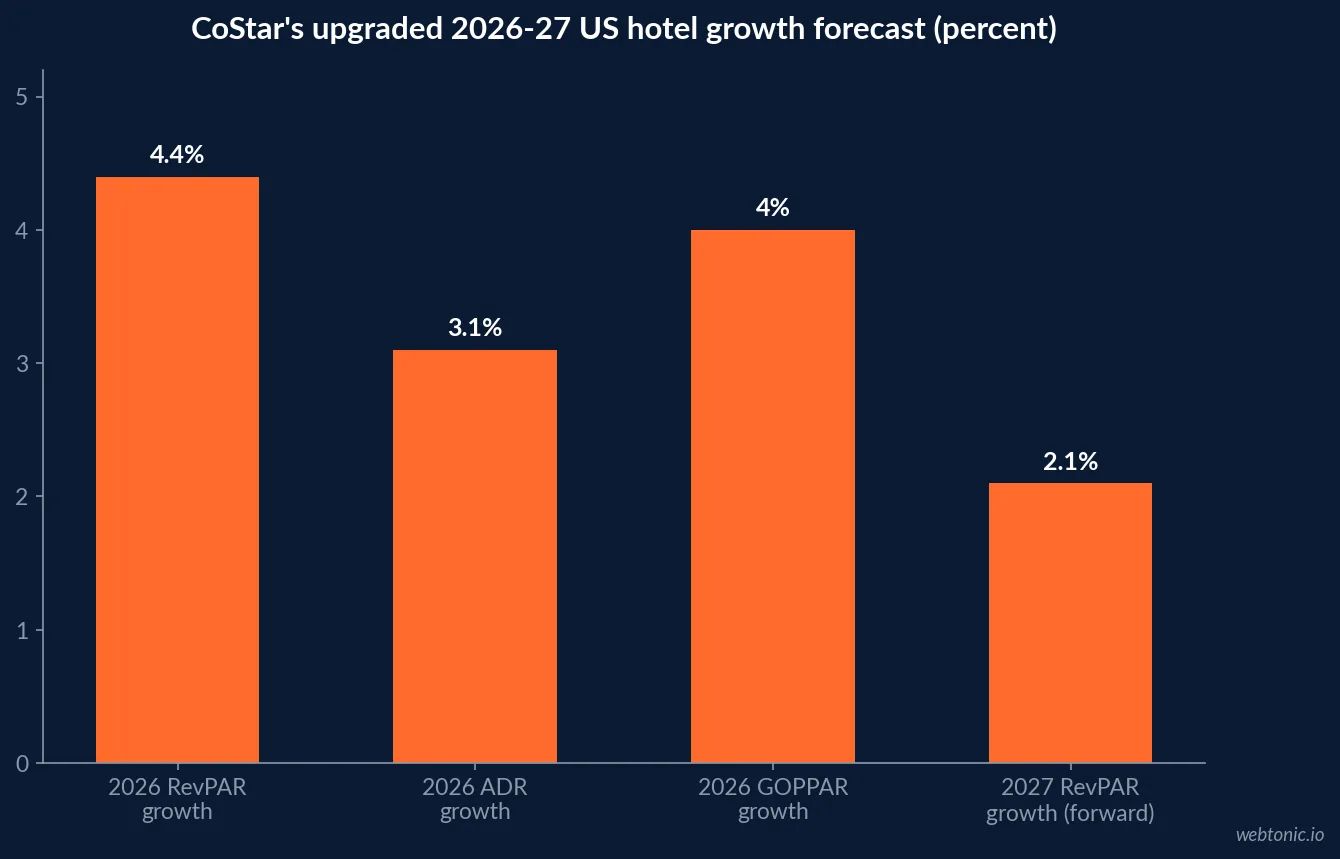
| 2026 forecast metric | CoStar/Tourism Economics figure | Prior forecast | Direction |
|---|---|---|---|
| RevPAR growth, full year | 4.4% | 2.8% | Upgraded |
| ADR growth, full year | 3.1% | 2.0% | Upgraded |
| Occupancy | 63.1% | 62.8% | Upgraded |
| GOPPAR growth | 4% | Not previously stated | New estimate |
| 2027 RevPAR growth (forward) | 2.1% | n/a | Deceleration expected |
Growth is not even across chain scales
CoStar's Q3 2026 forecast assumptions show luxury properties carrying full-year ADR growth of 5.9% with double-digit RevPAR growth in Q2 and Q3, while select-service properties land closer to 3.6% RevPAR on 2.5% ADR growth. Midscale and economy RevPAR growth is coming mostly from occupancy gains rather than rate, because financial pressure on lower-income travelers is limiting how much those segments can raise price.
That split matters for a budget request: a luxury property riding a rate wave should be defending margin on every booking, while a midscale property chasing occupancy should be funding demand generation.
| Chain scale | 2026 RevPAR growth | 2026 ADR growth | Primary growth driver |
|---|---|---|---|
| Luxury | Double-digit in Q2/Q3 | 5.9% | Rate |
| Select-service | ~3.6% | ~2.5% | Mixed |
| Midscale/Economy | Below segment average | Limited | Occupancy |
| Full US market | 4.4% | 3.1% | Rate, with a smaller demand lift |
What hotels actually spend on marketing, versus what is recommended
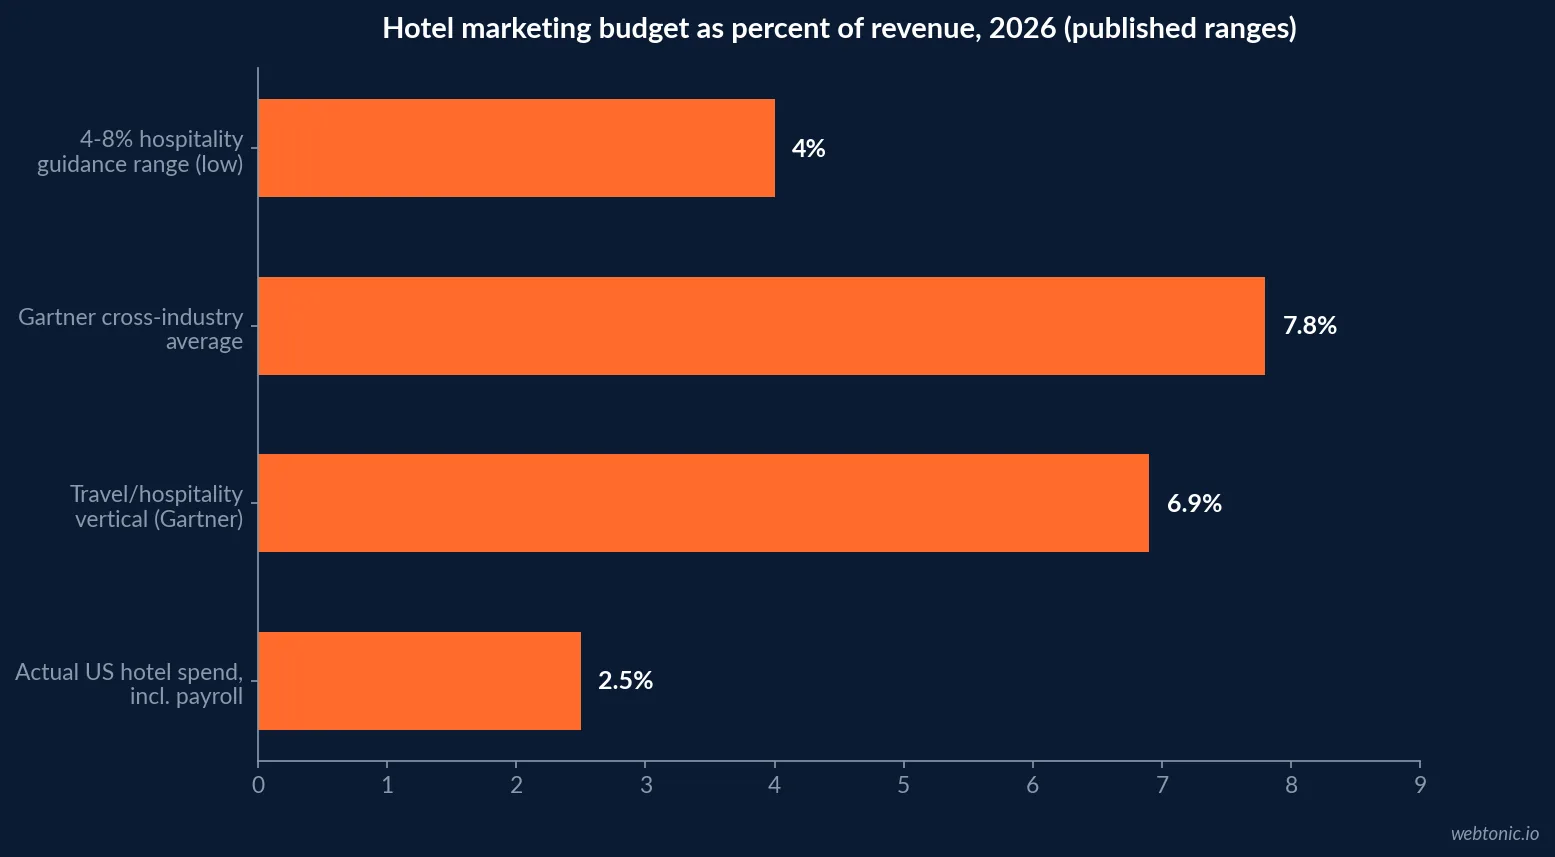
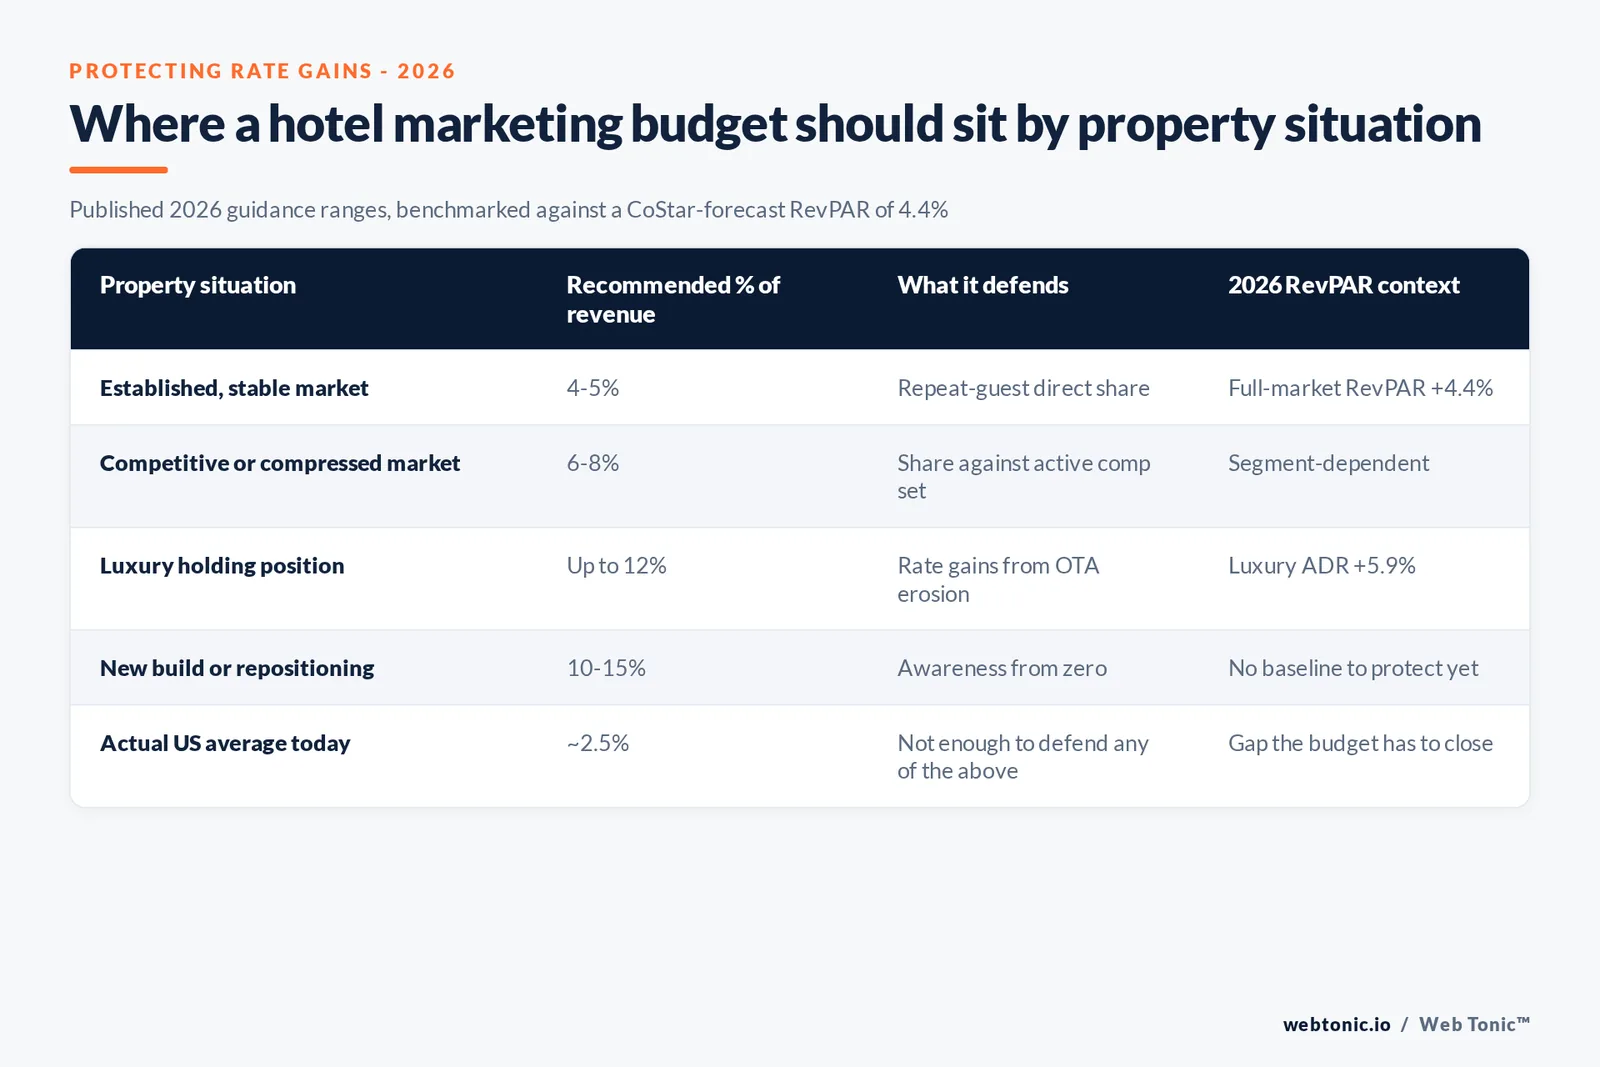
Gourmet Marketing's analysis, built on the same CoStar forecast cited above, recommends 4% to 8% of total revenue excluding sales and marketing payroll, citing hospitality consultant Max Starkov's floor of 4% to 6% on the Hospitality Net expert panel. The same piece notes that STR data puts actual US hotelier spend under 2.5% of room revenue including payroll, while The Lobby ties independent-hotel spend directly to direct-booking share: properties investing 4% to 6% generate 40% to 55% of bookings directly, against 18% to 25% for properties spending under 2%.
| Property situation | Recommended % of revenue (ex. payroll) | Source |
|---|---|---|
| Established, stable market, strong repeat base | 4-5% | Gourmet Marketing, 2026 |
| Competitive or compressed market | 6-8% | Gourmet Marketing, 2026 |
| Luxury holding position in a saturated market | Up to 12% | Gourmet Marketing, 2026 |
| New build, post-renovation, or repositioning | 10-15% | Gourmet Marketing, 2026 |
| Independent hotel, general guidance | 4-6% | The Lobby, 2026 |
Where the cross-industry number sits by comparison
Chief Marketer's report on the Gartner 2026 CMO Spend Survey puts the cross-industry average marketing budget at roughly 7.8% of revenue, with travel and hospitality sitting below 7% — one of the lowest verticals Gartner tracks. The same survey found martech's share of marketing budget falling to a five-year low of 19.4%, down from 26.6% in 2021, while paid media's share reached a five-year high of 31.4%.
Hospitality sitting below the cross-industry average, while simultaneously being told by hospitality-specific guides to spend more than that average, is not a contradiction. It reflects how much of the industry's addressable "marketing" spend has historically been outsourced to OTAs in the form of commission rather than booked as an internal marketing line.
The OTA commission a marketing budget is competing against
Cloudbeds reports that OTA commission rates have climbed from roughly 10% a decade ago to a current range of 15% to 30%+, depending on platform and negotiating leverage, and that OTA bookings cancel at 21.8% in 2025 against 10.6% for direct bookings. RevPerfect's worked example on a mid-size property found OTA revenue growing from 41% to 58% of the room book in eighteen months while the property paid an extra AUD 340,000 in commission to capture that RevPAR growth — a cost that never appeared on the RevPAR dashboard itself.
| Channel | Typical acquisition cost | Cancellation rate | Owns the guest data? |
|---|---|---|---|
| OTA booking | 15-30%+ commission | 21.8% | No |
| Direct web booking | Booking-engine fee only | 10.6% | Yes |
| Corporate negotiated | ~3% (TMC fee) | Lower, contract-bound | Partial |
| Wholesale | ~20% net rate | Varies by contract | No |
Where the highest-ROI budget lines sit
The Lobby's 2026 channel benchmarks put email marketing at the top of hotel marketing ROI, reporting a 3,000% to 5,000% return, with SEO next at a reported 400% to 900% return that needs 9 to 18 months to reach full performance. Both are owned channels: neither carries a per-booking commission, which is why they out-earn paid acquisition on a pure-ROI basis even though they cannot replace OTA volume outright for a property still building direct demand.
Our growth marketing practice treats that owned-versus- rented distinction as the first budget decision for any business fighting a channel-commission problem, hospitality or otherwise.
| Channel | Reported ROI (2026) | Time to full performance | Commission exposure |
|---|---|---|---|
| Email marketing | 3,000-5,000% | Immediate to a few months | None |
| SEO | 400-900% | 9-18 months | None |
| Website/CRO | Fast payback, not quantified | Weeks to months | None |
| OTA-driven bookings | Net of 15-30%+ commission | Immediate | High, recurring |
Why 2027 will not look like 2026
Gourmet Marketing's analysis of the same CoStar data flags a planning trap: 2026's growth was inflated by one-off demand. US GDP is forecast to accelerate to 2.6% in 2027 against 2.2% in 2026, with inflation easing toward 2.3%, so the macro backdrop is not the risk. The risk is the comparison base: June and July 2027 will lap World Cup and America 250 rate premiums that will not repeat, which is most of why ADR growth is forecast to decelerate to 1.6% for the full year but 2.1% once those two months are excluded. A budget built by simply indexing up 2026's percentages will overpromise in Q2 2027 and miss in Q3.
One tailwind is still building rather than fading: among luxury and upper-upscale properties, transient demand is up 3.0% year to date against group demand up only 1.8%. Group recovery, not transient demand, is where the 2027 upside sits — which argues for weighting 2027 marketing spend toward the sales and events pipeline sooner rather than later.
| 2027 planning input | Figure | Implication for the budget |
|---|---|---|
| US GDP growth forecast | 2.6% (vs. 2.2% in 2026) | Macro backdrop supports spend, not a cut |
| Inflation forecast | 2.3%, easing | Cost pressure moderates, doesn't reverse |
| ADR growth, full year 2027 | 1.6% | Weaker than the 2.1% ex-June/July figure |
| Transient demand growth, luxury/upper-upscale | +3.0% YTD | Carried 2026, will not repeat unaided |
| Group demand growth, luxury/upper-upscale | +1.8% YTD | The real 2027 upside, still under-built |
What "marketing" has to mean before you set a percentage
Gourmet Marketing makes a definitional point worth settling before any percentage target is argued in a budget meeting: the Uniform System of Accounts for the Lodging Industry (USALI) bundles sales and marketing payroll, franchise fees and loyalty program charges into a single line, which is why hotel marketing spend can look large on the P&L while still reading as tiny against cross-industry benchmarks. Two scoping questions decide which number you are actually comparing: does metasearch spend belong in marketing or in distribution, and does sponsored OTA placement count as marketing when it sits inside a channel you already pay commission on. A recommended scope — campaigns and paid media, platform and technology, content and photography, website and booking engine, SEO, CRM and email, and PR, with payroll and commission both excluded — is what the 4% to 8% guidance above is actually measuring, and it is worth saying that scope out loud in the room before defending the number.
Turning the forecast into a budget line
A defensible 2026 budget starts from the property's own chain-scale position on CoStar's forecast, not from a flat percentage. A luxury property riding a 5.9% ADR wave should weight spend toward retention and direct-channel protection, since most of its 2026 growth is rate that an OTA commission can quietly erode. A midscale property whose RevPAR growth is coming from occupancy should weight spend toward demand generation, since it has fewer rate gains to protect and more empty room-nights to fill.
Either way, the gap between 2.5% actual spend and the 4% to 8% recommended range is the number a marketing director should be defending in the 2026 budget conversation — not against an arbitrary industry rule of thumb, but against the specific OTA commission math shown above. If you want that math run against your own channel mix, our team can build the comparison, and our breakdown of what paid search actually costs is a useful companion for the direct-channel side of the budget.
Frequently Asked Questions
How fast is RevPAR actually growing in 2026?
CoStar and Tourism Economics upgraded their full-year 2026 US RevPAR forecast to 4.4% growth, up from an earlier 2.8% projection, after hotels sold 11.4 million more room nights in the first half of the year than in the same period of 2025 and room revenue climbed more than USD 5.4 billion. Occupancy is now projected at 63.1% and average daily rate growth at 3.1%. Growth is forecast to slow to 2.1% in 2027 as the World Cup and semiquincentennial event boost fades.
What share of revenue should a hotel budget for marketing?
Published guidance clusters around 4% to 8% of total revenue excluding sales and marketing payroll, with established properties in stable markets nearer 4% to 5% and competitive or newly repositioned properties nearer 10% to 15%. That sits well above what most hotels currently spend: multiple hospitality-specific analyses put actual average spend under 2.5% of room revenue once payroll is included, against a Gartner-reported cross-industry average of 7.8% of revenue and a sub-7% average for the travel and hospitality vertical specifically.
Why does RevPAR growth change the marketing math?
RevPAR growth driven mainly by rate, as CoStar expects through 2026, rewards channels that protect margin on every booking. A booking through an OTA at a 15% to 30% commission gives back a large share of that rate gain before it reaches the property's books, while a booking through a hotel's own site or email list keeps the full lift. The budget question is less 'how much to spend' and more 'how much of the rate gain to protect by shifting mix toward direct channels.'
Is luxury RevPAR growth different from economy RevPAR growth?
Yes, and the marketing implication is different too. CoStar's Q3 2026 forecast has luxury chain-scale average daily rate growing 5.9% for the year with double-digit RevPAR growth in Q2 and Q3, while select-service properties are expected to land closer to 3.6% RevPAR growth on 2.5% ADR growth. Midscale and economy RevPAR growth is coming mostly from occupancy, not rate, which argues for a different budget split: more spend on demand generation, less on rate-protection tooling.
What is the highest-ROI hotel marketing channel right now?
Published hotel-specific benchmarks put email marketing at the top of the list, with a reported 3,000% to 5,000% return, ahead of SEO at a reported 400% to 900% return that takes nine to eighteen months to mature. Both channels build owned reach that does not carry a per-booking commission, which is the structural reason they outperform paid acquisition on a pure-ROI basis even though they will not replace OTA volume on their own.
Sources
CoStar - CoStar, Tourism Economics upgrade U.S. hotel growth forecast
CoStar - U.S. Hotel Forecast Assumptions, Q3 2026
Chief Marketer - Gartner CMO Spend Survey coverage, 2026
Scale Growth Digital - Marketing budget guide for hospitality
The Lobby - Hotel marketing ROI benchmarks 2026
Cloudbeds - A guide to OTA commission rates in 2026
RevPerfect - OTA commission rates in 2026: the real cost of distribution
Gourmet Marketing - Your 2027 hotel marketing budget is built on a year that had the World Cup in it


