



Table of contents
Hotels that replace a static rate card with an automated revenue management system report average occupancy gains of 8% and average daily rate gains of 11%, yet more than a quarter of midscale and upscale properties, and the majority of independents, are still pricing off a spreadsheet in 2026. This page lays out what the data actually shows on both sides of that gap.
Key Takeaways
- 72% of midscale and upscale hotels used automated pricing in 2025, up from 54% in 2020.
- Independent-hotel RMS adoption sits at roughly 41%, far behind chains.
- 76% of chain hotels had implemented automated pricing tools by 2025.
- Average occupancy gains reach 8% after RMS implementation.
- Average daily rate improves 11% after RMS implementation.
- Manual pricing tasks drop 43% once automated pricing is in place.
- Occupancy forecasting accuracy reaches 91% with automated systems.
- Rate updates rise from 4 a week to 27 a week after RMS deployment.
- Independent properties see 5% to 20% RevPAR uplift in year one.
- Most independents land at 10% to 15% uplift within 6 to 12 months.
- 63% of hotels use AI in some form for revenue management, the largest AI entry point.
- 78% of surveyed hotel chains already use AI, and 89% plan to expand it.
- More than half of hotels use or are procuring generative AI as of 2026.
- Fewer than 1 in 10 see a 30%-plus cut in manual work from that AI.
- The global RMS market is valued near USD 2.89 billion in 2026, growing at 10.53% CAGR.
- Cloud deployment represents 68% of active RMS installations.
- 52% of hotels plan to upgrade to AI-enhanced RMS within two years.
- Direct-booking conversion improves 14% when RMS integrates with the booking engine.
The adoption gap: mature technology, uneven uptake
HotelTechUpdate's reporting on Skift Research is blunt about the mismatch: revenue management systems have been available for decades, and the technology is mature, but only a minority of hotels actually run one. The barriers identified are not algorithmic — they are cost and integration effort for a single property or small portfolio, data quality in the underlying property management system, and a trust gap where revenue managers feel a spreadsheet is controllable while an automated recommendation feels like a black box.
Market-size data backs up the scale of that gap: 72% of midscale and upscale hotels globally used at least one automated revenue optimization platform in 2025, up from 54% in 2020, but independent-hotel adoption sits at roughly 41% — the split that decides who is winning RevPAR growth and who is not.
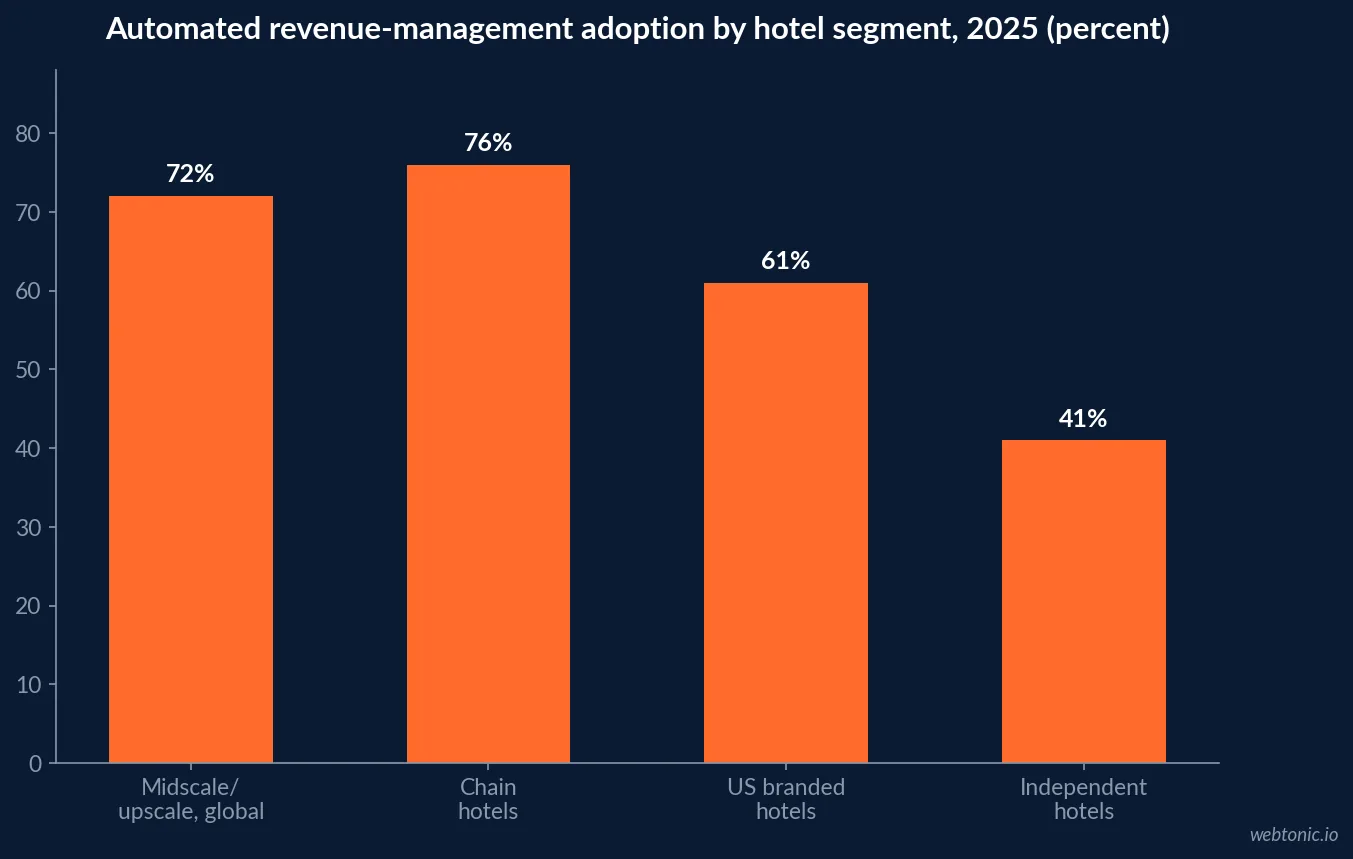
| Hotel segment | Automated pricing adoption | Year | Notes |
|---|---|---|---|
| Midscale/upscale, global | 72% | 2025 | Up from 54% in 2020 |
| Chain hotels | 76% | 2025 | Implemented automated pricing tools |
| US branded hotels | 61% | 2025 | Dedicated RMS platform |
| Independent hotels | ~41% | 2025-2026 | Furthest behind on adoption |
| Cloud-based RMS installs | 68% | 2025 | Share of active installations |
What switching from static to dynamic pricing actually delivers
Market research on hotel revenue management systems reports that hotels implementing an RMS see average occupancy gains of 8% and average daily rate improvement of 11%, with manual pricing tasks reduced 43% and occupancy forecasting accuracy improving to 91%. The frequency of price changes itself shifts: dynamic rate updates rise from roughly 4 updates a week to 27 updates a week after deployment, and integration with the booking engine improves room conversion rates by 14%. RevEvolve's comparison of 14 RMS platforms reports independent properties typically landing 10% to 15% RevPAR uplift within 6 to 12 months of switching from manual pricing, inside a wider first-year range of 5% to 20%.
| Metric after RMS adoption | Reported change | What it measures |
|---|---|---|
| Occupancy | +8% average | Rooms sold against available inventory |
| Average daily rate | +11% average | Realized rate per sold room |
| Manual pricing tasks | -43% | Revenue manager hours spent on manual rate entry |
| Occupancy forecasting accuracy | 91% | Forecast versus actual occupancy |
| Rate updates per week | 4 to 27 | Frequency of price recalculation |
| Independent-hotel RevPAR uplift, year 1 | 5-20%, typically 10-15% | First 6-12 months post-switch |
The size of the market chasing this gap
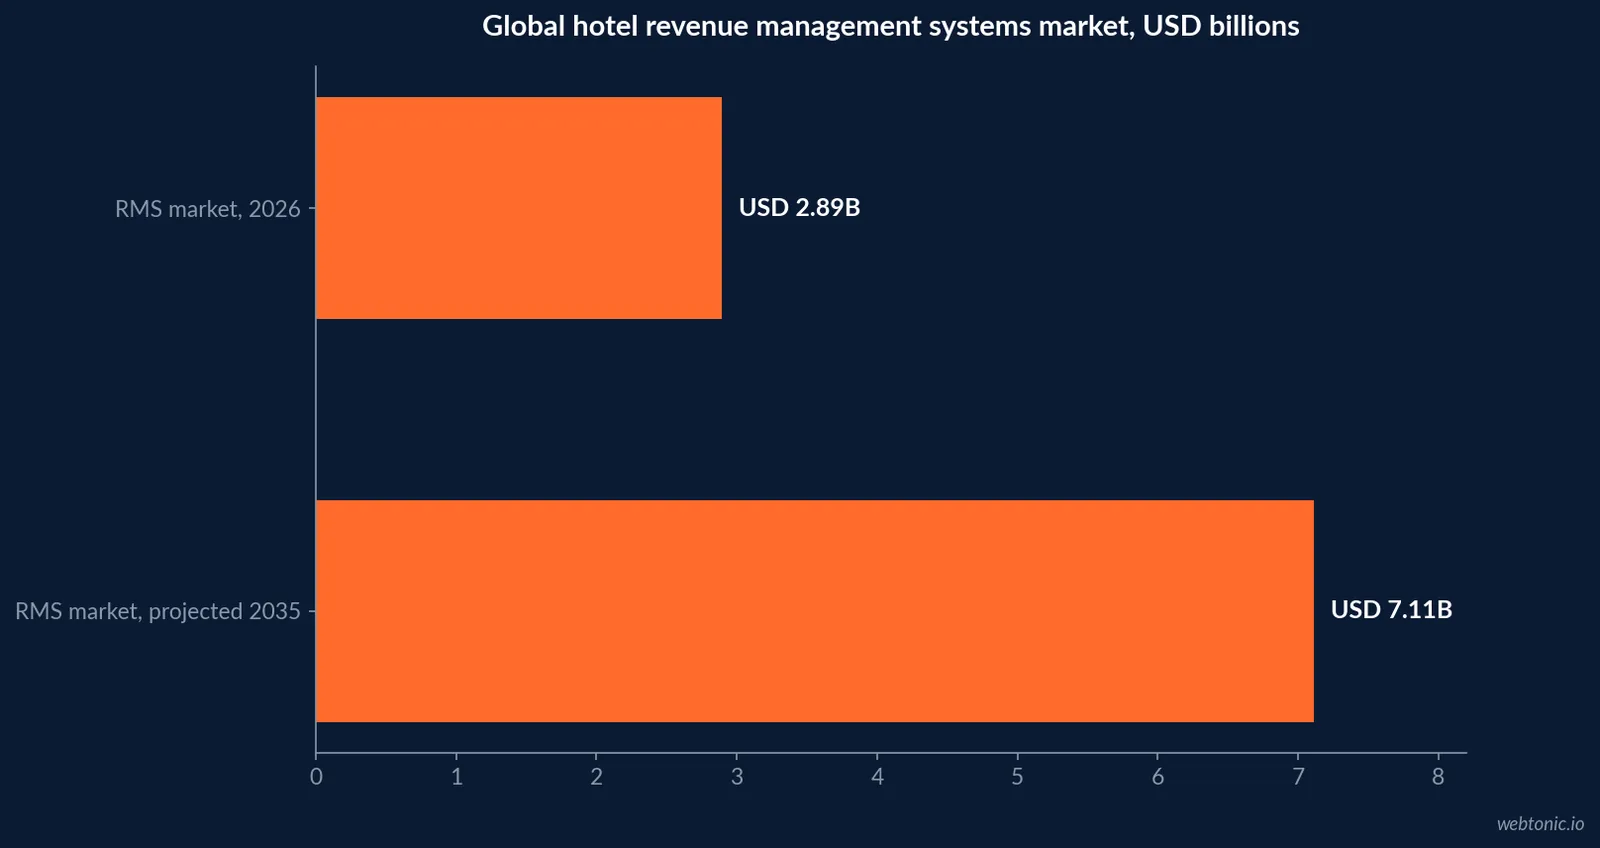
The global hotel revenue management systems market is valued at roughly USD 2.89 billion in 2026, projected to reach USD 7.11 billion by 2035 at a 10.53% compound annual growth rate, with cloud deployment already at 68% of active installations and 52% of hotels surveyed planning to upgrade to AI-enhanced RMS within two years. That growth curve is being pulled by the properties still on a spreadsheet, not by the chains that adopted a decade ago.
Adoption is not the same as impact
The NYU SPS, RateGain and HEDNA State of Distribution 2026 report, drawn from over 270 hotel brands and 58,000-plus properties, found that more than half of hotels now use or are procuring generative AI, yet fewer than one in ten say it has reduced their manual work by more than 30%. The report attributes the gap to trust, data privacy limits and governance gaps that keep hotels using AI for assistance while remaining cautious about letting it act on pricing independently.
Separately, hotel-specific tracking puts 63% of hotels using AI in some form for revenue management specifically — the single largest entry point for AI in hospitality — with 78% of surveyed hotel chains already live and 89% planning to expand that use.
| Finding (2026) | Figure | Source |
|---|---|---|
| Hotels using or procuring generative AI | >50% | NYU SPS / RateGain / HEDNA |
| Hotels reporting >30% manual-work reduction | <10% | NYU SPS / RateGain / HEDNA |
| Hotels using AI for revenue management | 63% | Lighthouse, cited via Guestara |
| Hotel chains already using AI | 78% | H2c 2025 study, 171 chains |
| Hotel chains planning to expand AI use | 89% | H2c 2025 study |
Why the pattern is bigger than hotels
The same shift from fixed to demand-responsive pricing is documented across other perishable- inventory industries. Airline revenue management pioneered the discipline in the 1980s, and BCG's 2026 Air Travel Outlook reports revenue per available seat kilometer continuing to rise as carriers lean on greater premium-fare segmentation and tighter capacity discipline, even as costs per seat kilometer climb faster than revenue. A technical review of AI-driven revenue management by Rield puts documented 2025-2026 gains at 2% to 5% revenue in retail and 10% to 35% RevPAR in independent hospitality specifically, describing a fourth wave of agentic, hybrid parametric-plus-AI pricing models succeeding the machine-learning wave that ran from 2015 to 2024.
Regional pricing swings tracked by Lighthouse's H1/H2 2026 global hospitality pricing report — Europe up 6.2% year over year in H1 2026, North America down 8.9% over the same window, Vietnam up 36% — are themselves evidence for the dynamic case: a rate card fixed at the start of the year would have missed all three moves.
| Region (H1 2026) | Advertised hotel price change YoY | What a static rate card would have missed |
|---|---|---|
| Europe | +6.2% | Third consecutive half of leading price growth |
| North America | -8.9% | World Cup bounce shifted into H2 |
| Asia | +1.8% | First positive reading after years of declines |
| Vietnam | +36% | Largest single-country move in the dataset |
| UAE | -48.1% | Steepest advertised decline of any country tracked |
What automated pricing actually changes operationally
The operational shift is bigger than the headline uplift numbers suggest. Market data on RMS deployments finds direct booking optimization through automated systems improving conversion efficiency by 14%, mobile dashboard usage among revenue managers reaching 63%, and integration with property management systems reaching 83% among enterprise operators. 81% of revenue managers using automated analytics report improved decision speed. None of those figures are the pricing algorithm itself — they are the workflow changes that make the pricing algorithm usable day to day, which is the part a vendor demo tends to skip.
| Operational metric after RMS adoption | Reported figure |
|---|---|
| Direct-booking conversion efficiency | +14% |
| Revenue managers using mobile dashboards | 63% |
| PMS integration among enterprise operators | 83% |
| Revenue managers reporting faster decisions | 81% |
| Chain hotels with AI-enabled forecasting | 49% |
What this means for a pricing decision in 2026
The measured case for dynamic pricing is not that it beats static pricing in theory — it is that the properties and carriers already running it are documenting 8% to 11% gains on the metrics that matter, while more than half the market is still pricing manually and citing cost, integration effort and trust as the reasons why. Closing that gap does not require betting on full autonomy: the NYU SPS data shows hotels can adopt AI for research and recommendation while keeping a human in the pricing decision, which is closer to how most of the measured gains above were actually won.
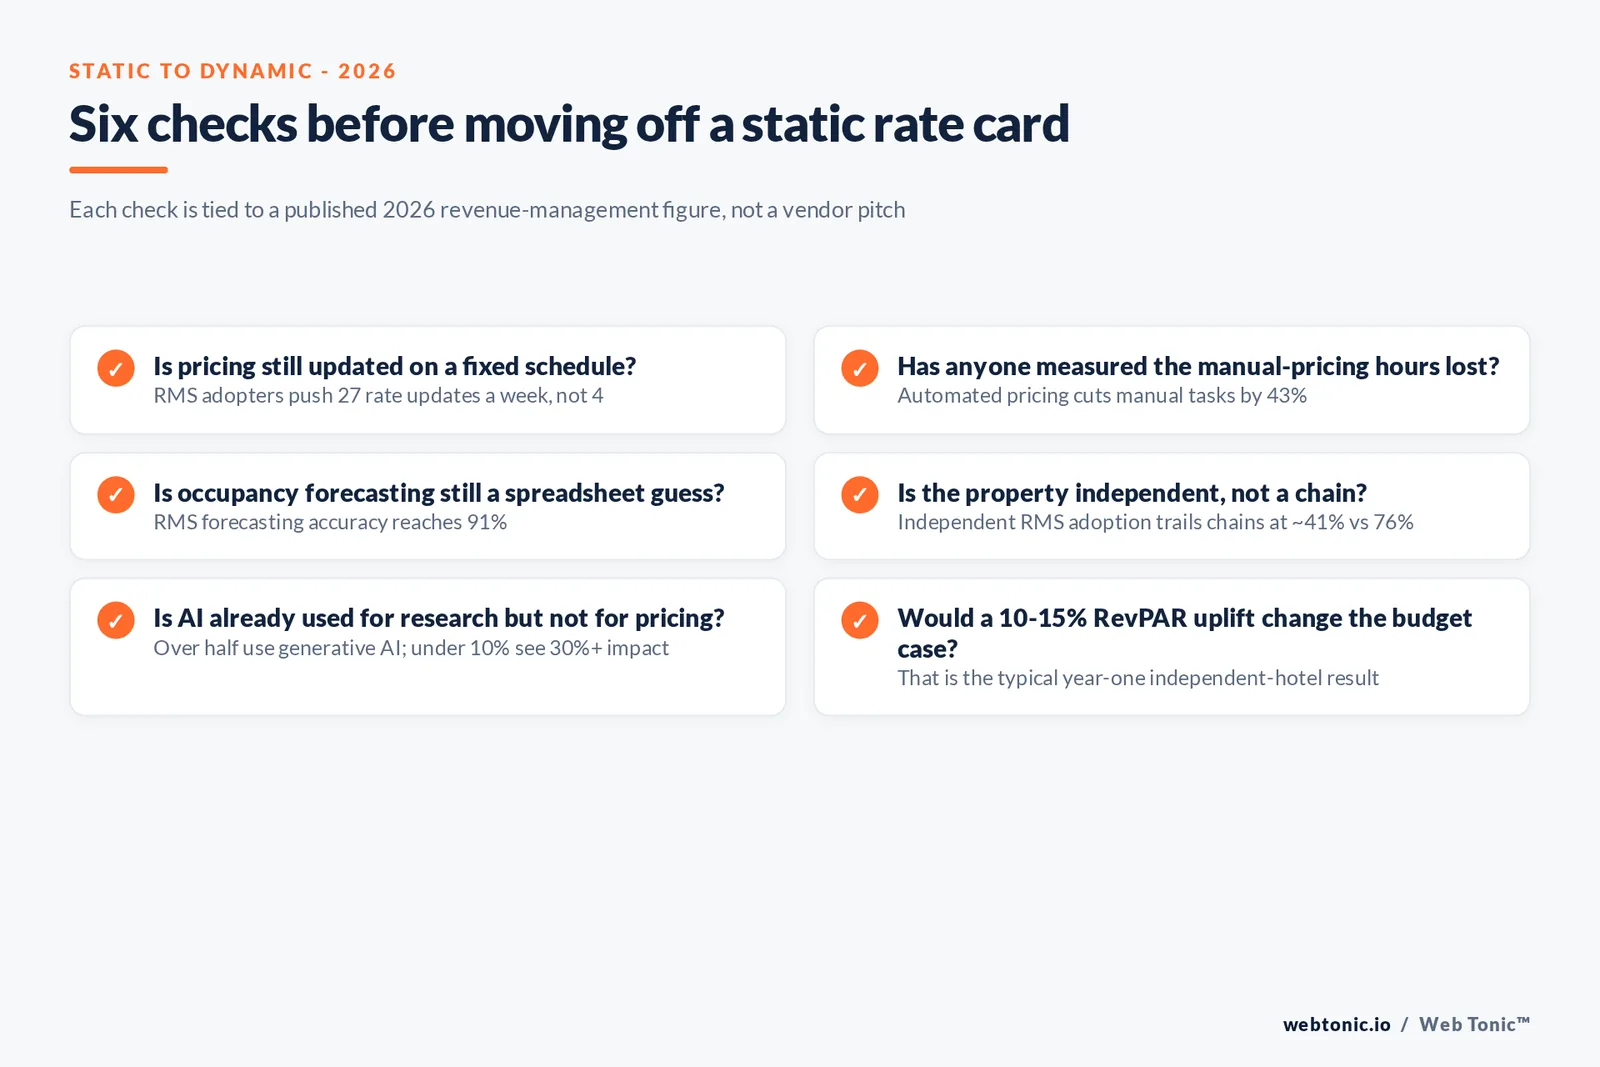
The practical starting point is not "buy an RMS," it is auditing which of the operational metrics above your business is already missing: forecasting accuracy under 80%, fewer than a dozen price changes a week, or a manager still exporting data to a spreadsheet before a pricing decision gets made. Each of those is a specific, measurable gap that automation closes, which is a more defensible budget conversation than a general appeal to "modernizing" pricing.
If your pricing or growth model needs the same kind of demand-responsive rebuild, our data and analytics practice builds the forecasting layer underneath that decision, our growth marketing team turns it into a channel plan, and we're happy to walk through what that looks like for your business.
Frequently Asked Questions
What is the actual difference between static and dynamic pricing?
Static pricing sets a rate (or rate card) in advance and holds it regardless of real-time demand; dynamic pricing recalculates the price continuously against demand signals, competitor rates, and booking pace. In hospitality this is the difference between a fixed seasonal rate sheet and a revenue management system (RMS) that can push more than 25 rate updates a week instead of roughly four, according to 2026 market data. The mechanism is not exotic; the gap is in how often the price is allowed to move.
Does dynamic pricing measurably outperform static pricing?
The measured cases say yes, with a range rather than a single number. Market research on hotel revenue management systems reports average occupancy gains of 8% and average daily rate improvement of 11% after implementation, with manual pricing tasks cut 43% and forecasting accuracy reaching 91%. Independent hoteliers moving off manual pricing report 5% to 20% RevPAR uplift in the first year, landing at 10% to 15% within 6 to 12 months for most properties.
If dynamic pricing works, why do so many businesses still price statically?
Skift Research's finding, reported by HotelTechUpdate, is that sophisticated revenue management systems remain the exception rather than the rule despite the technology being mature. The barriers are not the algorithm: they are cost and integration effort for a single property, data quality in underlying booking systems, and a trust gap where revenue managers are reluctant to hand pricing authority to a system they cannot fully audit.
How much of the industry has actually adopted automated pricing?
More than 72% of midscale and upscale hotels globally used at least one automated revenue optimization platform in 2025, up from 54% in 2020, and 76% of chain hotels had implemented automated pricing tools by the same year. Independent hotels lag far behind at roughly 41% adoption, which is the gap that separates who is winning on RevPAR and who is still pricing off a spreadsheet.
Does adopting the technology guarantee the revenue gain?
No. The NYU SPS, RateGain and HEDNA 2026 State of Distribution report, drawn from more than 58,000 properties, found that more than half of hotels now use or are procuring generative AI, yet fewer than one in ten say it has reduced manual work by more than 30%. Adoption and impact are running at different speeds, and the gap is attributed to trust, data privacy limits, and governance gaps that cap how much pricing autonomy hotels are willing to hand to a system.
Sources
Business Research Insights - Hotel Revenue Management Systems (RMS) Market report
HotelTechUpdate - Revenue management's stubborn adoption gap (Skift Research)
NYU SPS - State of Distribution 2026 (with RateGain and HEDNA)
Guestara - Hotel AI statistics 2026 (Lighthouse, H2c data)
RevEvolve - Hotel revenue management software, 2026 guide
Rield - AI revenue management, the 2026 technical guide
BCG - Air Travel Outlook 2026: Revenues and Costs Are Rising
Lighthouse - The state of global hospitality pricing, H1/H2 2026


