



Table of contents
A 5% improvement in customer retention still produces more than a 25% increase in profit, and that math has held since Bain first published it. This page pairs that classic finding with 2026 churn benchmarks across nine industries from Recurly's subscription network, so retention rate has a number to be measured against.
Key Takeaways
- A 5% retention increase produces a 25%+ profit increase in financial services (Bain).
- Below 2% annual churn is strong performance across almost any subscription segment.
- 2% to 4% annual churn is the benchmark zone for well-run subscription businesses.
- SaaS median annual churn is 3.04% to 3.22%, the lowest of the tracked verticals.
- Business and Professional Services runs 3.21% to 3.44% median annual churn.
- Ecommerce and subscription boxes run 4.25% median annual churn.
- Education has the highest voluntary churn rate, at 3.30%.
- Involuntary churn falls to 0.18% at the $250-plus ARPC tier.
- The $10-$25 ARPC band carries the highest overall churn, at 4.29% median.
- Pause options increased pause usage by 337% where offered.
- About 3 in 4 paused subscribers return within months.
- Nearly 1 in 4 new subscriptions come from a win-back of a previously cancelled customer.
- Annual plans deliver 50% to 60% higher revenue per user than monthly plans.
- 77% of consumers are holding their subscription counts steady in 2026.
Why a small retention gain is worth a large profit gain
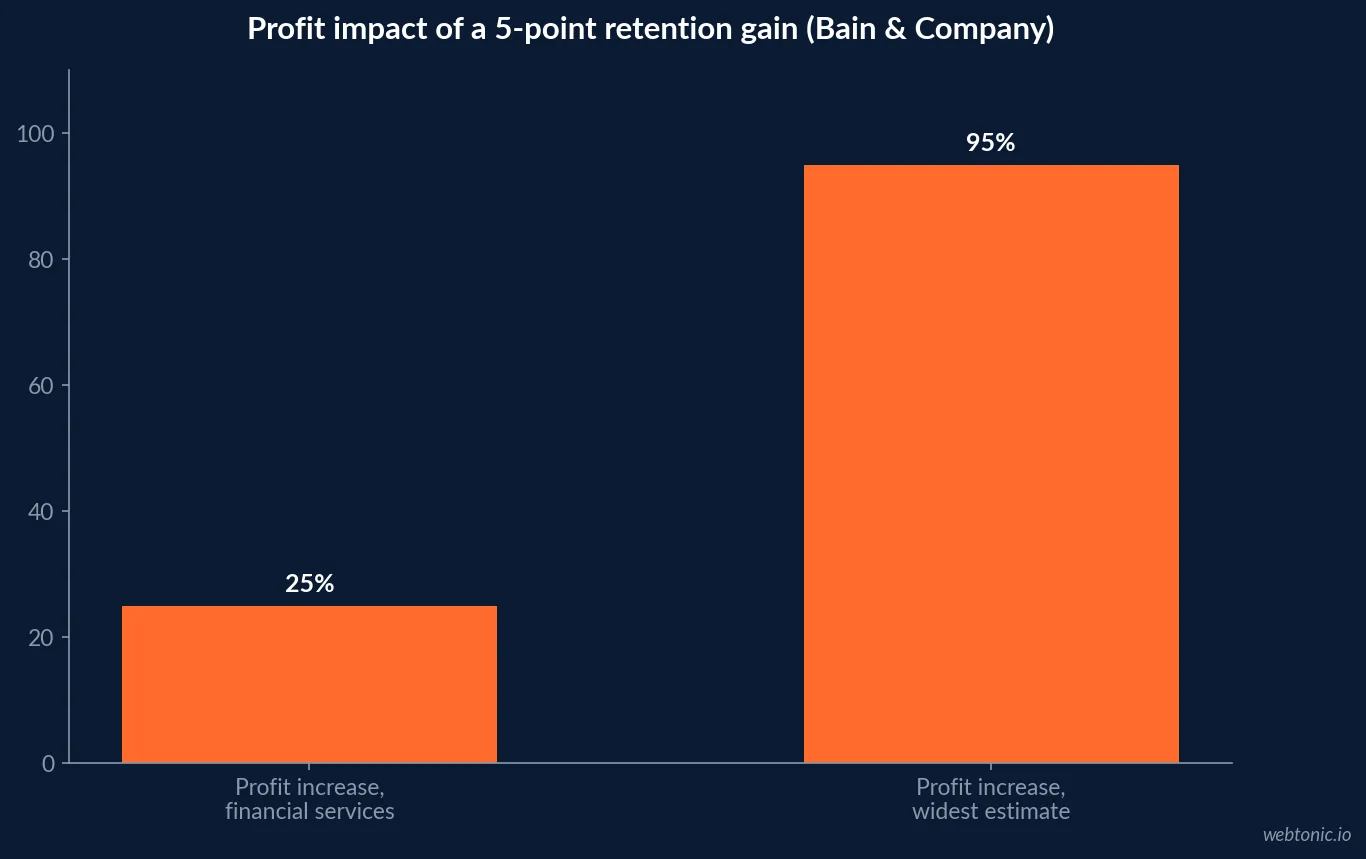
Bain & Company's original research on customer retention, still the most cited figure in the field, found that increasing retention by as little as 5% can boost profits by as much as 95%, with the effect in financial services alone measured at more than a 25% increase in profit. Bain's own follow-up analysis explains the mechanism: retained customers buy more each year they stay, the cost of serving them declines as the relationship matures, and they refer others — three separate effects that all move in the same direction at once.
That compounding is also why a retention number cannot be read in isolation. A business at 90% annual retention and one at 95% look five points apart on paper, but the profit and lifetime-value gap between them is considerably wider than five points once the compounding is accounted for.
| Retention effect (Bain & Company) | Reported figure | Mechanism |
|---|---|---|
| Retention gain modeled | 5 percentage points | Baseline used across the research |
| Resulting profit increase, financial services | >25% | Lower servicing cost, more cross-sell |
| Resulting profit increase, widest estimate | Up to 95% | Compounding across acquisition, cost-to-serve, referral |
| Why the effect compounds | Retained customers buy more each year | Spend grows as trust grows |
| Second compounding factor | Serving costs decline over the relationship | Fewer onboarding and support touches needed |
Cross-industry churn benchmarks for 2026
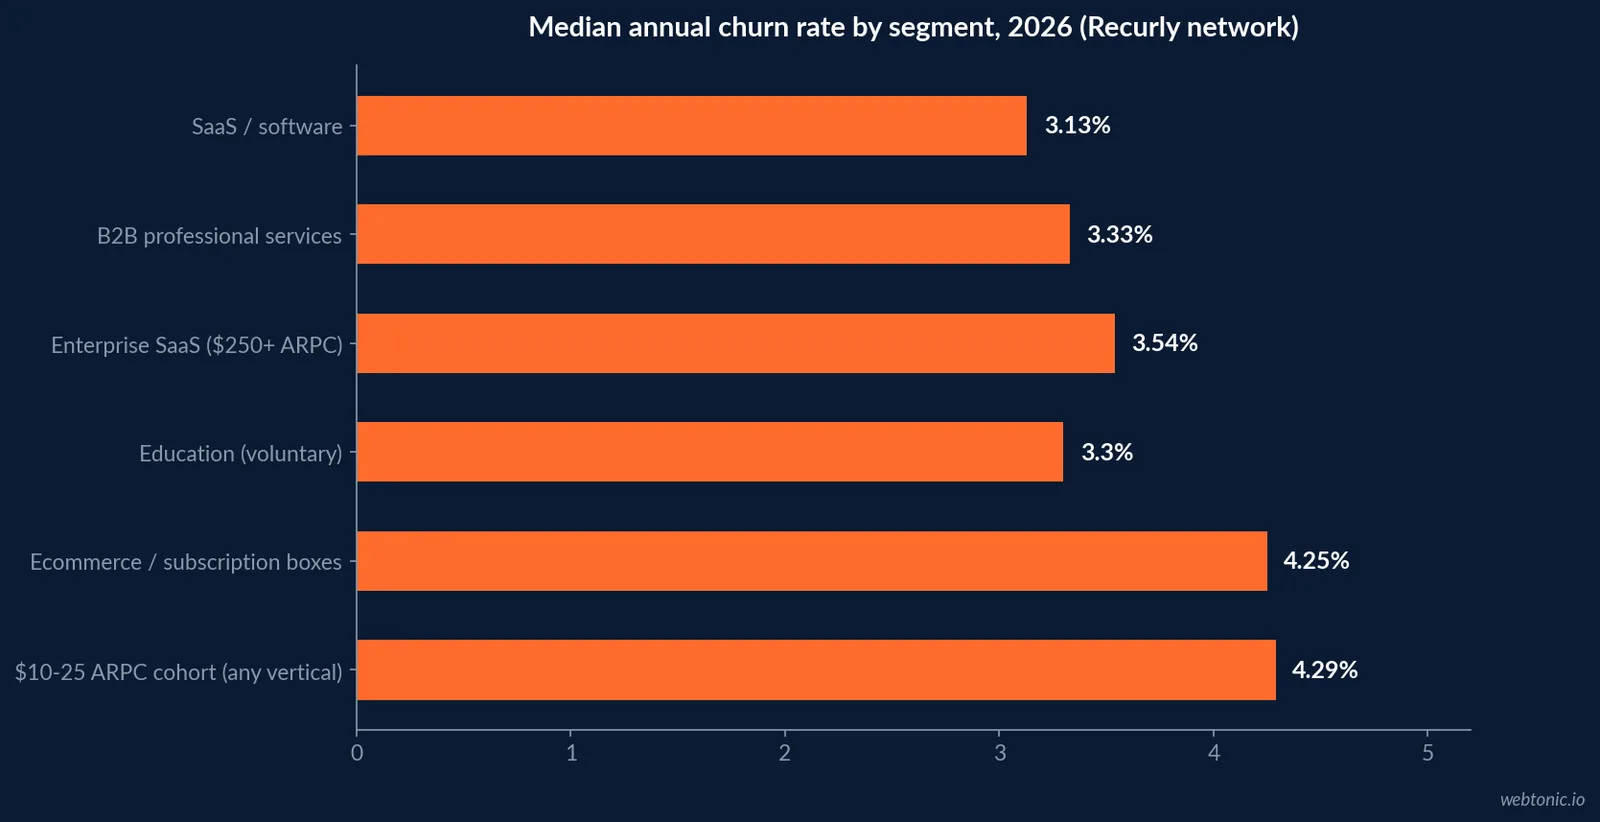
Recurly's July 2026 benchmark data, drawn from its network of subscription businesses, sets three broad zones: below 2% annual churn is strong performance across almost any segment, 2% to 4% is where most well-run subscription businesses operate, and above 5% is worth investigating regardless of vertical. Within that range, SaaS and Business and Professional Services sit at the low end because longer contracts and higher switching costs make cancellation a bigger decision; ecommerce and subscription boxes sit higher because low price points make cancellation an easy one.
| Industry (Recurly network, 2026) | Median annual churn | What drives the level |
|---|---|---|
| SaaS / software | 3.04% - 3.22% | Longer contracts, higher switching cost |
| Business and Professional Services | 3.21% - 3.44% | Multi-seat, relationship-driven |
| Enterprise SaaS ($250+ ARPC) | 3.54% overall, 0.18% involuntary | Better payment methods at high ARPC |
| Digital Media and Entertainment | 2.55% voluntary, 1.59% involuntary | Payment recovery gap, not intent |
| Education | 3.30% voluntary (highest tracked) | Engagement and value problem |
| Ecommerce / subscription boxes | 4.25% | Low price points, impulse signups |
| $10-$25 ARPC cohort (any vertical) | 4.29% overall (highest band) | Price sensitivity without deep engagement |
Voluntary versus involuntary churn: two different fixes
Recurly separates churn into two categories that need entirely different responses. Voluntary churn is a subscriber actively deciding to leave, which reflects an engagement or perceived-value problem and is fixed with onboarding, usage nudges and win-back offers, not discounts. Involuntary churn is a payment failure — an expired card, a bank fraud flag, insufficient funds — and the subscriber often does not even realize the subscription lapsed.
Involuntary churn falls sharply as revenue per customer rises: it is just 0.18% at the $250-plus ARPC tier versus 1.30% at the $10 to $25 ARPC tier, because higher-value subscribers tend to use better payment methods and resolve failed payments faster. Across the Recurly network, businesses recovered real money by treating this as a program rather than an afterthought: SaaS businesses recovered over $155 million and digital media over $100 million in reclaimed revenue through dunning and payment-recovery tools.
| Recovery category (Recurly network) | Revenue recovered | Driven by |
|---|---|---|
| SaaS | >$155 million | Automated dunning, high-value payment methods |
| Digital Media | >$100 million | Retry logic on failed renewals |
| Ecommerce | >$34 million | Card-update and retry flows |
| Business and Professional Services | >$19 million | Predictable B2B billing cycles |
| Publishing | >$15 million | Subscription renewal recovery |
| Education | >$8 million | Smaller base, still a recoverable share |
Net revenue retention: the metric that also counts expansion and shrinkage
Churn rate only measures loss. Net revenue retention (NRR) also captures upgrades, downgrades and reactivations, which is why B2B software boards track it as the headline health metric. ChartMogul's analysis of roughly 3,500 software companies puts median B2B SaaS NRR at 82%, with the upper quartile reaching 97%. B2C SaaS is far less sticky, with a median NRR of just 49% because there is minimal upsell motion to offset cancellations. AI-native companies in the same dataset showed a median gross revenue retention of only 40%, though that figure has improved sharply within the year as early "tourist" usage churned out and remaining customers moved from experimentation toward production use.
On the operating side, Gainsight's 2025 Customer Success Index, covering more than 400 companies, found that mature customer success operating models spend a median of just 3% of revenue on CS while less mature organizations spend roughly 8% for comparable retention outcomes — evidence that the process maturity behind a retention number matters as much as the headcount funding it.
| Retention metric (2026) | Figure | Source |
|---|---|---|
| B2B SaaS median net revenue retention | 82% | ChartMogul, ~3,500 companies |
| B2B SaaS upper-quartile NRR | 97% | ChartMogul |
| B2C SaaS median NRR | 49% | ChartMogul |
| AI-native companies median gross revenue retention | 40% (up from 27% in January) | ChartMogul |
| CS spend as % of revenue, mature operating model | ~3% | Gainsight 2025 Customer Success Index |
| CS spend as % of revenue, less mature model | ~8% | Gainsight 2025 Customer Success Index |
The retention levers that measurably work
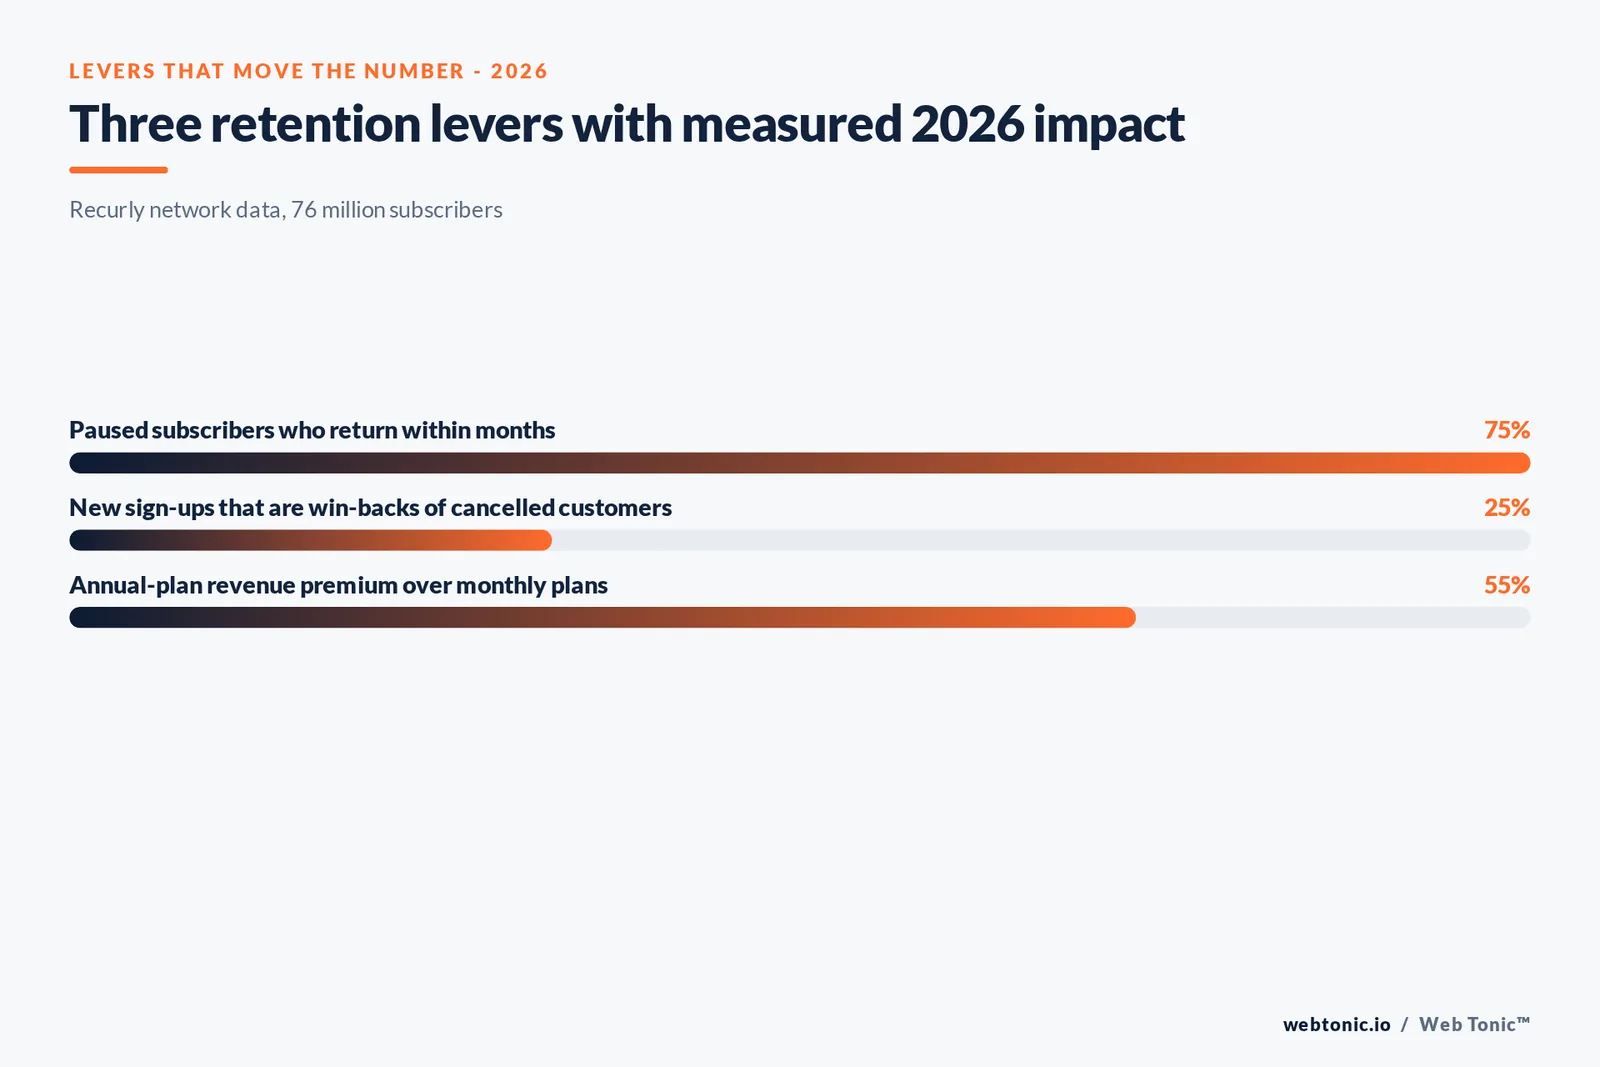
Recurly's 2026 State of Subscriptions report, built from data behind 76 million subscribers, quantifies three levers worth prioritizing before chasing a lower headline churn number. Offering a pause option instead of a hard cancel increased pause usage by 337% where brands offered it, and roughly 3 out of 4 of those paused subscribers came back within months. Separately, nearly 1 in 4 new subscriptions on the network now comes from a previously cancelled customer, making structured win-back campaigns one of the most cost-effective growth levers available, since reactivating a known customer costs less than acquiring a new one. Annual plans, despite carrying a higher-risk renewal milestone, deliver 50% to 60% higher revenue per user than monthly plans.
77% of consumers report holding their overall subscription count steady in 2026, which means the fight for a given subscriber's budget is increasingly won or lost on retention mechanics like these rather than on net-new acquisition.
Why customers actually leave: the service-side driver
Churn benchmarks describe the outcome; Zendesk's 2026 CX Trends report, based on more than 11,000 consumers and business leaders across 22 countries, describes the mechanism. 85% of CX leaders say customers will drop a brand over a single unresolved issue, even on first contact, and 86% of consumers say responsiveness and accuracy strongly influence their purchasing decisions. Separately, 74% of consumers say they get frustrated when they have to repeat information already given to a brand, and 81% want a representative to pick up exactly where a previous interaction left off.
That is voluntary churn's service-side trigger in numbers: not a pricing decision, but a friction moment the brand created. It is also the fastest lever available to a team that cannot wait for a full onboarding redesign — fixing repeat-information friction alone addresses a complaint 74% of consumers report having.
| Service-side churn driver (Zendesk 2026 CX Trends, n=11,000+) | Figure |
|---|---|
| CX leaders: one unresolved issue is enough to lose a customer | 85% |
| Consumers: responsiveness/accuracy strongly influence purchase decisions | 86% |
| Consumers frustrated by repeating information to a brand | 74% |
| Consumers who want service to resume from a prior interaction | 81% |
| Consumers who expect brands to tailor support to prior interactions | 67% |
Why the fight for a subscriber's budget is now a retention fight
HubSpot's 2026 State of Marketing Report, surveying 3,400 marketers, found lead-to-customer conversion ranking as the second most important KPI across companies of every size — evidence that marketing organizations are already being measured on what happens after the first sale, not just before it. Paired with Recurly's finding that 77% of consumers are holding subscription counts steady this year, the practical read is the same from both the marketer's side and the consumer's side: 2026 is a year of managing an existing base carefully rather than a year of aggressive net-new acquisition.
How to read your own retention number against these benchmarks
Match your business model to the closest Recurly segment before comparing, separate your voluntary churn from your involuntary churn before diagnosing either, and remember Bain's compounding math means a retention improvement that looks marginal on a scorecard is rarely marginal on the P&L. A retention program that only tracks the blended churn number is missing where the actual leverage sits — usually in payment recovery at the low end and in onboarding at the high end.
Our data and analytics practice builds the cohort-level retention reporting that separates voluntary from involuntary churn, and our growth marketing team designs the win-back and pause flows that Recurly's data shows actually move the number. Want your own churn number benchmarked against these? Get in touch.
Frequently Asked Questions
What counts as a good annual churn rate in 2026?
On Recurly's subscription network, below 2% annual churn is strong performance across almost any segment, 2% to 4% is the range where most well-run subscription businesses operate, and anything above 5% is worth investigating regardless of industry. The useful comparison is against businesses with a similar customer profile, not a single blended average, since that average mixes premium B2B software with low-price direct-to-consumer products with very different churn dynamics.
How much does retention actually affect profit?
Bain & Company's original research, still the reference point cited across the industry, found that in financial services a 5% increase in customer retention produces more than a 25% increase in profit, with estimates across a wider range of businesses reaching as high as 95%. The mechanism is compounding: retained customers buy more over time, cost less to serve as the relationship matures, and refer others, so a small change in the retention rate multiplies through the P&L rather than adding to it in a straight line.
Which industries have the lowest churn, and why?
Recurly's network shows Business and Professional Services (3.21% to 3.44% median annual churn) and SaaS (3.04% to 3.22%) at the low end, driven by longer contract cycles, higher switching costs and multi-seat dynamics that make cancellation a bigger decision. Ecommerce and subscription boxes run higher, around 4.25% median annual churn, because lower price points and impulse-driven signup patterns make voluntary cancellation an easier decision for the customer.
What is the difference between voluntary and involuntary churn?
Voluntary churn is a subscriber actively cancelling, which signals a value or engagement problem and is fixed with onboarding, engagement programs and win-back offers. Involuntary churn is a subscriber losing access because a payment failed - an expired card, a bank fraud flag, insufficient funds - and the subscriber may not even realize it happened. Recurly's data shows involuntary churn drops sharply as average revenue per customer rises: 0.18% at $250-plus ARPC versus 1.30% at $10 to $25 ARPC, which is why payment recovery matters most for lower-priced subscriptions.
Do pause options and win-back programs actually reduce churn?
Yes, on Recurly's 2026 data. Offering a pause option instead of forcing a cancellation increased pause usage by 337%, and roughly 3 out of 4 of those paused subscribers returned within months. Nearly 1 in 4 new subscriptions on the network now comes from a previously cancelled customer, which makes structured win-back campaigns one of the more cost-effective growth levers available to a subscription business, cheaper than acquiring an entirely new customer.
Sources
Bain & Company - Retaining customers is the real challenge
Bain & Company - Prescription for Cutting Costs (retention-profit research)
Recurly - Churn rate benchmarks: SaaS, media, retail and more industries, 2026
Recurly - 2026 State of Subscriptions report
ChartMogul - The SaaS Retention Report: The AI churn wave
Gainsight - 2025 Customer Success Index findings
Zendesk - 2026 CX Trends report findings
HubSpot - 2026 State of Marketing Report survey findings


