



Table of contents
US retail media ad spending is forecast to reach $72.97 billion in 2026, up 20.3% year over year — but Amazon and Walmart are on pace to absorb roughly 89% of that growth. The budget movement worth tracking this year is not the total, it is the concentration underneath it.
Key Takeaways
- US retail media ad spend is forecast at $72.97 billion in 2026, up 20.3% year over year.
- Amazon captured over 75% of retail media spend in 2025.
- Amazon and Walmart will absorb roughly 89% of 2026's incremental dollars.
- Amazon's retail media revenue is projected past $75 billion by 2028.
- That would put Amazon more than $65 billion ahead of the next-largest network.
- In-store retail media is just 3.3% of remaining spend outside Amazon (2025).
- More than 80% of retail sales still happen in physical stores.
- 86% of grocers call their media and merchandising teams siloed.
- The top 15 US retailers hold under 40% of overall retail sales, versus ~70% online concentration.
- Retailers lose an average 6.4% of gross sales to in-store operational failures, up from 5.5%.
- 73% of advertisers plan to increase RMN spending, 38% specifically in 2026.
- US retail media spend, on a broader commerce-media basis, is tracked toward $107.6 billion by NielsenIQ.
- Incrementality is brands' top retail media measurement pain point.
The topline number, and why it moved
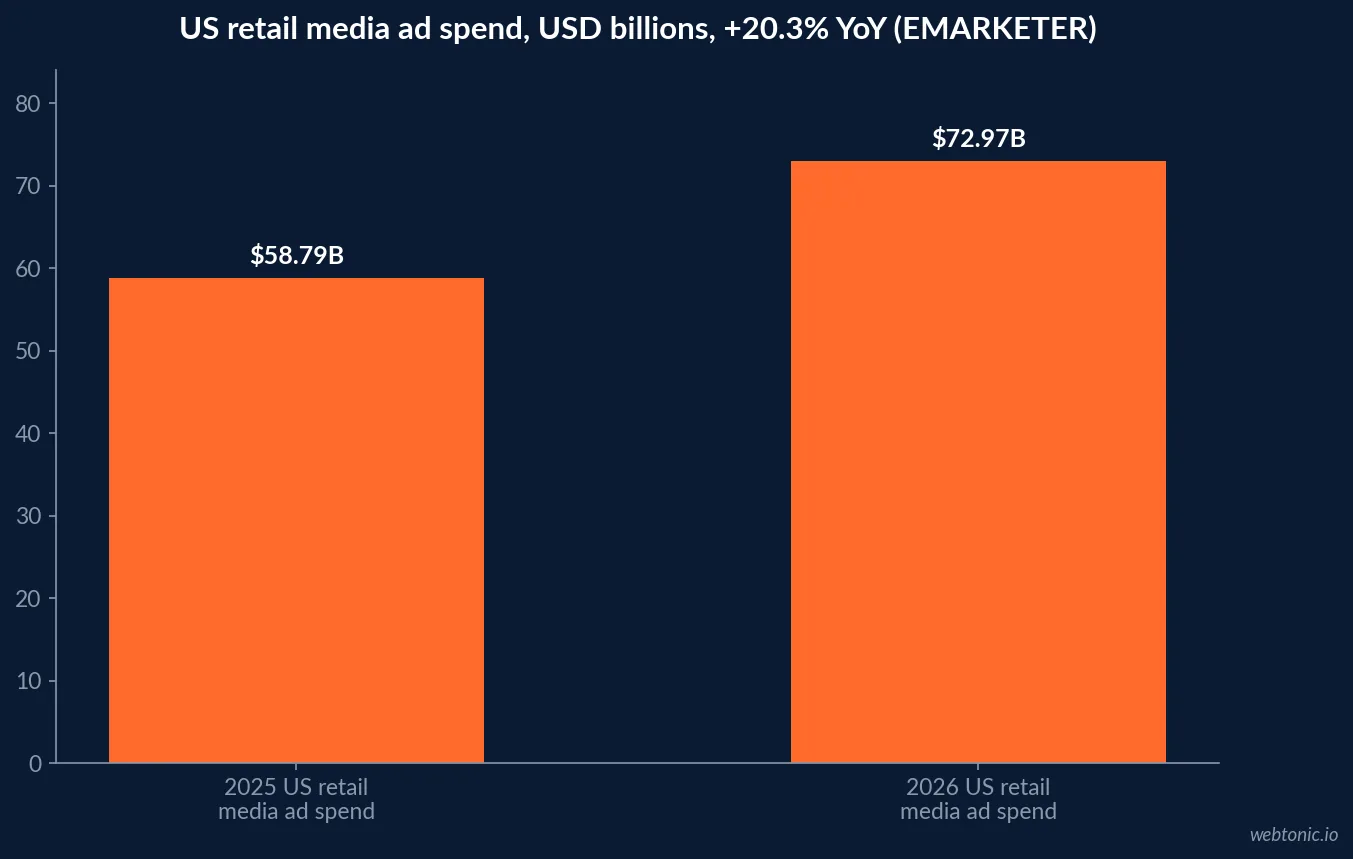
EMARKETER's most current 2026 forecast puts US retail media ad spending at $72.97 billion, growing 20.3% year over year. That revises an earlier EMARKETER H1 2026 forecast, published closer to the start of the year, which had US advertisers spending $69.33 billion in 2026 against $58.79 billion in 2025. Forecast revisions of a few billion dollars mid-year are normal for a channel growing this fast — the trend line matters more than the exact figure in any single report.
Both vintages of the forecast agree on the concentration story: $9.42 billion of the roughly $10.53 billion in incremental 2026 spending was projected to go to Amazon Ads and Walmart Connect alone, which EMARKETER frames as over 89% of the category's new dollars landing on two players.
| Retail media metric | Figure | Source and vintage |
|---|---|---|
| US retail media ad spend, 2026 forecast | $72.97 billion, +20.3% YoY | EMARKETER, Jun 2026 |
| US retail media ad spend, earlier 2026 estimate | $69.33 billion | EMARKETER, Nov 2025 |
| US retail media ad spend, 2025 | $58.79 billion | EMARKETER, Nov 2025 |
| Incremental dollars to Amazon + Walmart, 2026 | ~89% of $10.53B added | EMARKETER, Nov 2025 |
| Amazon's projected retail media revenue, 2028 | >$75 billion | EMARKETER |
Why the money keeps concentrating on two networks
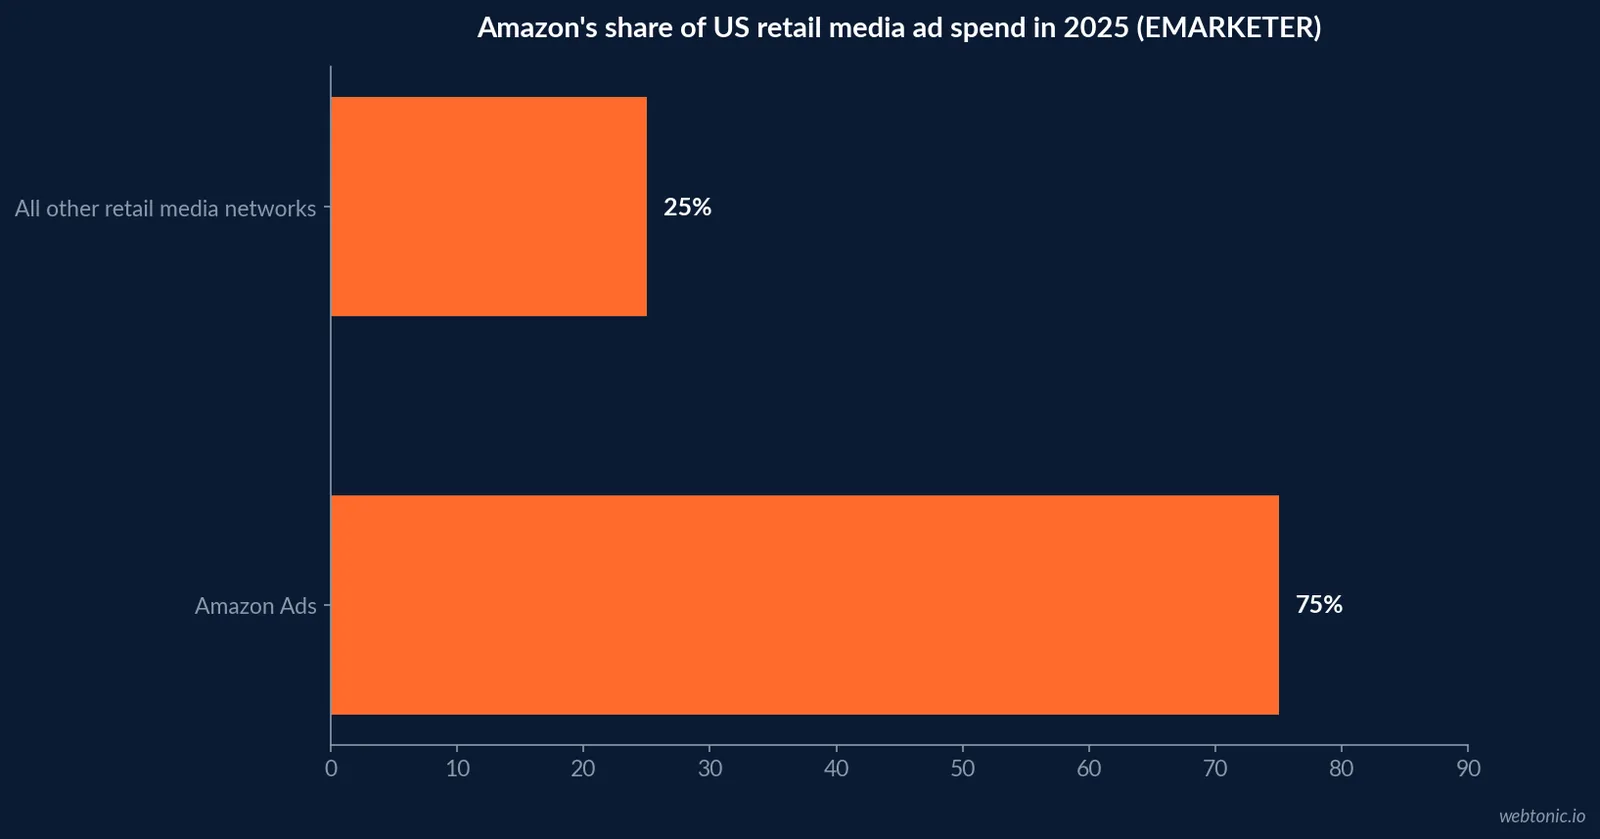
Amazon captured over 75% of retail media ad spend in 2025 on the strength of its e-commerce share, and no equivalent giant exists yet in physical retail. That absence is precisely what leaves an opening for traditional retailers that execute well in-store, but it also means advertiser budgets keep defaulting to the two networks with the largest proven audience and the most mature measurement: Amazon and Walmart. EMARKETER projects Amazon's retail media revenue alone will exceed $75 billion by 2028, more than $65 billion ahead of whichever network is second.
Underneath the top two, EMARKETER describes a "scaled second tier" of retail media networks emerging, while the long tail of smaller networks slips further behind — meaning the real budget decision for most advertisers in 2026 is not whether to spend on retail media, but how much to keep concentrated at the top versus test further down the list.
The underdeveloped segment: in-store retail media
More than 80% of retail sales still happen in a physical store, yet in-store retail media amounted to just 3.3% of remaining retail media spend (excluding Amazon) in 2025. The gap is not advertiser interest — roughly 1 in 4 retail media ad buyers cite difficulty accessing in-store reach as a top challenge, per Koddi data cited by EMARKETER — it is execution cost and organizational structure. Building the technology and hardware to scale digital screens, smart carts and in-store audio across a national store fleet is, in EMARKETER's own framing, "a massive barrier."
Grocery is the category most likely to break the logjam first. Food and beverage sales are 17.5% of all retail sales, and more than 91% of that still happens offline. An October 2024 Grocery Doppio survey found 70% of grocery retailers planned to deploy in-store retail media within 18 months — but 86% of grocers also report their print circulars, digital media networks and in-store media networks remain completely or partially siloed, which is the internal blocker slowing that rollout.
| In-store retail media factor | Figure | What it implies for budget |
|---|---|---|
| Retail sales still happening in physical stores | >80% | The channel's addressable audience is huge |
| In-store share of non-Amazon retail media spend (2025) | 3.3% | Execution, not demand, is the bottleneck |
| Ad buyers citing in-store access as a top challenge | ~25% | Inventory access remains scarce |
| Grocers planning in-store retail media within 18 months | 70% | Grocery is the near-term proving ground |
| Grocers reporting siloed media/merchandising teams | 86% | Internal structure, not tech, is the blocker |
| Retailers' average gross-sales loss to in-store ops failures | 6.4%, up from 5.5% | Media layered on broken shelf data underdelivers |
What the retailers' own earnings say about the growth
Retailer financial disclosures confirm the EMARKETER trend from the inside. Walmart's own Q2 FY27 earnings release reports global advertising revenue up 38% year over year, with Walmart Connect specifically up 43% — growth the company explicitly credits as a driver of improved gross margin. Instacart's Q2 2026 results show advertising and other revenue of $297 million, up 16% year over year and representing 2.9% of gross transaction value — advertising growing faster than the underlying order volume it rides on.
Both disclosures point to the same structural story as the EMARKETER forecast: retail media has become a genuine profit center that retailers now break out and defend to investors, not a side hustle bundled into "other revenue."
| Retailer advertising disclosure (2026) | Figure | Source |
|---|---|---|
| Walmart global advertising revenue growth | +38% YoY | Walmart Q2 FY27 earnings release |
| Walmart Connect revenue growth specifically | +43% YoY | Walmart Q2 FY27 earnings release |
| Instacart advertising and other revenue | $297 million, +16% YoY | Instacart Q2 2026 results |
| Instacart ad revenue as share of GTV | 2.9% | Instacart Q2 2026 results |
The measurement problem sitting under all of it: incrementality
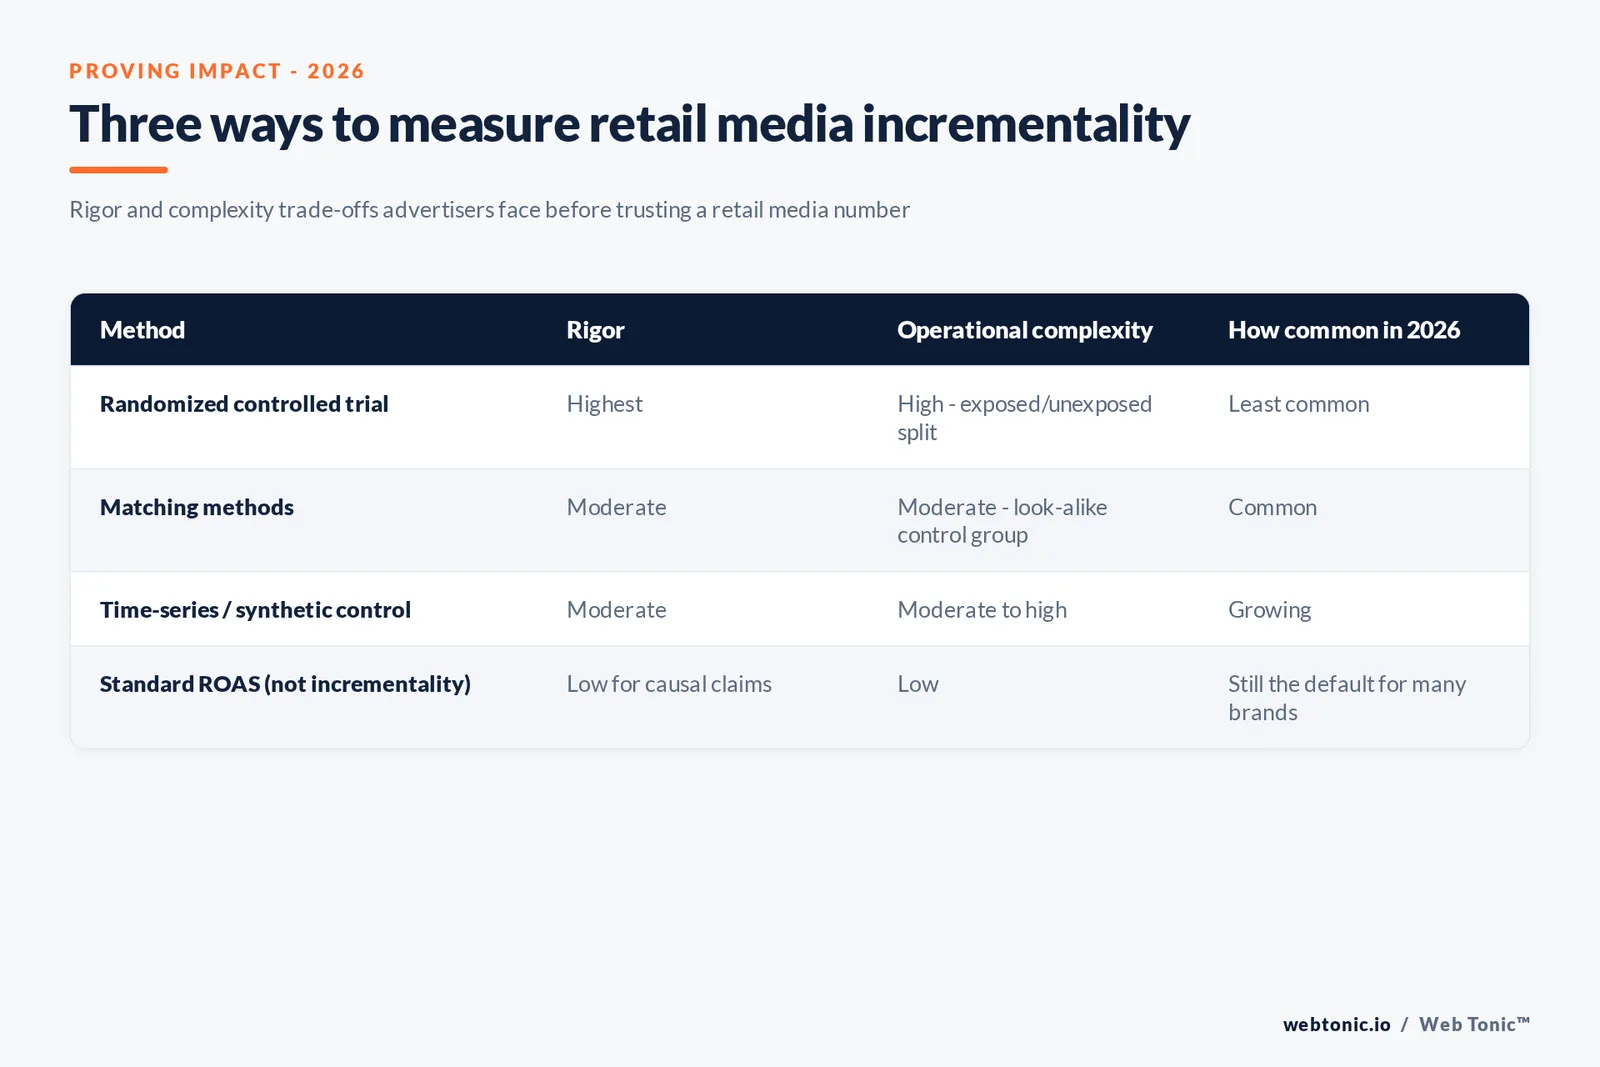
NielsenIQ tracks US retail media spend, on its broader commerce- media basis, heading toward $107.6 billion in 2026 — nearly triple where it stood five years ago — and names incrementality and cross-channel measurement as brands' top retail media measurement pain point. The core mistake NIQ flags: using standard ROAS as a stand-in for incrementality, when ROAS counts sales that happened near an ad exposure without proving the ad caused them.
A separate methodology paper from Ovative, drawing on 42 real-world campaigns, shows that different incrementality methodologies — randomized controlled trials, matching methods, and time-series approaches — can produce materially different iROAS results for the same spend, which is exactly why budget owners cannot yet compare retail media performance across networks on a truly apples-to- apples basis.
| Incrementality method | Rigor | Operational complexity | How common in retail media |
|---|---|---|---|
| Randomized controlled trial | Highest | High - requires exposed/unexposed split | Least common |
| Matching methods | Moderate | Moderate - builds a look-alike control group | Common |
| Time-series / synthetic control | Moderate | Moderate to high | Growing |
| Standard ROAS (not incrementality) | Low for causal claims | Low | Still the default many brands use |
The grocery proving ground, in the retailers' own numbers
Grocery deserves a closer look because it is where in-store media has the clearest path to scale. Walmart's own disclosure shows why: eCommerce grew 23% in the same quarter that total advertising grew 38%, meaning the retailer's media growth is outrunning even its fast-growing digital sales — a signal that advertisers are bidding up scarce inventory faster than the retailer can create it. That scarcity dynamic is exactly what should, in theory, pull budget toward less-crowded in-store formats once the measurement and access barriers described above get resolved.
What a "second-tier" retail media network actually needs to prove
EMARKETER's "scaled second tier" framing implies a real threshold a network has to clear before it is worth a test budget: audience scale a brand cannot reach through Amazon or Walmart alone, a measurement offering beyond vanity impressions, and self-service tooling that does not require a dedicated account team to activate. Networks attached to a single-digit share of category sales rarely clear that bar yet, which is a reasonable filter for deciding which of the dozens of emerging retail media networks deserve a test in 2026 versus a "wait and see."
Criteo's commerce media research reframes the evaluation question further: rather than judging a network purely on last-click sales, it argues for tracking the "ripple" effects of a campaign — organic lift, new-to-brand share, and halo sales across a brand's wider portfolio — because standard ROAS reporting alone misses a meaningful share of what retail media actually drives.
| Retail media network evaluation criterion | Why it matters |
|---|---|
| Audience scale beyond Amazon/Walmart overlap | Determines if the network is incremental reach or duplicate reach |
| Self-service activation without a dedicated rep | Determines whether small and mid-size brands can test cheaply |
| Measurement beyond last-click ROAS | Determines if halo and new-to-brand effects are visible at all |
| Category share the retailer actually holds | A network attached to 2% of category sales caps its own ceiling |
Where to actually put budget this year
The concentration data argues for keeping the majority of retail media spend on Amazon and Walmart, where measurement is most mature and scale is proven, while treating a second-tier network or an in-store pilot as a genuine test rather than a budget line assumed to perform identically. The 86% siloing figure in grocery is a warning specifically for retailers building their own network: media revenue will underperform until merchandising and media operations share the same shelf data.
Advertisers who cannot yet answer whether their retail media spend is incremental should treat that as the higher-priority fix before adding a new network, not after. Our data and analytics practice builds the holdout and matched- market testing retail media budgets need, our growth marketing team can model the reallocation once that measurement exists, and our creative team builds the retail media ad units that convert once the budget lands. Questions on scoping a test? Talk to us.
Frequently Asked Questions
How big is US retail media ad spending in 2026?
EMARKETER's most recent 2026 forecast puts US retail media ad spending at $72.97 billion, up 20.3% year over year. An earlier EMARKETER estimate from late 2025 had put the figure closer to $69.33 billion; forecasts get revised through the year as more retailer and platform data comes in, which is normal for a fast-growing category and one more reason to check the publish date on any retail media figure before using it.
Is retail media budget growth spread evenly across networks?
No. EMARKETER data shows Amazon captured over 75% of retail media ad spend in 2025, and Amazon and Walmart together are on pace to absorb roughly 89% of the incremental dollars spent in 2026. By 2028, Amazon's retail media revenue alone is projected to exceed $75 billion, more than $65 billion ahead of the next-largest network. The long tail of smaller retail media networks is falling further behind even as total category spend keeps climbing.
Why has in-store retail media not scaled with online retail media?
Execution cost, not demand. More than 80% of retail sales still happen in physical stores, yet in-store retail media (digital screens, smart carts, audio, sampling) amounted to just 3.3% of retail media spend outside Amazon in 2025. The barriers are the technology and hardware needed to scale programs across thousands of stores, and internal silos: 86% of grocers report their print, digital and in-store media teams remain completely or partially siloed.
What is incrementality and why does it matter for retail media budgets?
Incrementality measures the sales that would not have happened without a specific dollar of ad spend, as distinct from standard ROAS, which counts sales that happened near an ad exposure regardless of whether the ad caused them. NielsenIQ research names incrementality and cross-channel measurement as brands' top retail media measurement pain point even as budgets climb toward $108 billion, because using ROAS as a stand-in for incrementality is one of the most common and costly mistakes advertisers make in this channel.
Which category is the best test case for retail media growth?
Grocery. Food and beverage sales are 17.5% of all retail sales and more than 91% of that still happens in a physical store, so grocers have the volume to justify in-store investment. An October 2024 Grocery Doppio survey found 70% of grocery retailers planned to deploy in-store retail media within 18 months, though 86% still describe their media and merchandising teams as siloed, which is the operational gap slowing that rollout.
Sources
EMARKETER - FAQ on in-store retail media, June 2026
EMARKETER - Retail Media Ad Spending Forecast H1 2026
EMARKETER - US Retail Media Ad Spending Benchmarks Q3 2026
NielsenIQ - Measure Retail Media Incrementality and Prove Impact
Ovative - Retail Media iROAS Demystified
U.S. Census Bureau - Quarterly Retail E-Commerce Sales Report
Walmart - Q2 FY27 earnings release
Instacart (Maplebear Inc.) - Q2 2026 financial results
Criteo - The Retail Media Ripple Effect


