



Table of contents
The honest answer is: some are, most are not. Retail marketing content is full of numbers that trace back to nothing more than another blog post citing another blog post. This page keeps the statistics that resolve to a named study with a stated sample, and benchmarks the channels that actually move retail revenue against them.
Key Takeaways
- Klaviyo's 2026 benchmarks are drawn from over 183,000 customer accounts.
- Email flows generate 41% of total email revenue from just 5.3% of sends.
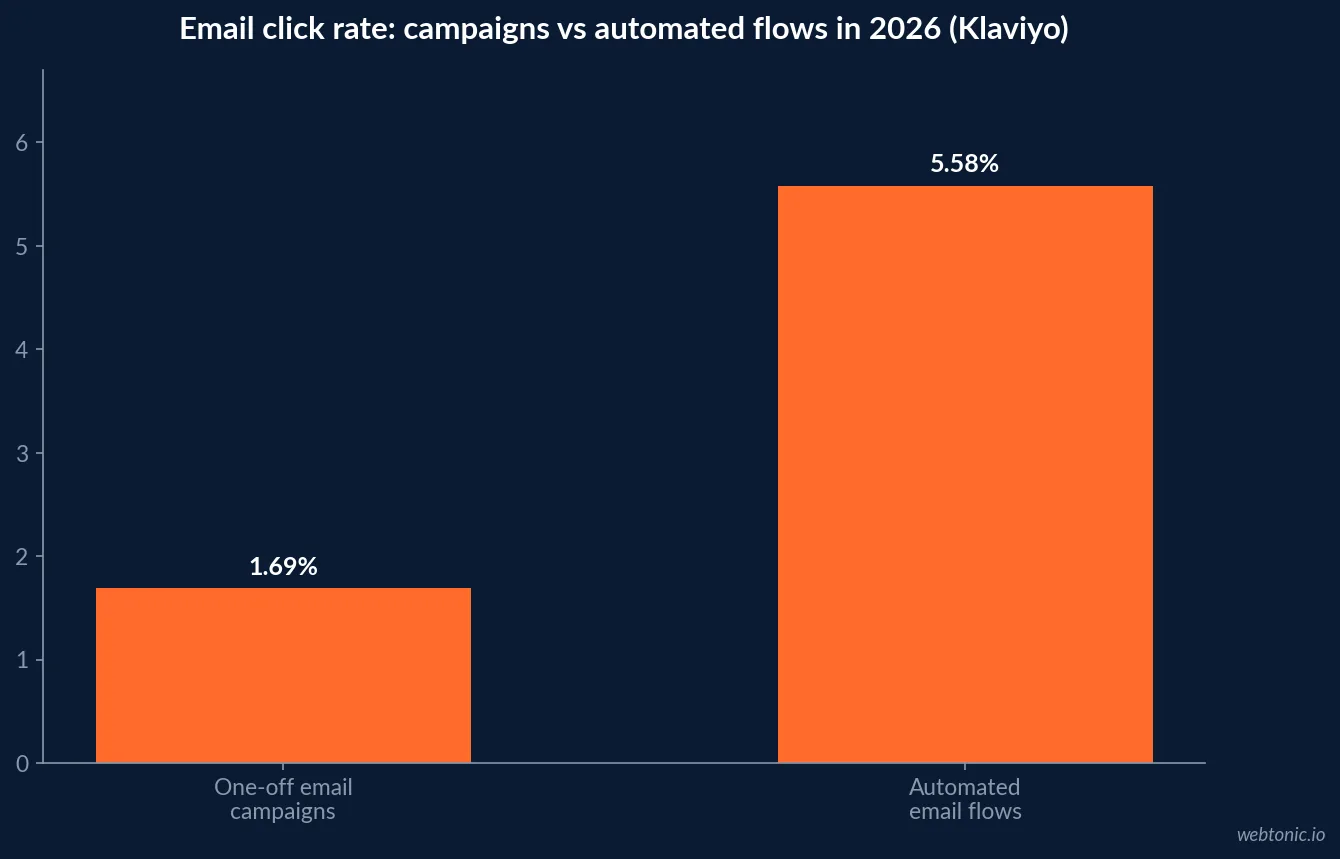
- Flows get 3x the click rate of one-off campaigns, 5.58% vs. 1.69%.
- Flows drive 13x the placed-order rate of campaigns.
- Top 10% of flows hit $7.79 revenue per recipient.
- AI product recommendations lift click rates to 3.75% on average, 8.79% for top performers.
- 62% of CPG brands say loyalty members drive 51% to 75% of annual sales.
- Loyalty program ROI in the 20% to 30% range grew sharply in 2026, from 10% to 20% a year earlier.
- 9 of 10 organizations that measure loyalty ROI report a positive return, averaging 5.3x.
- US retail social commerce sales are projected past $102 billion in 2026, up 18%.
- 58% of US shoppers say they bought something after seeing it on social media.
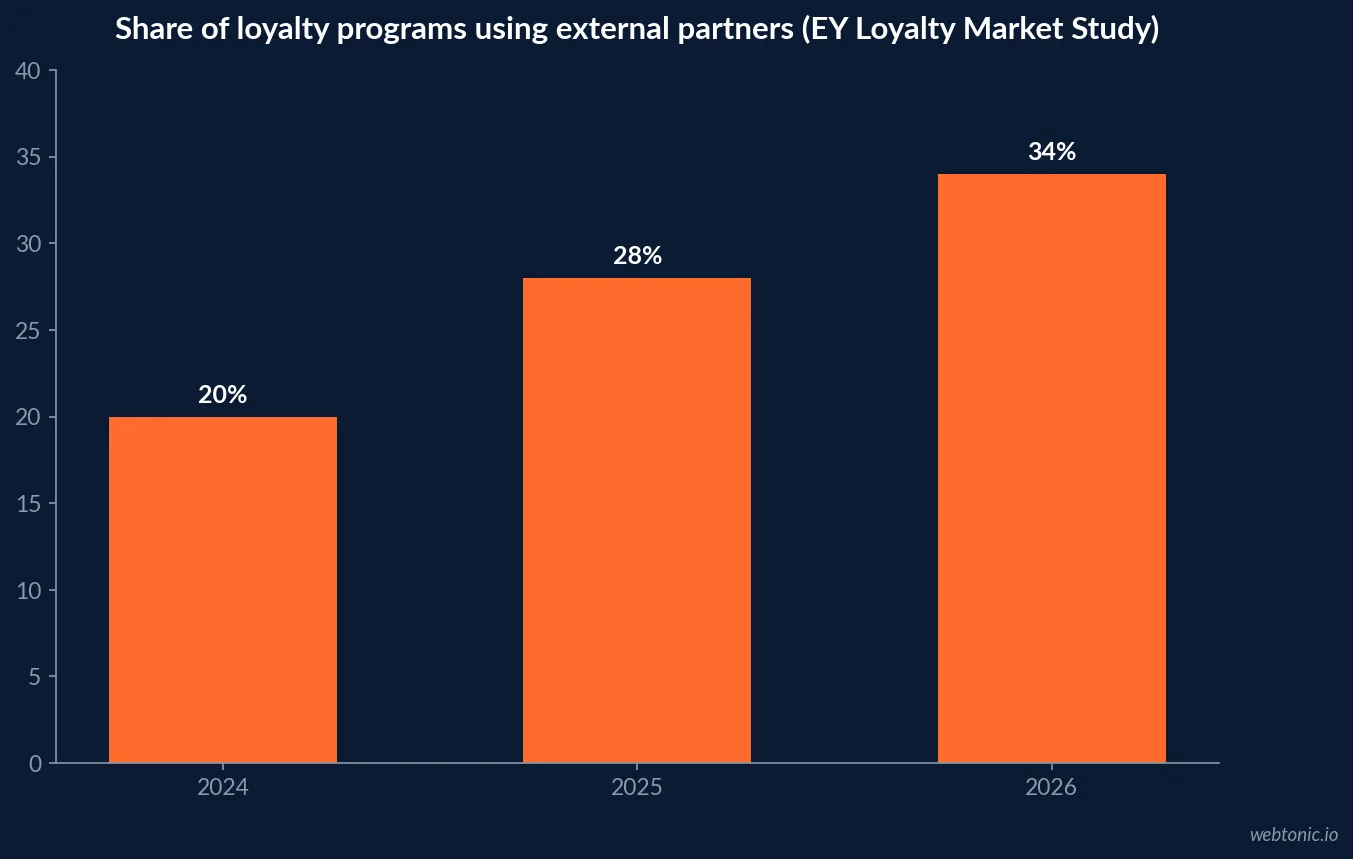
- 34% of loyalty programs now use external partners, up from 20% in 2024.
- Consumer emotional attachment to loyalty programs is softening even as ROI rises.
Why so many retail marketing statistics don't survive a source check
Pull a random "50 retail marketing statistics for 2026" post and try to trace three numbers back to their origin. A large share resolve to another aggregator citing "industry reports" with no link, a stat that has been re-published unchanged since 2019 with the year swapped, or a figure attributed to a company that never published it. None of that makes the underlying claim false, but it makes it unusable — you cannot defend a number in a board meeting that you cannot trace.
The filter this page applies is simple: a statistic only survives if it resolves to a named report with a stated sample or a government release. That standard cuts most "best-practices" roundups down to a handful of citable numbers, which is the point.
| Statistic type | Example | Why it fails or passes the trace test |
|---|---|---|
| Aggregator round-up figure | "Retail email open rate is 39.2%" with no linked source | Fails - no named study, no sample size |
| Platform benchmark | Klaviyo email benchmarks from 183,000+ accounts | Passes - stated sample, described methodology |
| Government release | Census Bureau e-commerce share, 17.1% Q2 2026 | Passes - mandatory survey, published methodology |
| Vendor research report | EY Loyalty Market Study, ~1,400 consumers + 300 firms | Passes - named sample, repeated annually |
| Recycled year-swap stat | Same figure appearing under 2023, 2024, 2025, 2026 headlines | Fails - no evidence the underlying data was refreshed |
The channel that survives the trace test: automated email and SMS
Klaviyo's 2026 email benchmarks, built from over 183,000 customer accounts, show a wide performance gap between automated flows and one-off campaigns. Campaigns still carry 94.7% of send volume, but flows generate nearly 41% of total email revenue from just 5.3% of sends. Average revenue per recipient on flows runs roughly 18 times higher than on campaigns.
The engagement gap is just as wide: flows deliver over 3x the click rate (5.58% vs. 1.69%) and 13x the placed-order rate of campaigns. Nearly 48% of flow-driven revenue comes from new buyers, against just 16% for campaigns, which makes welcome, browse and abandonment flows the highest-leverage first build for a retailer with a thin marketing team.
| Email metric (Klaviyo, 2026) | Campaigns | Flows | Flow advantage |
|---|---|---|---|
| Share of send volume | 94.7% | 5.3% | Flows are a fraction of volume |
| Share of total email revenue | ~59% | ~41% | Outsized return per send |
| Click rate | 1.69% | 5.58% | ~3.3x |
| Placed-order rate | 1x (baseline) | 13x | 13x |
| Share of revenue from new buyers | 16% | 48% | 3x |
| Top 10% revenue per recipient | - | $7.79 | Segmentation-driven |
Loyalty: the ROI numbers are real, the durability warning is too
The 2026 EY Loyalty Market Study, surveying more than 1,400 consumers and about 300 corporate respondents across retail, CPG, food and beverage and hospitality, found loyalty program ROI shifting into the 20% to 30% range for more organizations, up from 10% to 20% the year before, with redemption rates improving in parallel. For consumer packaged goods brands specifically, 62% say loyalty members now drive 51% to 75% of annual sales.
EY's own framing is the caveat worth keeping: performance can look healthy by traditional business measures — enrollment, revenue share, ROI — while consumer emotional attachment softens underneath it, meaning the reported gains may be more fragile than the headline ROI figure suggests.
| Loyalty metric (EY 2026 study) | Figure | Direction vs. prior year |
|---|---|---|
| Organizations reporting positive loyalty ROI | 9 of 10 that measure it | Stable |
| Average reported ROI among positive performers | 5.3x | Up from 5.2x |
| Programs landing in the 20%-30% ROI band | Largest single band in 2026 | Up from 10%-20% band |
| CPG brands: share of sales from loyalty members | 62% report 51%-75% | New industry spotlight metric |
| Loyalty programs using external partners | 34% | Up from 20% in 2024 |
The loyalty perception gap most decks leave out
Antavo's Global Customer Loyalty Report 2026, built from 3,000 corporate survey responses and a 10,000-member consumer panel, names a specific gap worth citing on its own: 82.6% of marketers believe their loyalty program makes customers feel valued, but only 56.2% of customers agree. Marketers are also allocating real budget behind that belief — 51.5% of the marketing budget among loyalty program owners now goes to CRM and loyalty specifically.
The report's AI figures are just as citable: 51.4% of marketers now use AI in loyalty program management, up sharply from 37.1% the year before, though only 9.0% of program owners report facing no challenges when analyzing their own loyalty data — the rest cite fragmentation, weak integration, or a lack of specialized analytics skill. That is the accurate, checkable version of an "AI in retail marketing" statistic, as opposed to a vague claim that AI is "transforming loyalty."
| Loyalty perception and AI metric (Antavo 2026) | Figure |
|---|---|
| Marketers who believe their program makes customers feel valued | 82.6% |
| Customers who actually agree | 56.2% |
| Marketing budget allocated to CRM and loyalty by program owners | 51.5% |
| Marketers using AI in loyalty program management | 51.4%, up from 37.1% |
| Program owners reporting zero data-analysis challenges | 9.0% |
Social commerce: the fastest-growing line, still a minority of revenue
Sprout Social, citing EMARKETER projections, reports US retail social commerce sales are on pace to surpass $102 billion in 2026, an 18% increase year over year, with 58% of US shoppers saying they have bought something after seeing it on social media. TikTok Shop is projected to reach roughly 51% of US social buyers in 2026.
Read that against total US retail sales of $5.6 trillion and social commerce is still a small slice of the pie — but it is the fastest-growing slice, and the discovery behavior behind it (using social platforms to find products before a search engine) is now normal rather than niche.
What HubSpot's own survey adds that a roundup usually skips
HubSpot's 2026 State of Marketing Report, surveying 3,400 marketers, is a primary source worth separating from the secondary citations packed around it on the same page. Its own finding: audience segmentation refinement now narrowly leads conversion rate optimization as marketers' top optimization technique, at 51% versus 50%, and 56% of marketers say improving conversion rates is easier today than it was ten years ago. Lead-to-customer conversion ranks as the second most important KPI across businesses of every size.
The distinction matters for a retail marketer specifically: HubSpot's survey answer is a primary statistic, while several of the e-commerce figures on the same page are HubSpot restating Statista or DataReportal numbers a step removed from the original source. Cite the survey finding directly; trace the restated ones back to Statista or DataReportal before using them.
| HubSpot 2026 State of Marketing (n=3,400 marketers) | Figure |
|---|---|
| Top optimization technique: audience segmentation | 51% |
| Second-ranked technique: conversion rate optimization | 50% |
| Marketers who say CRO is easier than a decade ago | 56% |
| Lead-to-customer conversion as a KPI ranking | 2nd most important, all business sizes |
Timing claims deserve the same scrutiny as channel claims
Retail marketing content is also full of confident claims about when to spend — "start holiday campaigns by October," "Black Friday drives 40% of Q4 revenue" — that rarely name a source either. The one holiday-timing figure that does trace to a named body: NRF's forecast archive put November and December 2025 sales growth at 3.7% to 4.2% over 2024, in a year holiday sales surpassed $1 trillion for the first time. That is a useful planning input; a specific percentage-of-quarter-revenue claim for a single shopping weekend, without a named retailer sample behind it, generally is not.
What breaks when a number skips the methodology section
The retail marketing statistics that fail the trace test share a pattern: no stated sample, no named methodology, and a number that has appeared, unchanged, in listicles going back several years. That pattern is easy to reproduce and hard to catch under deadline pressure, which is exactly why it keeps happening — a marketer under deadline pressure needs a number for a slide by end of day, and a specific-sounding statistic reads as more credible than a vague one, whether or not it survives a source check.
The cost of using an untraceable number is not abstract. A retention or conversion benchmark that overstates what "normal" looks like will make a genuinely underperforming channel look acceptable, delaying the fix. Our data and analytics practice flags exactly that pattern when auditing a client's existing reporting stack.
A short checklist before you cite a retail marketing statistic
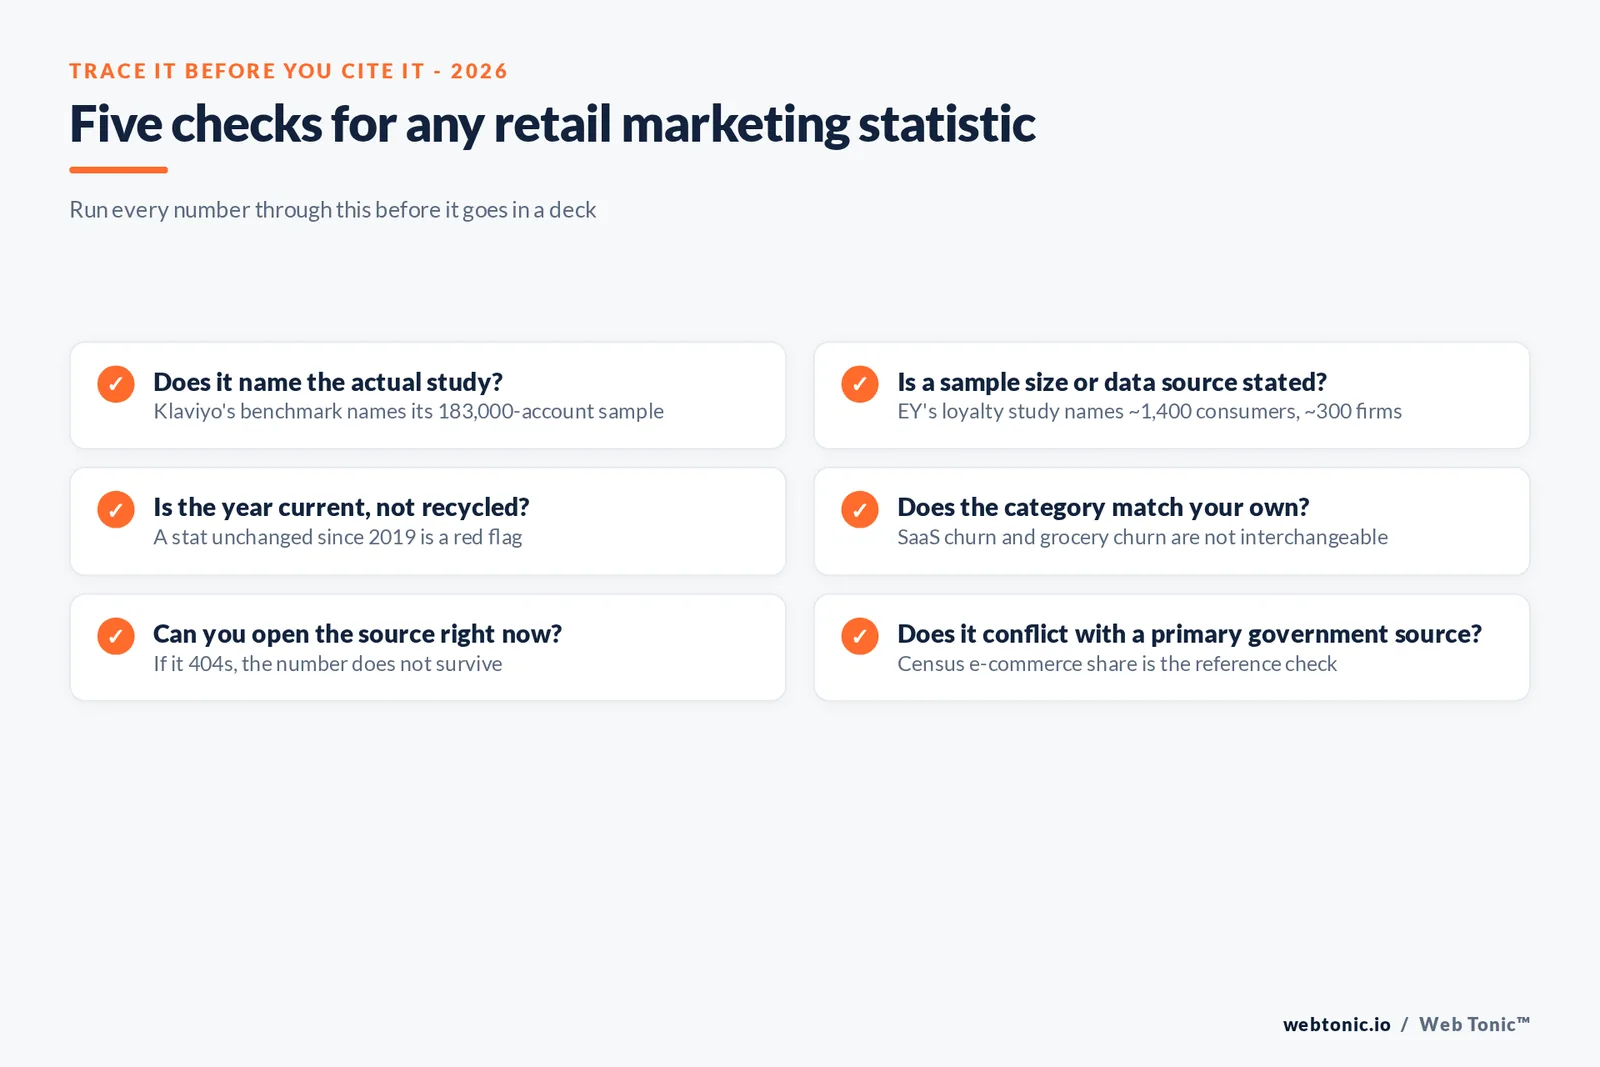
Ask four questions before a number goes in a deck: does it name the study, does it state a sample size or data source, is the year current rather than recycled, and does the category match your own (a SaaS benchmark and a grocery benchmark are not interchangeable). If a number fails any of those, treat it as directional at best.
The numbers on this page — Klaviyo's flow-versus-campaign data, EY's loyalty ROI bands, and EMARKETER's social commerce forecast — all clear that bar. Most of what circulates under "retail marketing statistics" headlines does not, which is the actual answer to whether these statistics are worth using: only the ones you can trace.
Our growth marketing team builds retail lifecycle programs against traceable benchmarks like these rather than recycled averages, and our data practice can audit which of your own reported numbers would survive the same source check. If your team wants that audit scoped, get in touch.
Frequently Asked Questions
Are most retail marketing statistics online accurate?
Many cannot be traced to a named study at all. A common pattern is a blog post that cites 'Statista' or 'industry data' without a link, then gets re-cited by dozens of other posts until the number looks authoritative through repetition rather than evidence. The fix is simple but rarely applied: open the source before using the number, and drop anything that does not resolve to a named report, platform dataset, or government release.
Which retail marketing statistics are actually reliable?
Numbers published by the platform that generated the underlying data hold up best. Klaviyo's email benchmarks come from over 183,000 of its own customer accounts. The EY Loyalty Market Study surveyed 1,400-plus consumers and roughly 300 corporate respondents. The U.S. Census Bureau's e-commerce figures come from a mandatory government survey. Each is traceable to a described methodology, which is the bar a retail marketing statistic should clear before it goes in a deck.
Do automated email and SMS flows actually outperform one-off campaigns?
Yes, by a wide margin on Klaviyo's 2026 data. Flows generate nearly 41% of total email revenue from just 5.3% of sends, deliver over 3 times the click rate of campaigns, and drive 13 times the placed-order rate. Campaigns still carry the majority of send volume and matter for announcements, but the revenue-per-send economics clearly favor automation.
Is retail loyalty program investment paying off in 2026?
EY's 2026 Loyalty Market Study found more programs landing in the 20% to 30% annual ROI range, up from 10% to 20% the year before, and reward redemption rates improving alongside it. The caveat: the same study found consumer emotional attachment to loyalty programs is softening even as the operational metrics improve, which means the ROI numbers may be more fragile than they look.
Should a retailer trust an industry-average conversion rate benchmark?
Only as a directional check, not a target. Benchmark compilations blend categories with very different purchase frequency and price points, so a single average conversion rate or churn number can undersell a high-consideration category and oversell a low-consideration one. Match the benchmark's stated methodology and sample to your own category before adopting it.
Sources
Klaviyo - 2026 email marketing benchmarks by industry
Klaviyo - 2026 omnichannel marketing benchmark report
EY - 2026 Loyalty Market Study
Antavo - Global Customer Loyalty Report 2026
Sprout Social - 2026 social media ecommerce trends and statistics
U.S. Census Bureau - Quarterly Retail E-Commerce Sales Report
HubSpot - 2026 State of Marketing Report survey findings
Digital Commerce 360 - 2026 Omnichannel Trend Report
National Retail Federation - 2026 sales and holiday forecast archive


