



Table of contents
U.S. retail sales are on pace to grow 4.4% in 2026 to $5.6 trillion, and e-commerce now accounts for 17.1% of every dollar spent. Those two facts, from the National Retail Federation and the U.S. Census Bureau, frame the operating reality this page benchmarks against: a growing pie with a channel mix that keeps shifting under retailers' feet.
Key Takeaways
- Total 2026 U.S. retail sales are forecast to reach $5.6 trillion.
- That is 4.4% growth over 2025, above the 3.6% ten-year average.
- Retail contributes $5.3 trillion to U.S. GDP.
- Retail supports more than one in four U.S. jobs, 55 million workers.
- E-commerce reached 17.1% of total retail sales in Q2 2026.
- Quarterly e-commerce sales hit $340.2 billion against $1,986.5 billion total.
- E-commerce grew 12.2% year over year, nearly double total retail's 6.7%.
- 73% of shoppers use three or more channels in a single purchase journey.
- Only 11% of retailers call their omnichannel strategy truly integrated.
- Omnichannel customers spend 4% more in-store and 10% more online than single-channel shoppers.
- Endless-aisle access lifts average ticket by 15% to 20%.
- Mobile drives 78.4% of retail site traffic.
- About 70% of retail orders now happen on smartphones.
- Social commerce sales are projected to top $102 billion in 2026, up 18%.
- Grocery and food make up 17.5% of all retail sales, still 91%+ transacted offline.
The size and pace of the industry in 2026
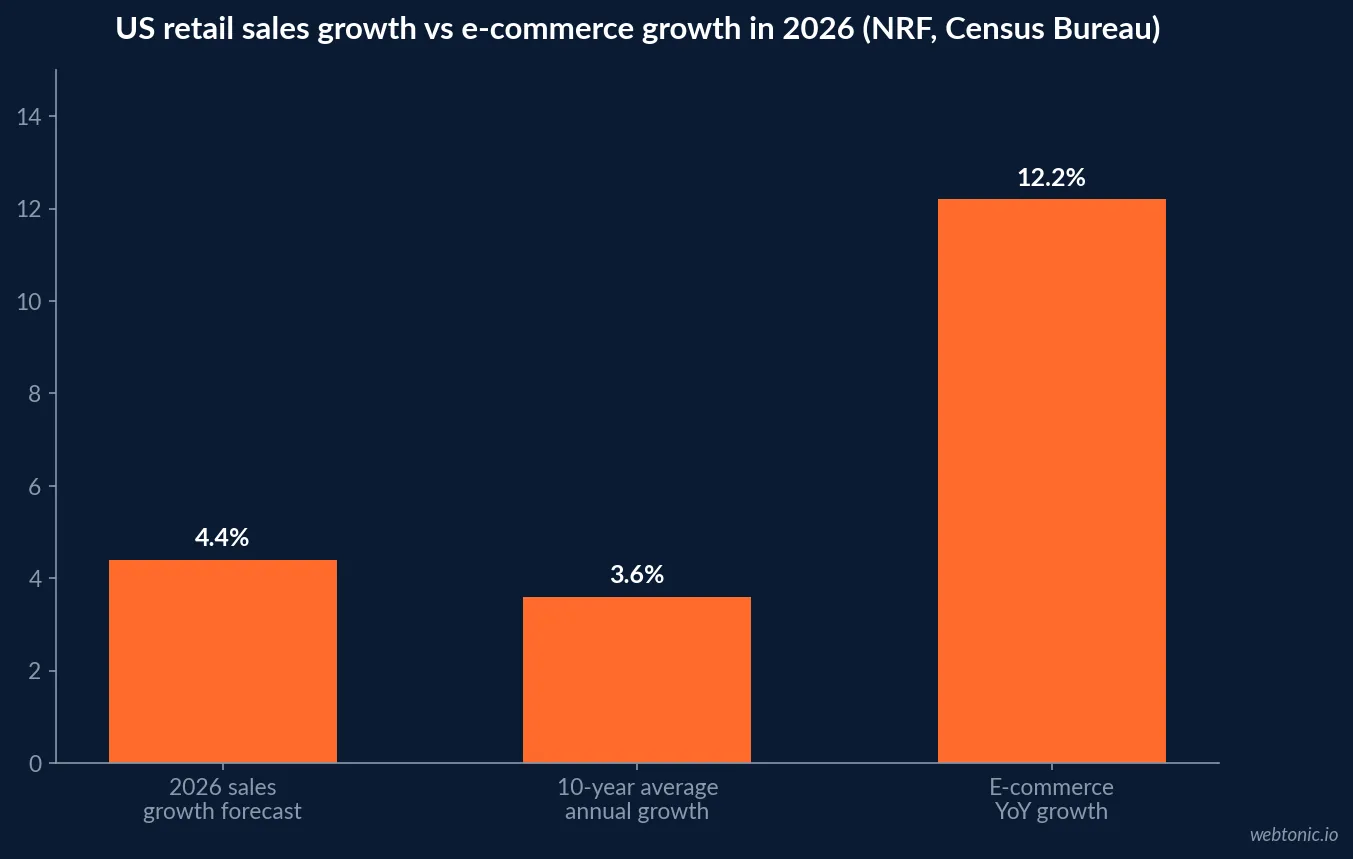
The National Retail Federation, working with Oxford Economics, forecasts total U.S. retail sales will grow 4.4% over 2025 to $5.6 trillion in 2026 — above the 3.6% average annual growth of the last decade, excluding the pandemic period. NRF also states retail contributes $5.3 trillion to U.S. GDP and supports more than one in four U.S. jobs, or roughly 55 million working Americans.
Growth is not evenly spread across income tiers. NRF's chief economist notes the spending outlook is bifurcated, with higher-income households driving most of the increase, which matters for how a retailer should read a single national growth number against its own customer base.
| 2026 industry metric | Figure | Comparison point | Source |
|---|---|---|---|
| Total U.S. retail sales forecast | $5.6 trillion | +4.4% over 2025 | NRF / Oxford Economics |
| Ten-year average annual growth | 3.6% | Excludes 2020-2022 pandemic years | NRF |
| Retail's GDP contribution | $5.3 trillion | Retail is the largest private-sector employer | NRF |
| Retail jobs supported | 55 million | More than 1 in 4 U.S. jobs | NRF |
| Q2 2026 total retail sales | $1,986.5 billion | +2.9% quarter over quarter | U.S. Census Bureau |
How much of retail is now digital
The U.S. Census Bureau reported that adjusted e-commerce sales for the second quarter of 2026 were $340.2 billion, up 3.8% from the first quarter, against $1,986.5 billion in total retail sales, up 2.9% quarter over quarter. E-commerce sales grew 12.2% year over year while total retail sales grew 6.7% over the same period, and e-commerce accounted for 17.1% of total sales in the quarter.
The pattern holds across the first half of 2026: the first-quarter release put e-commerce at 16.9% of total sales, meaning the online share moved up roughly two-tenths of a point in a single quarter. That is a small number to read in isolation, but it compounds every quarter it repeats.
| Quarter (2026) | E-commerce sales | Total retail sales | E-commerce share |
|---|---|---|---|
| Q1 2026 | $326.7 billion | $1,929.0 billion | 16.9% |
| Q2 2026 | $340.2 billion | $1,986.5 billion | 17.1% |
| Q2 2026 YoY growth | +12.2% | +6.7% | Gap: +5.5 pts |
| Q1 2026 YoY growth | +9.8% | +3.9% | Gap: +5.9 pts |
What "omnichannel" means and why the label is overused
Multichannel retail sells across several channels with separate inventory, pricing and customer data per channel. Omnichannel retail shares a single data source for inventory, customer identity and orders across every channel, so a shopper can start a purchase on mobile, continue it in-store, and finish it on a laptop without losing context. The difference is systems architecture, not marketing copy, which is why so many retailers that describe themselves as omnichannel are still running channel-siloed operations underneath.
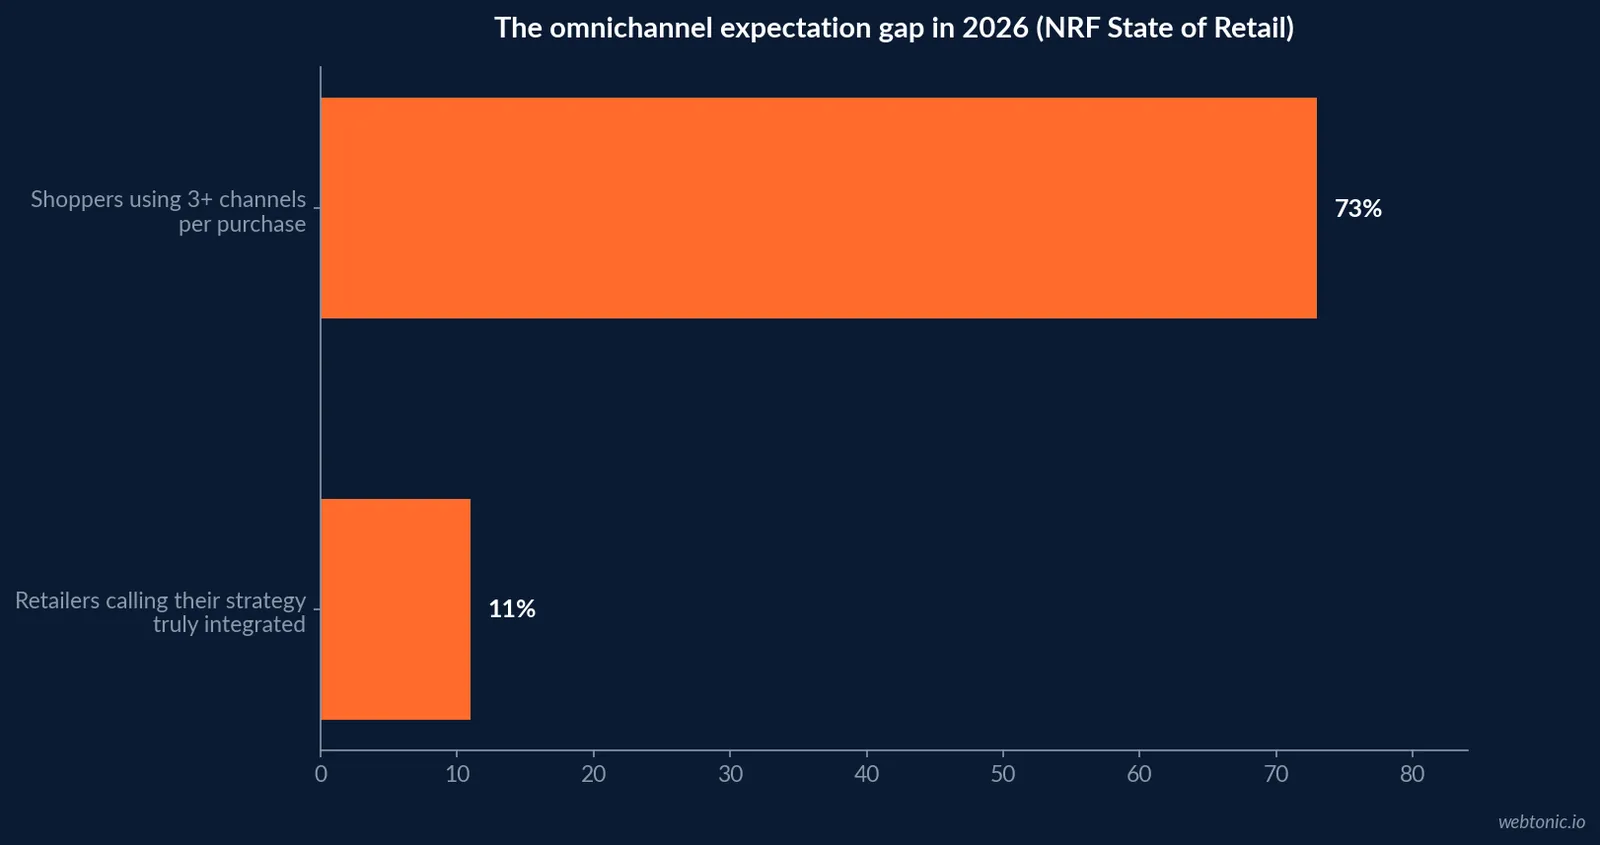
Consumer behavior has already moved past the label debate: 73% of consumers now use three or more channels during a single purchase journey, yet only 11% of retailers consider their own omnichannel strategy to be truly integrated. That 62-point gap between shopper behavior and retailer readiness is the sector's most cited operational risk going into 2026.
What integration is worth when retailers actually build it
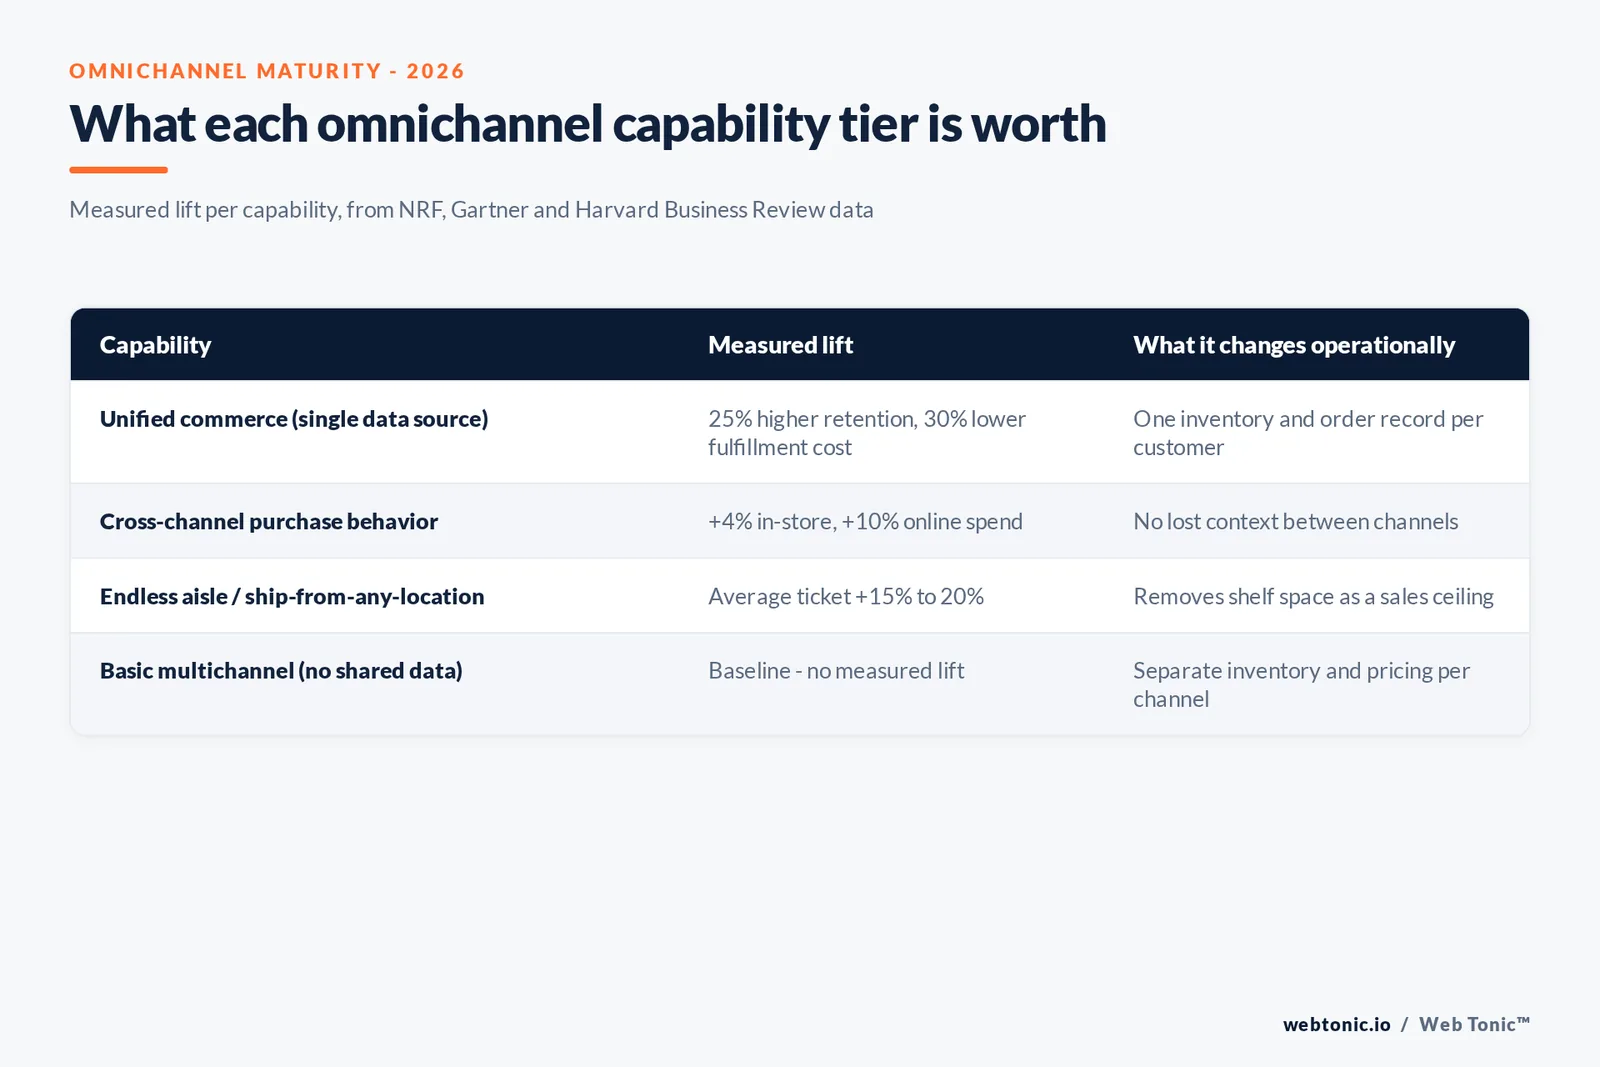
The payoff for closing that gap is measurable. Omnichannel customers spend 4% more in-store and 10% more online than single-channel customers, and retailers running a genuinely unified commerce platform — one system managing inventory, orders and customer data across every channel — report 25% higher customer retention and a 30% reduction in fulfillment operational costs. Endless-aisle capability, where an associate can order an out-of-stock item from the full catalog on the spot, lifts average ticket by 15% to 20% by removing the physical shelf as the limit on what a customer can buy.
Each of those numbers describes the same underlying mechanism: a shopper who is never told "we don't have that here" converts and returns at a measurably higher rate than one who is.
| Omnichannel capability | Measured lift | What it changes operationally |
|---|---|---|
| Unified commerce (single data source) | 25% higher retention, 30% lower fulfillment cost | One inventory and order record per customer |
| Cross-channel purchase behavior | +4% in-store, +10% online spend | No lost context between channels |
| Endless aisle / ship-from-any-location | Average ticket +15% to 20% | Removes shelf space as a sales ceiling |
| Click-and-collect adoption | Tracked KPI, not yet standardized | Requires accurate real-time store inventory |
Where the traffic and the orders actually come from
Device behavior has settled into a clear pattern: mobile drives the large majority of retail site traffic, and roughly 70% of retail orders now happen on a smartphone, according to Statista-compiled retail traffic data. Direct and organic search remain the largest traffic sources at the category level, with paid search and social contributing smaller, more volatile shares that swing with ad spend and platform algorithm changes.
Social commerce is the fastest-growing slice of that mix. Sprout Social cites EMARKETER projections that U.S. retail social commerce sales will surpass $102 billion in 2026, an 18% increase from the prior year, with about 58% of U.S. shoppers reporting they bought something after seeing it on social media.
| Channel signal (2026) | Figure | Source |
|---|---|---|
| Retail orders placed on smartphones | ~70% | Statista, via Sprout Social |
| Mobile share of retail site traffic | 78.4% | Retail marketing benchmark compilation |
| US retail social commerce sales | $102+ billion, +18% YoY | EMARKETER, via Sprout Social |
| Shoppers who bought after seeing it on social | 58% | Hostinger data, via Sprout Social |
What "worth reading" looks like versus a recycled statistic
Retail industry data ages fast: a channel-mix figure from 2023 is close to useless against a market where e-commerce share has moved a full percentage point in two quarters. Every figure on this page carries its quarter or year and its issuing body — NRF, the Census Bureau, Coresight, EMARKETER — specifically so it can be checked against the next release rather than repeated past its shelf life.
The category still anchored offline: grocery and food
Not every category is moving online at the same rate. Grocery and food and beverage account for 17.5% of all retail sales, and more than 91% of food and beverage sales still happen in a physical store, per EMARKETER data. That single category is large enough to keep the industry-wide e-commerce share well under a third of total sales even as apparel, electronics and general merchandise skew far more digital.
The practical read for a retail marketer: an industry-average e-commerce share is only useful as a starting point. The category mix of your own catalog will push your realistic digital ceiling well above or well below 17%.
What the holiday period tells us about the growth trend
NRF's forecast archive shows holiday sales surpassed $1 trillion for the first time in 2025, with November and December sales growing 3.7% to 4.2% over 2024. That holiday growth band sits close to the 4.4% full-year 2026 forecast, which suggests the industry is not expecting a dramatically different consumer in the fourth quarter than it saw across the rest of the year — a useful sanity check against any retailer's own Q4 plan that assumes an outsized seasonal swing.
The physical footprint is shrinking even as sales grow
Store count and sales growth are moving in different directions. Coresight Research's midyear 2026 review tracks US retail on course for roughly 7,900 store closures against about 5,500 store openings for the full year — a net reduction in physical locations even as NRF's topline sales forecast points up. The pattern is a footprint reset, not a retreat: retailers are closing underperforming locations, often larger-format stores, while total sales keep climbing on fewer, more productive locations plus a growing digital channel.
That combination — fewer stores, more sales, higher e-commerce share — is exactly the condition that makes omnichannel data integration non-optional. A shrinking store fleet has to work harder per location, and it can only do that if the inventory and customer data behind it is unified across channels.
| Physical footprint signal, 2026 | Figure | Source |
|---|---|---|
| Projected US store closures | ~7,900 | Coresight Research, midyear 2026 update |
| Projected US store openings | ~5,500 | Coresight Research, midyear 2026 update |
| Net change in store count | Negative (~2,400 fewer) | Coresight Research |
| Full-year retail sales growth forecast | +4.4% | NRF |
| Holiday 2025 sales growth vs. 2024 | 3.7% to 4.2% | NRF |
What this means for where budget and systems investment goes
Read alongside a shrinking store count, the 62-point omnichannel integration gap becomes more urgent, not less: every remaining store has to carry a larger share of both digital fulfillment and brand experience. Retailers weighing where to spend a systems budget in 2026 should treat inventory and customer-data unification as the prerequisite for the endless-aisle and click-and-collect gains described above, not as a parallel initiative competing for the same budget line. For a broader look at how paid channels should adjust to that shift, see our breakdown of what a search budget actually costs once traffic mix moves further toward mobile and social discovery.
Three numbers should anchor a 2026 retail plan: a 4.4% sales-growth tailwind that most categories will share to some degree, a 17.1% and rising e-commerce share that keeps shifting margin structure toward digital fulfillment, and a 62-point gap between shopper channel-hopping and retailer integration that represents the single largest addressable inefficiency in the sector. Retailers that close the third number capture a disproportionate share of the first two.
If your own reporting can't yet tell you whether a customer who browsed on mobile and bought in-store was correctly attributed, that is the omnichannel gap showing up in your own data, not just in NRF's survey. Our data and analytics practice builds the identity and inventory layer that closes it, and our growth marketing team can rebuild channel budgets once that data is trustworthy.
Frequently Asked Questions
How fast is the retail industry growing in 2026?
The National Retail Federation forecasts total U.S. retail sales will grow 4.4% over 2025 to $5.6 trillion, above the 3.6% average annual growth of the last decade excluding the pandemic years. Retail also contributes $5.3 trillion to U.S. GDP and supports more than one in four American jobs, so a swing of even one point in that forecast moves a large share of the economy.
What share of retail sales now happens online?
The U.S. Census Bureau put e-commerce at 17.1% of total retail sales in the second quarter of 2026, with the quarterly e-commerce estimate at $340.2 billion against $1,986.5 billion in total retail sales. E-commerce grew 12.2% year over year, roughly double the 6.7% growth rate of total retail, so the online share keeps climbing even as the base gets larger.
What does omnichannel actually mean versus multichannel?
Multichannel means a retailer sells on several channels with separate inventory and data per channel. Omnichannel means those channels share one data source for inventory, customer identity and orders, so a shopper can start on mobile, continue in-store, and finish on a laptop without losing context. The distinction matters because most of the reported gap between shopper expectation and retailer delivery is really a data-integration gap, not a channel-count gap.
Why do so few retailers call their omnichannel strategy integrated?
Because integration requires rebuilding inventory, order management and customer data systems that were often built channel by channel over a decade. Retailers report using three or more channels per purchase journey is now normal shopper behavior, yet a small minority describe their own systems as truly unified, which is why click-and-collect stockouts and inconsistent pricing across channels remain common complaints.
Is the shift to e-commerce slowing down?
No. Census data shows e-commerce dollar growth outpacing total retail growth in every quarter of 2026 reported so far, and the share of total sales transacted online has moved up each quarter. The growth rate has moderated from the pandemic-era spike, but the direction has not reversed, and grocery and other historically offline categories are now the fastest-growing online segments.
Sources
National Retail Federation - 2026 retail sales forecast press release
U.S. Census Bureau - Quarterly Retail E-Commerce Sales Report
Technova Partners - Omnichannel retail strategy guide, citing NRF and Gartner data
Sprout Social - 2026 social media ecommerce trends and statistics
Klaviyo - 2026 omnichannel marketing benchmark report
EMARKETER - FAQ on in-store retail media, grocery and offline sales share
Digital Commerce 360 - 2026 Omnichannel Trend Report


