Table of contents

67% of shoppers research a product online before buying it in a physical store, and only 32% of purchases in 2026 involved zero digital research at all - down from 39% just two years earlier. Neither number fits inside a channel-attributed marketing budget cleanly, which is exactly the measurement problem a research-online-purchase-offline line item exists to solve.
Key Takeaways
- 67% of shoppers webroom - research online, then buy in a physical store (Salsify 2026).
- 53% of shoppers showroom - browse in a store, then buy online (Salsify 2026).
- 69% purchased a new product in a physical store in the past year, up 11 points from early 2025.
- 68% purchased through an online marketplace, narrowly behind physical retail.
- 43% have used a smartphone to research in-store; at least 30% have bought via smartphone in-store.
- 63.1% say better prices in-store would increase their store visits, per RetailNext.
- E-commerce is ~17.1% of total US retail sales by dollar value, per the Census Bureau.
- Consumers average 55 digital shopping days per month in 2026, up from 51 in 2024.
- That is a 9% increase in digital shopping activity in two years.
- 39% now research on mobile, up 8 percentage points versus 2022.
- Mobile accounts for 53% of all purchases across physical and digital channels.
- The heaviest mobile researchers buy 3x more across every channel.
- Only 32% of purchases involved zero digital research in 2026, down from 39%.
- That is the first sharp drop since this index launched in 2022.
- Online orders picked up in-store jumped 18% since 2024.
- Remote purchases with delivery rose 4.5% in the same window.
Webrooming vs. showrooming, at a glance, 2026
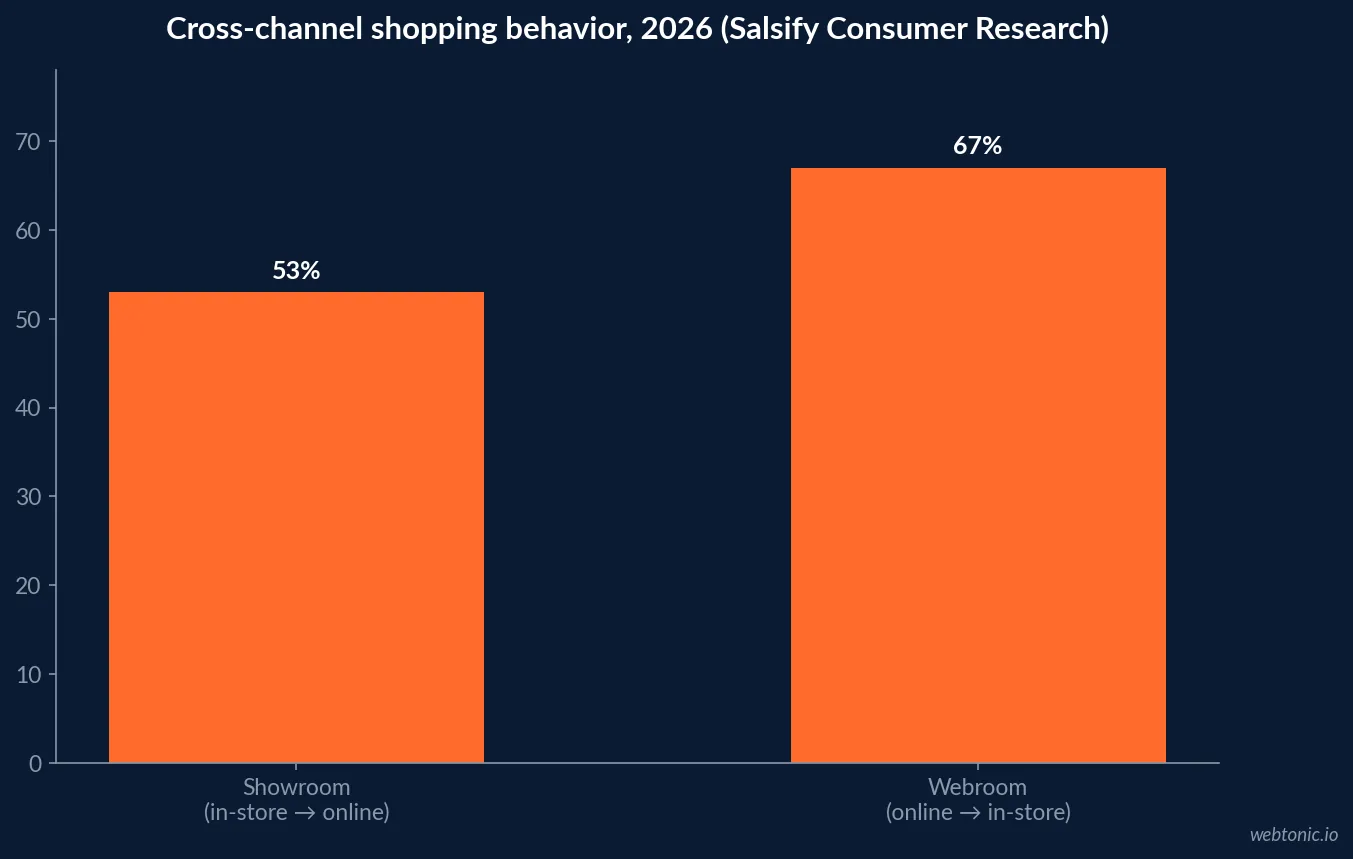
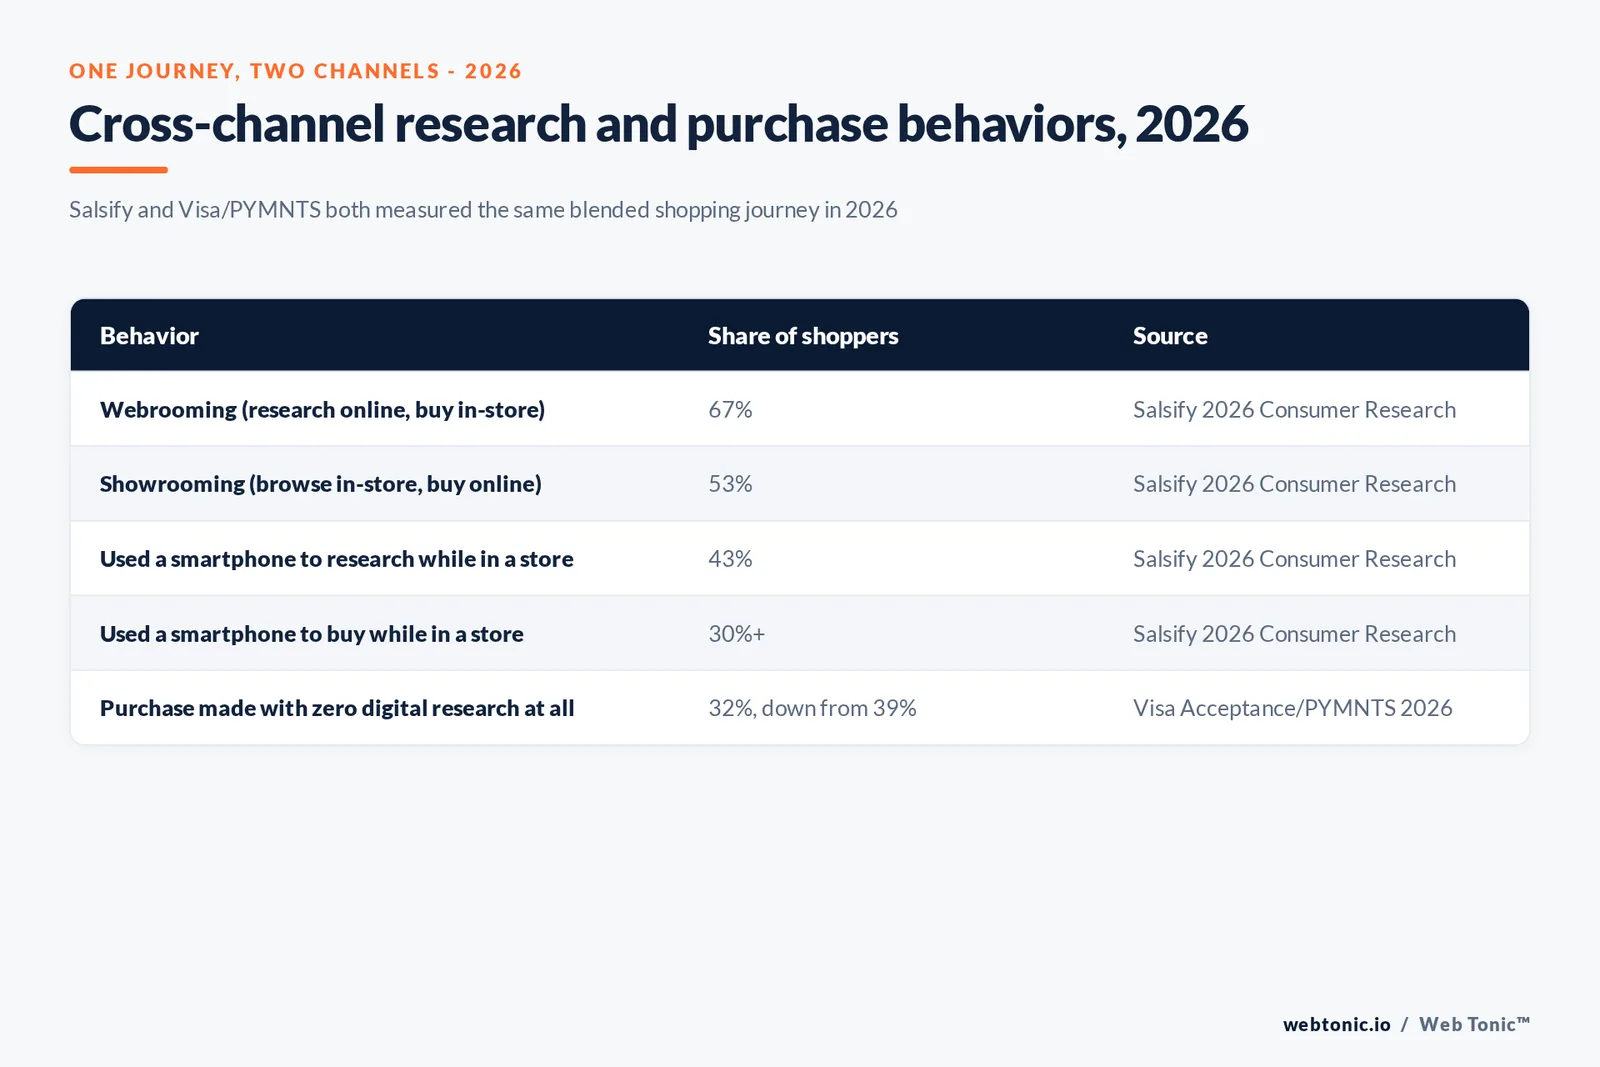
Salsify's 2026 Consumer Research, a survey of nearly 3,000 shoppers across the US, UK and Canada, found more than two-thirds of shoppers - 67% - webroom: they research a product online, then complete the purchase in a physical store. The reverse pattern, showrooming, was reported by 53% of the same sample - browsing a product in a store, then buying it online, often for a better price or faster delivery. Most shoppers report doing both, depending on the product category, which is the core reason a channel-only budget split misreads how the decision actually happens.
Store economics still explain a good share of the showrooming side specifically. RetailNext's 2026 Shopper Sentiment Report, based on 1,053 nationally representative US shoppers surveyed in February 2026, found 63.1% say better prices than online would most increase their in-store visits - ahead of faster delivery, richer loyalty perks, or a nicer store experience. Seeing an item in stock and available immediately mattered to 27.4% of respondents, and in-store-only deals mattered to 27.0% - the store's advantage is increasingly about price and immediacy, not atmosphere.
| Cross-channel behavior, 2026 | Share of shoppers | Source |
|---|---|---|
| Webroom (research online → buy in-store) | 67% | Salsify 2026 Consumer Research |
| Showroom (browse in-store → buy online) | 53% | Salsify 2026 Consumer Research |
| Cite better in-store prices as a visit driver | 63.1% | RetailNext 2026 Shopper Sentiment Report |
| Purchased a new product in a physical store | 69%, up 11pts YoY | Salsify 2026 Consumer Research |
| Purchased through an online marketplace | 68% | Salsify 2026 Consumer Research |
Where the smartphone fits inside the physical store
The store visit itself is no longer a single-channel moment. Salsify found 43% of shoppers have used a smartphone to research a product while physically standing in a store, and at least 30% have gone further and completed a purchase on their phone while still inside that store - buying from a different retailer entirely, in some cases, without leaving the aisle. A retailer's in-store experience and its digital experience are now the same competitive surface, whether or not the store's own budget treats them that way.
The Visa Acceptance Solutions and PYMNTS 2026 Global Digital Shopping Index, drawn from a survey of 5,841 consumers and 1,185 merchants across the US, Brazil and the UAE, adds the mobile-specific view: mobile devices now account for 53% of all purchases across physical and digital channels combined, and the heaviest mobile researchers - the shoppers who browse most - buy 3x more across every channel than lighter researchers.
| Mobile-in-store behavior, 2026 | Figure | Source |
|---|---|---|
| Used a smartphone to research while in a physical store | 43% | Salsify 2026 Consumer Research |
| Used a smartphone to buy while in a physical store | 30%+ | Salsify 2026 Consumer Research |
| Mobile share of all purchases, physical + digital | 53% | Visa Acceptance / PYMNTS 2026 |
| Purchase multiple for heaviest mobile researchers | 3x more, every channel | Visa Acceptance / PYMNTS 2026 |
Purchases with no digital research at all are disappearing
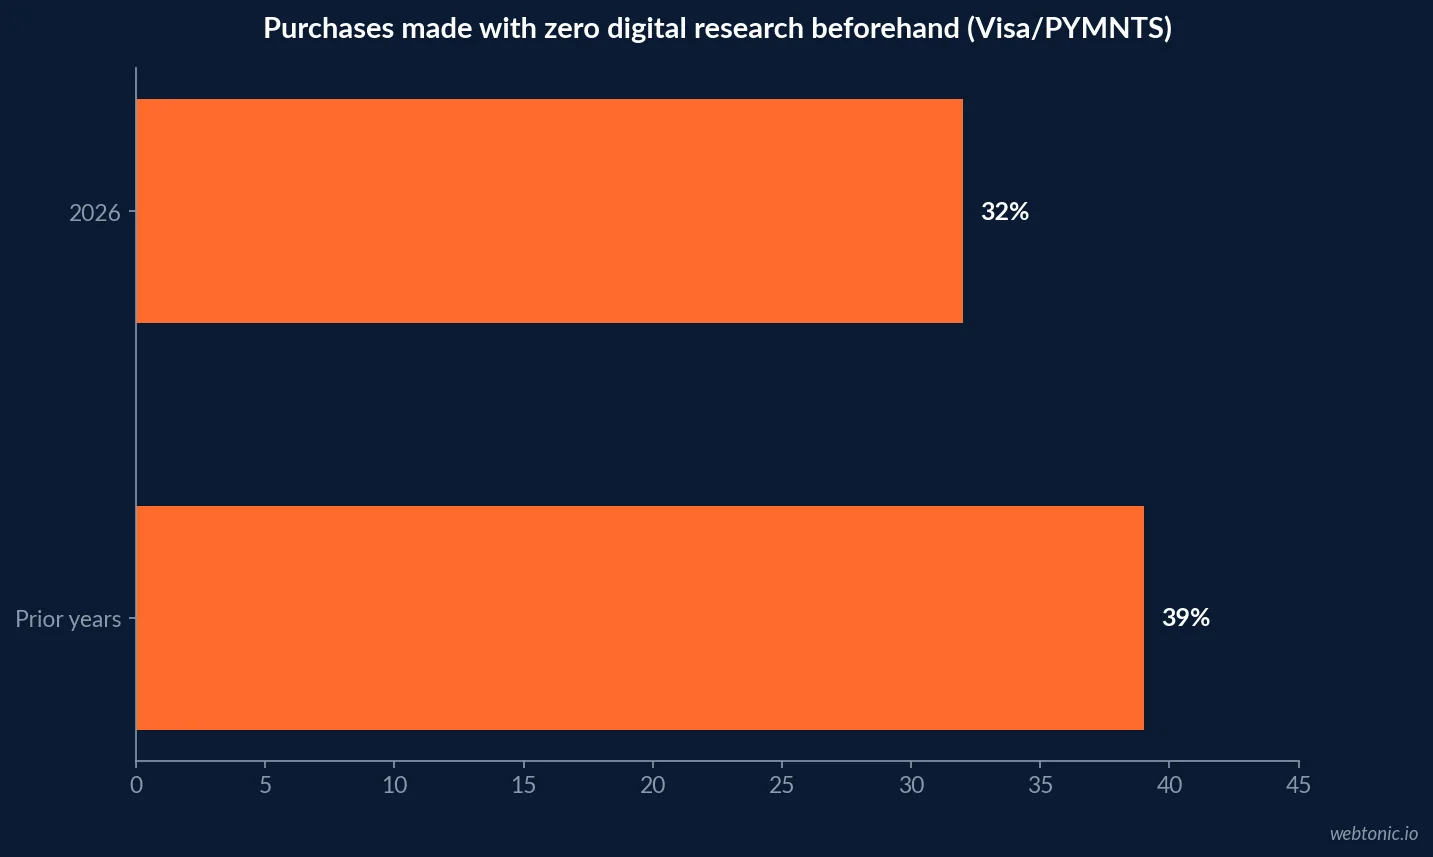
The clearest single trendline in the 2026 data is what is going away, not what is growing. The Visa/PYMNTS index found only 32% of consumers made their most recent purchase entirely offline, with zero digital research or assistance of any kind - down from 39% in each of the previous survey years since the index launched in 2022. That is the first sharp drop the series has recorded, and it did not come from one channel replacing another; it came from hybrid behavior growing fastest. Online orders picked up in-store jumped 18% since 2024, remote purchases with delivery rose 4.5%, and consumers now average 55 digital shopping days per month, up from 51 in 2024 - a 9% increase in two years, and nearly two distinct digital shopping activities happening on an average day.
| Digital shopping activity, PYMNTS/Visa index | 2024 | 2026 | Change |
|---|---|---|---|
| Digital shopping days per month (avg.) | 51 | 55 | +9% |
| Consumers researching on mobile | 31% (vs. 2022) | 39% | +8pp vs. 2022 |
| Purchases with zero digital research | 39% | 32% | -7pp |
| Online order, in-store pickup | Baseline | +18% since 2024 | Fastest-growing hybrid mode |
| Remote purchase with delivery | Baseline | +4.5% since 2024 | Steady growth |
Where discovery happens first, by generation
The research phase of ROPO does not start in the same place for every shopper. Salsify's 2026 survey found the top three channels where shoppers discover new products overall are physical retail stores (60%), online marketplaces such as Amazon (57%), and social media (52%) - but that ranking flips sharply by generation. Gen Z (73%) and millennials (67%) name social media as their favorite discovery channel, while Gen X still slightly favors physical stores (61%) over marketplaces, and baby boomers favor online marketplaces (60%) over stores by a similarly narrow margin. A single "discovery budget" line built around one generation's habits will systematically misread every other cohort in the same funnel - the kind of segmentation gap our growth marketing team maps into a client's channel mix before a single dollar moves.
The categories that get researched online before an offline purchase also cluster predictably: Salsify found the top online purchase verticals are fashion and apparel (65%), food and beverage (60%), and electronics (59%) - and on the product page itself, 61% of shoppers rank images and video as the most important element for completing a purchase, ahead of pricing and availability (60%) and customer ratings and reviews (57%).
| Product discovery channel, 2026 (Salsify) | All shoppers | Gen Z / Millennials | Gen X / Boomers |
|---|---|---|---|
| Physical retail stores | 60% | Lower priority | Gen X: 61%, top channel |
| Online marketplaces (e.g. Amazon) | 57% | Secondary | Boomers: 60%, top channel |
| Social media (TikTok, Instagram, etc.) | 52% | Gen Z 73% / Millennials 67%, top channel | Lower priority |
| Product page element that drives a purchase, 2026 (Salsify) | Share of shoppers |
|---|---|
| Product images and video | 61% |
| Pricing and availability shown clearly | 60% |
| Customer ratings, reviews and UGC | 57% |
| Top online purchase verticals: fashion/apparel, food/beverage, electronics | 65% / 60% / 59% |
Why e-commerce's small dollar share understates its influence
The channel-attribution problem gets sharper once the raw dollar numbers are added. The U.S. Census Bureau put e-commerce at just 17.1% of total US retail sales in Q2 2026, even as e-commerce sales themselves grew 12.2% year over year - nearly triple the 6.7% growth rate of total retail sales in the same quarter. Read on its own, that 17.1% figure looks like online is still a minority channel. Read alongside the 67% webrooming rate, it means a large share of the 82.9% of sales that happen offline were still substantially influenced, compared, and decided online first - revenue a store gets credited for that a website's research content quietly helped close.
That gap is precisely why ROPO measurement needs its own budget line rather than living inside either a pure e-commerce or a pure in-store reporting model. A content page, comparison table, or review section that never processes a transaction can still be the deciding factor in a sale a point-of-sale system attributes entirely to the store. The Omnichannel Index 2026, built by IMPACT Commerce with Google and covering more than 370 brands and retailers across six markets, makes the same case at the benchmark level: it now scores brands on how well AI-mediated discovery and evaluation are integrated across the journey, treating cross-channel influence as a measurable discipline rather than an attribution afterthought.
What a ROPO-aware budget actually funds
Three lines follow directly from the data above. First, in-store-facing digital content - specs, comparison pages, and review aggregation built for the 43% of shoppers who pull out a phone while standing in the aisle, not just the shopper still at home. Second, a measurement layer that credits research touchpoints even when the transaction closes at a register, since a last-click or store-only model will always undercount content that never carries a checkout button. Third, continued investment in the hybrid fulfillment modes growing fastest - online-order-in-store-pickup grew 18% in two years - because that is where the webrooming and showrooming patterns are converging into a single, budgetable behavior rather than two separate ones.
Our data intelligence team builds attribution models specifically to catch this kind of cross-channel influence, and our growth marketing team uses it to decide where content budget actually belongs - online, in-store, or increasingly, built for the moment someone is standing in both places at once. If your reporting still credits every offline sale entirely to the store, talk to our team about closing that measurement gap.
Frequently Asked Questions
What does "research online, purchase offline" actually mean?
It describes a shopper who researches a product online - comparing prices, reading reviews, checking specs - then completes the purchase in a physical store. Salsify's 2026 Consumer Research, a survey of nearly 3,000 shoppers across the US, UK and Canada, calls this behavior 'webrooming' and found 67% of shoppers do it. The reverse pattern, browsing in a store before buying online, is called showrooming and was reported by 53% of the same sample - most shoppers do both depending on the product category, which is exactly why a single-channel attribution model misreads the journey.
Why is ROPO behavior hard to budget for?
Because the channel that gets credit for the sale - the in-store point-of-sale system - is not the channel that did the persuading. A last-click or store-attributed model gives 100% of the credit to the register and 0% to the online research session that actually closed the sale, which systematically undercounts the value of content, review pages, and comparison tools that never carry a checkout button. E-commerce is still only about 17.1% of total US retail sales by dollar value, per the U.S. Census Bureau, and RetailNext's 2026 survey of 1,053 shoppers found 63.1% say better in-store prices would drive more visits, so price and stock signals researched online are shaping a sale a register gets full credit for.
How much has mobile research inside physical stores grown?
Substantially. Salsify's 2026 research found 43% of shoppers have used a smartphone to learn more about a product while standing in a physical store, and at least 30% have used a smartphone to complete a purchase while still in the store. Visa Acceptance Solutions and PYMNTS' 2026 Global Digital Shopping Index, based on a survey of 5,841 consumers, found mobile devices now account for 53% of all purchases across physical and digital channels combined, and that consumers who research products the most heavily on mobile buy 3x more across every channel.
Are purchases with zero digital research disappearing?
Yes, and 2026 marks the first time the trend showed a sharp drop. The Visa/PYMNTS Global Digital Shopping Index found only 32% of consumers made their most recent purchase entirely offline with no digital research or assistance at all, down from 39% in each of the previous survey years since the series launched in 2022. The biggest driver was online orders picked up in-store, which jumped 18% since 2024 - a hybrid behavior that is neither pure online nor pure offline.
Does research online, purchase offline apply the same way across every category?
No. Salsify's data shows 69% of shoppers purchased a new product in a physical store in the past year, up 11 points from early 2025, narrowly ahead of the 68% who purchased through an online marketplace - meaning the store and the marketplace are now running at near parity for where a purchase actually lands, even though the research phase for both groups increasingly starts online. High-consideration categories - electronics, furniture, appliances - tend to show heavier webrooming; impulse and convenience categories skew toward pure online or pure in-store with little crossover.
Sources
Salsify - What Is Showrooming vs. Webrooming? (2026 Consumer Research)
Salsify - 2026 Consumer Research Report: What Makes Shopping Experiences Matter
Visa Acceptance Solutions / PYMNTS Intelligence - 2026 Global Digital Shopping Index
U.S. Census Bureau - Quarterly Retail E-Commerce Sales, Q2 2026
RetailNext - 2026 Shopper Sentiment Report
IMPACT Commerce and Google - The Omnichannel Index 2026