Table of contents
Businesses that respond to reviews earn up to 18% more revenue than businesses that ignore them, and a single star of rating gain has been shown, causally, to move revenue 5-9% - real numbers, both smaller than the vendor-marketing headlines that get recycled every year. For a director building a 2026 budget, the honest math is still strong enough to fund the line item; it just needs the accurate figure attached to it, not the inflated one.
Key Takeaways
- 41% of consumers now "always" read reviews before choosing a business, up from 29% a year earlier.
- 97% of consumers read reviews before a local purchase decision, per BrightLocal.
- Consumers check an average of six review sites before deciding.
- 47% of consumers won't use a business with fewer than 20 reviews.
- 31% will only use a business rated 4.5 stars or higher.
- 74% only trust reviews written in the last three months.
- Businesses that respond to reviews earn up to 18% more revenue.
- Responding to 30%+ of reviews roughly doubles leads generated.
- 97% of review readers also read the business's response, not just the review.
- 45% are more likely to visit after a thoughtful negative-review reply.
- 75% of businesses still don't respond to negative reviews at all.
- A one-star Yelp rating gain causes a 5-9% revenue increase, per Harvard research.
- An extra half star drove 19 points more peak-hour sell-outs in a separate Yelp study.
- The often-cited 270% conversion lift traces to a 2015 vendor study, not a controlled experiment.
- An independent re-run of the same comparison found a 40% lift, not 270%.
- Reputation management software will reach USD 4.91B in 2026, up from USD 4.42B in 2025.
- That market is forecast to hit USD 9.68B by 2031, a 14.60% CAGR.
Reputation management benchmarks at a glance, 2026
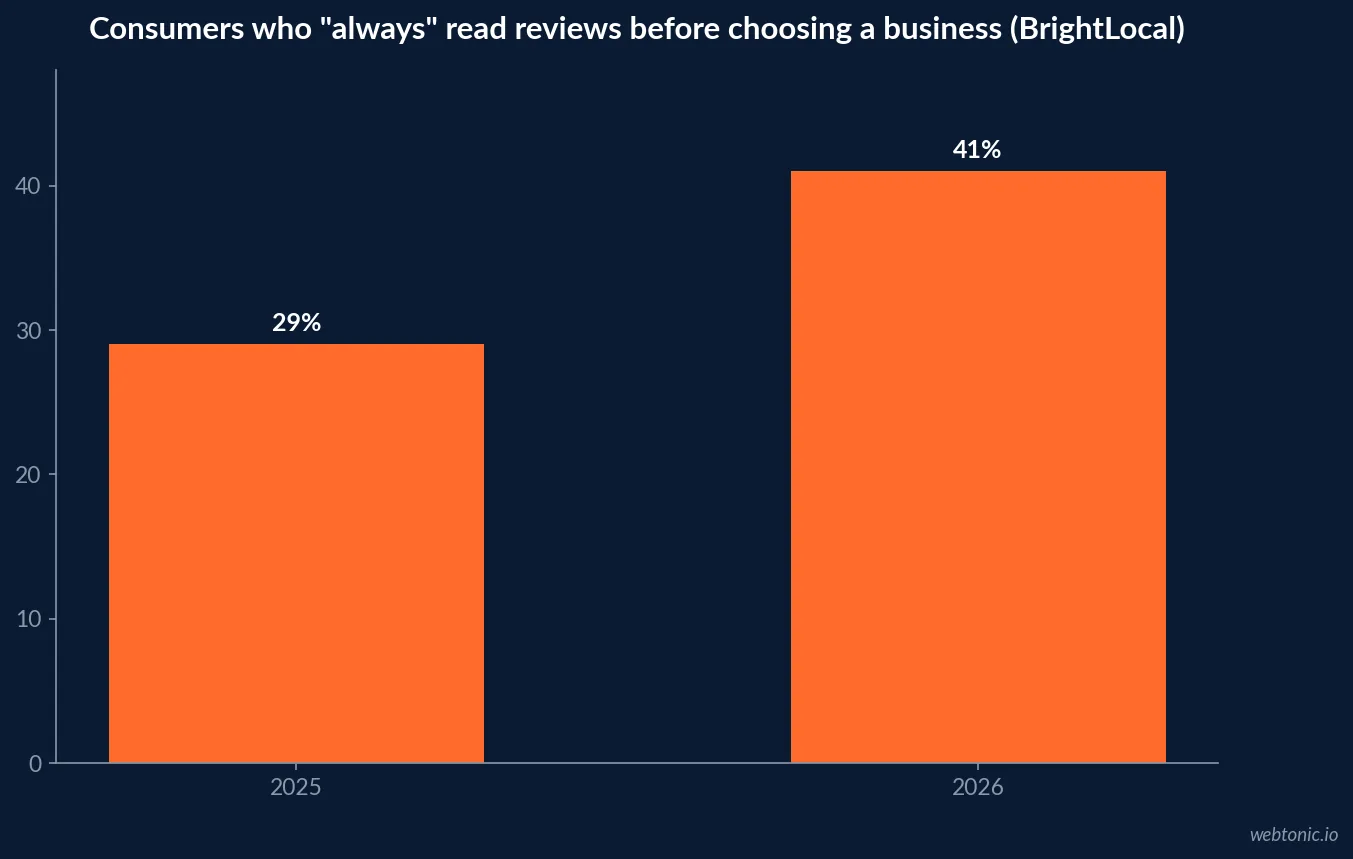
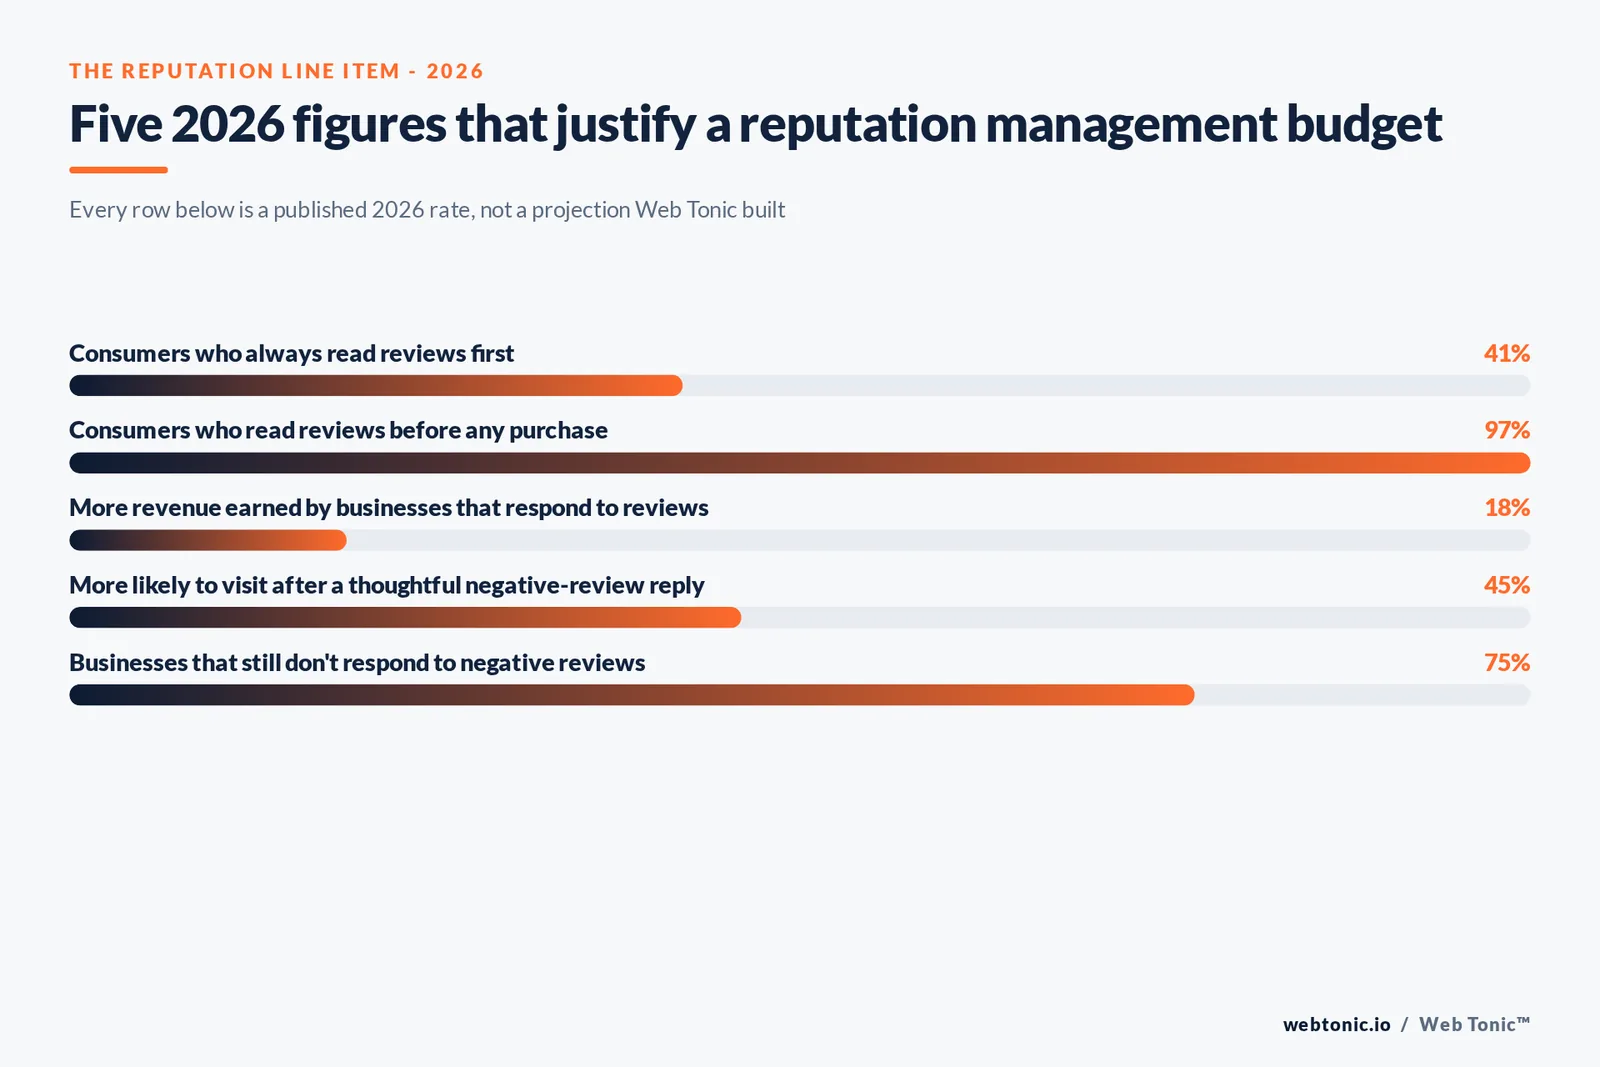
Review influence on local buying decisions has grown sharply in the last year, not stayed flat. The share of consumers who "always" read reviews before choosing a local business jumped from 29% to 41% year over year, according to BrightLocal's 2026 Local Consumer Review Survey of 1,002 consumers, and 97% of consumers now read reviews before a purchase decision at all.
The bar for what counts as trustworthy has also risen. Consumers check an average of six review sites before deciding, and BrightLocal found Google's own share of that traffic slipped from 83% in 2025 to 71% in 2026 - not because Google lost relevance, but because ChatGPT and other generative AI tools jumped from 6% to 45% usage for local recommendations in the same window, becoming the third most common source almost overnight.
| Consumer review behavior, 2026 | Figure | Source |
|---|---|---|
| Always read reviews before choosing a business | 41%, up from 29% | BrightLocal 2026 |
| Read reviews before any purchase decision | 97% | BrightLocal 2026 |
| Average number of review sites checked | 6 | BrightLocal 2026 |
| Won't use a business with fewer than 20 reviews | 47% | BrightLocal 2026 |
| Will only use businesses rated 4.5+ stars | 31% | BrightLocal 2026 |
| Only trust reviews from the last 3 months | 74% | BrightLocal 2026 |
The threshold a business now has to clear
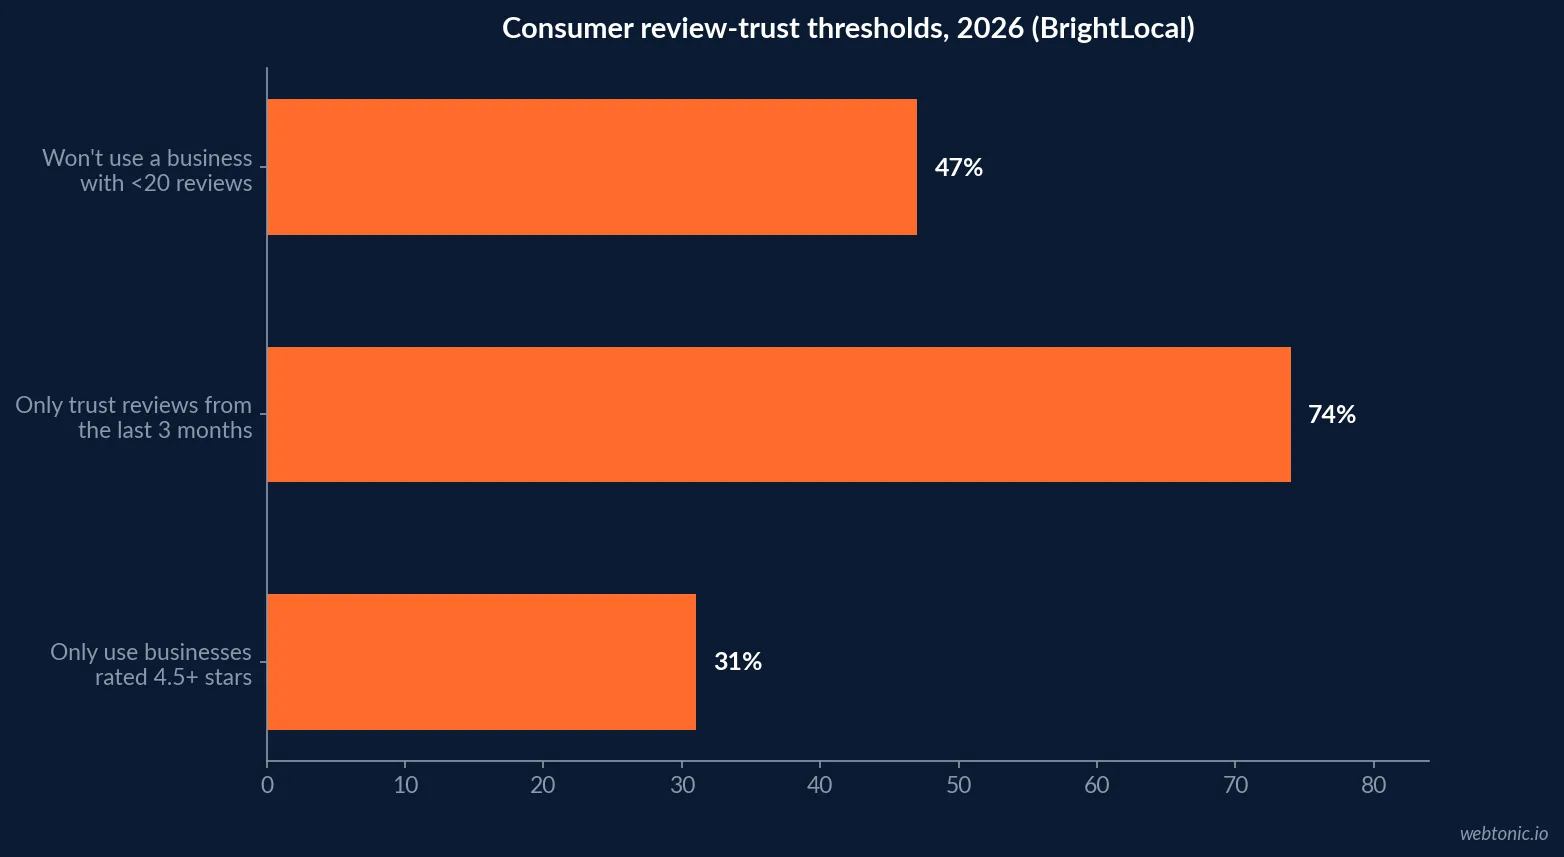
The BrightLocal data draws a fairly hard line around what "credible" means to a 2026 consumer: fewer than 20 total reviews loses 47% of prospects outright, a rating below 4.5 stars loses another 31%, and a review older than three months is discounted by 74% of readers. None of those thresholds are new tastes - they are the same trust signals consumers have always used - but the bar keeps rising each year the underlying survey re-runs, which is the argument for treating review volume and recency as an ongoing operating cost, not a one-time cleanup project.
| Review credibility threshold, 2026 | Share of consumers who enforce it |
|---|---|
| Requires 20+ total reviews | 47% |
| Requires a 4.5+ star average | 31% |
| Only trusts reviews from the last 3 months | 74% |
| Only trusts reviews from the last 2 weeks | 32%, up from 20% a year earlier |
| Only trusts reviews from the last week | 18% |
What responding to reviews is actually worth
Responding is the highest-leverage, most neglected activity in the entire category. Google and Wiser Review's joint research found businesses that actively respond to reviews earn up to 18% more revenue than businesses that never respond, and businesses that respond to more than 30% of their reviews generate roughly 2x more leads. The audience for that response is also larger than most teams assume: 97% of review readers also read the business's reply, not just the original review, which means a well-written response is effectively a second piece of marketing copy read almost as widely as the review itself.
Reputation X found 45% of consumers are more likely to visit a business after seeing it respond thoughtfully to a negative review - a direct rebuttal to the instinct to hide or ignore criticism. Yet an estimated 75% of businesses still don't respond to negative reviews at all, which is the single largest gap between what the data recommends and what businesses actually do.
| Review response impact, 2026 | Figure | Source |
|---|---|---|
| More revenue from active review response | Up to 18% | Google / Wiser Review |
| More leads from responding to 30%+ of reviews | ~2x | Industry research via biziq |
| Review readers who also read the business's reply | 97% | Wiser Review |
| More likely to visit after a thoughtful negative reply | 45% | Reputation X |
| Businesses that don't respond to negative reviews | 75% | Exploding Topics-sourced estimate |
The 270% number that won't die, and what actually replaces it
Most reputation budgets still get pitched with a single recycled statistic: reviews supposedly lift conversion by 270%. The real claim, traced back, is a 2015 vendor study finding that purchase likelihood for a product with five reviews is 270% greater than for a product with no reviews at all - a five-versus-zero comparison of likelihood, not a measured conversion-rate lift on a live page. An independent re-run of a similar comparison, using real clickstream data instead of a correlational survey, found a 40% lift instead.
The two academic studies with genuine causal identification tell a more useful story. Harvard's Michael Luca matched Yelp ratings against audited restaurant revenue data from the Washington State Department of Revenue and found a one-star rating increase causes a 5-9% revenue increase - and that the effect showed up entirely for independent restaurants, not chains, because reviews do the most work when the buyer doesn't already know who you are. A separate study exploiting the same half-star rounding quirk in Yelp's display found an extra half star made restaurants sell out 19 percentage points more often during peak hours. The largest meta-analysis on the topic, spanning 96 studies, finds reviews correlate with sales at r = .091 - modest, real, and roughly a third the size headline marketing implies.
| Reviews-and-revenue claim | What it actually measured | Real figure |
|---|---|---|
| "270% conversion lift" | Purchase likelihood, 5 reviews vs. 0 (2015 vendor study) | 270% (likelihood, not conversion) |
| Independent clickstream re-run | Same 5-vs-0 comparison, different dataset | 40% |
| Michael Luca / Yelp, Harvard | Audited restaurant revenue vs. Yelp rating (causal) | +5-9% revenue per star |
| Half-star rounding study, Yelp | Peak-hour sell-out rate vs. rounded rating | +19 points |
| 96-study meta-analysis | Review presence/volume vs. sales, pooled | r = .091 (modest, real) |
Is the software budget itself actually growing?
Yes, and faster than most adjacent martech categories. Mordor Intelligence sizes the reputation management software market at USD 4.91 billion in 2026, up from USD 4.42 billion in 2025, and projects it will reach USD 9.68 billion by 2031 at a 14.60% compound annual growth rate. A separate estimate from Research and Markets puts the broader online reputation management market at roughly USD 8.1 billion as of its April 2026 report - the two estimates use different category boundaries, which is normal for an adjacent-but-not-identical software segment, but both agree the direction is up and the driver is AI-based sentiment tracking and faster response workflows, not just monitoring dashboards.
| Market estimate (2026) | Size | Forecast | Source |
|---|---|---|---|
| Reputation management software | USD 4.91B | USD 9.68B by 2031, 14.60% CAGR | Mordor Intelligence |
| Broader online reputation management market | ~USD 8.1B | Growth through 2034 | Research and Markets |
What a 2026 reputation budget should actually fund
Three lines earn their place ahead of everything else. First, review volume and recency management - since 47% of consumers reject low-volume profiles and 74% discount reviews older than three months, this is an ongoing acquisition cost, not a one-time push. Second, response operations - the 18% revenue gap between businesses that respond and those that don't is the single largest, least-claimed opportunity in the data, and 75% of businesses are leaving it unclaimed. Third, honest measurement - a director who reports the accurate 5-9% per-star revenue effect, instead of a recycled 270%, will have a defensible number left standing the next time finance asks for the source.
Reputation is inseparable from brand perception at this point, which is why our growth marketing team treats review response as part of the same operating cadence as paid and organic content, not a separate customer-service task, and why our data intelligence reporting tracks review velocity and response rate alongside every other channel KPI. If your reputation program still runs on a spreadsheet nobody checks weekly, talk to our team about what a managed response cadence actually costs.
Frequently Asked Questions
How much revenue does one star of rating actually add?
A causally identified 5-9%, not the often-quoted 270%. Harvard economist Michael Luca matched Yelp ratings against audited restaurant revenue data from the Washington State Department of Revenue and found a one-star increase in rating causes a 5-9% increase in revenue. A separate study using the same half-star rounding quirk in Yelp's display found an extra half star made restaurants sell out 19 percentage points more often during peak hours. Both are real, causal effects; both are much smaller than vendor marketing headlines imply.
Where does the 270% conversion-lift statistic actually come from?
A 2015 vendor study measured that purchase likelihood for a product with five reviews is 270% greater than for a product with no reviews - a five-versus-zero comparison of purchase likelihood, not a measured conversion-rate lift. When an independent analysis re-ran a similar comparison on its own clickstream data, it found a 40% lift instead. The largest academic meta-analysis, covering 96 studies, finds reviews correlate with sales at r = .091 - real, positive, and far more modest than the headline number that keeps getting recycled.
How many consumers actually read reviews before buying in 2026?
BrightLocal's 2026 Local Consumer Review Survey of 1,002 consumers found 97% read reviews before choosing a local business, and 41% now say they 'always' read reviews before browsing a business - up sharply from 29% just a year earlier. The average consumer now checks six different review sites before deciding, so a single-platform reputation strategy already misses most of the surface area a buyer actually considers.
Does responding to reviews actually move revenue, or just look good?
It moves revenue. Google/Wiser Review research found businesses that actively respond to reviews earn up to 18% more revenue than businesses that do not respond at all, and businesses that respond to more than 30% of their reviews generate roughly 2x more leads. Reputation X separately found 45% of consumers are more likely to visit a business after seeing it respond thoughtfully to a negative review. The catch: an estimated 75% of businesses still do not respond to negative reviews, leaving one of the highest-ROI reputation activities almost entirely unclaimed.
Is reputation management software spend actually growing?
Yes, at a double-digit rate. Mordor Intelligence sizes the reputation management software market at USD 4.91 billion in 2026, up from USD 4.42 billion in 2025, and projects it will reach USD 9.68 billion by 2031 - a 14.60% compound annual growth rate. That growth is being driven by AI-based sentiment tracking and faster review-response workflows, not just monitoring dashboards, which is the same shift showing up in what a reputation budget needs to fund next.
Sources
BizIQ - Online Reviews Statistics 2026: Trust, Local SEO & Reputation Data
BrightLocal - Local Consumer Review Survey 2026
CleanCommit - Do Product Reviews Increase Conversion Rate? (2026 data, incl. Luca/Harvard)
Mordor Intelligence - Reputation Management Software Market Size & Share, 2026-2031
Research and Markets - Online Reputation Management Market Outlook 2026-2034