



Table of contents

Short answer: Use the 2026 evidence to frame a test, not to copy a universal benchmark. The statistics below separate measured outcomes from survey opinions and put investment decisions in context.
Key Takeaways
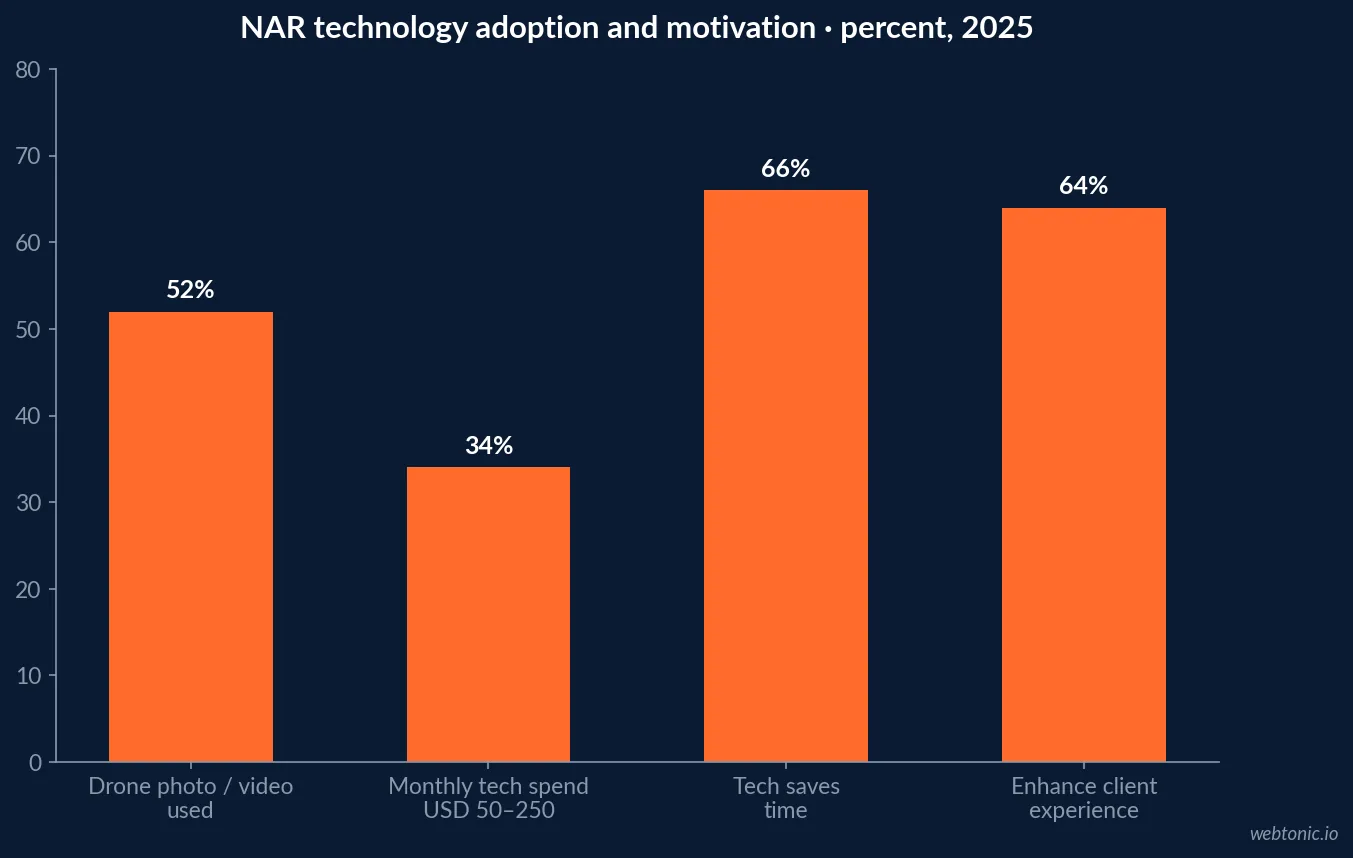
- 52% of NAR 2025 survey respondents used drone photography/video; the survey combines both formats.
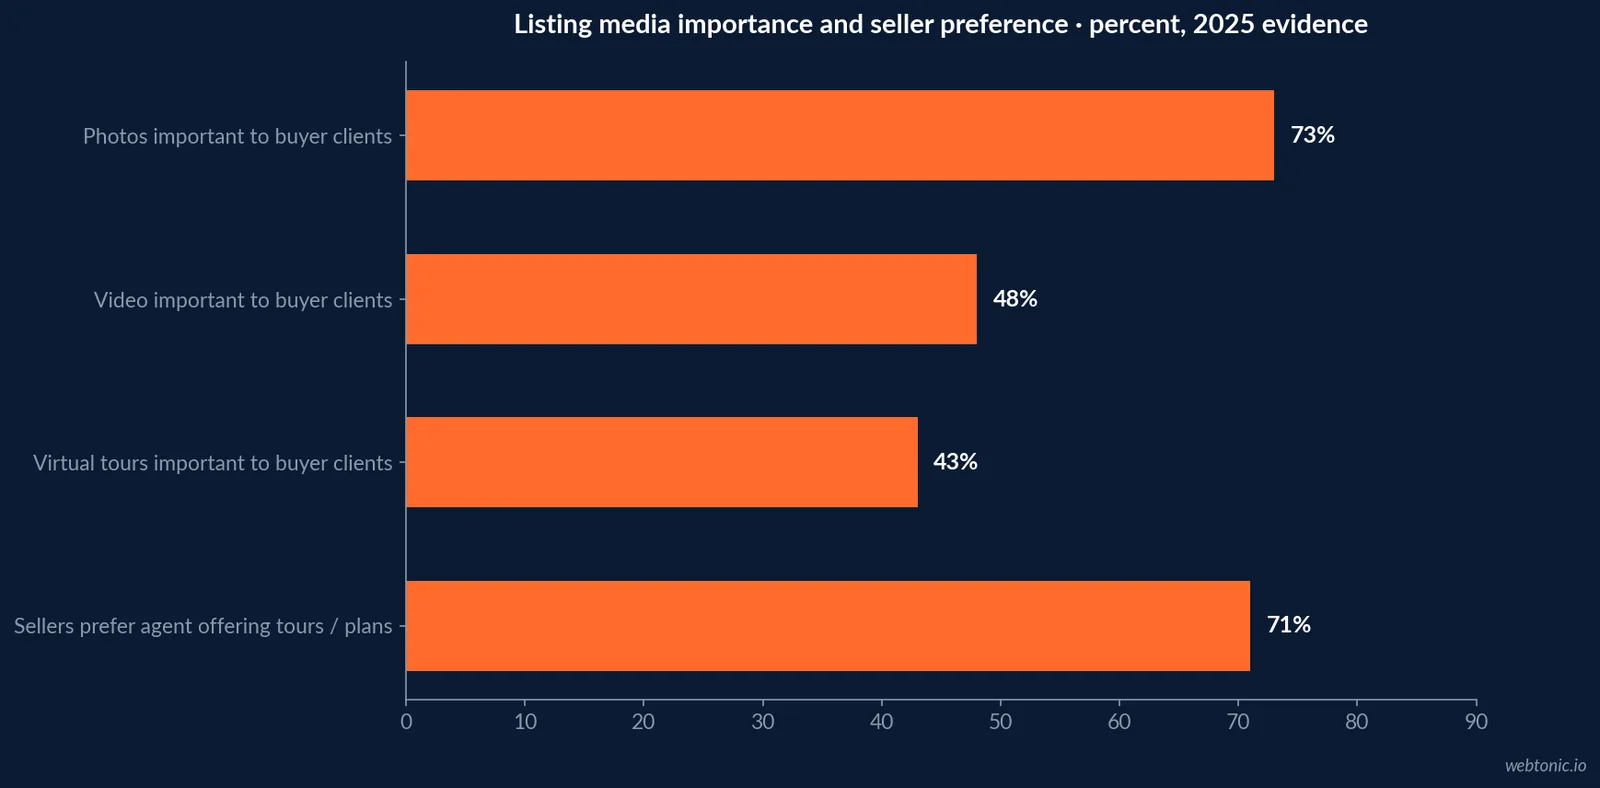
- 48% of buyers’ agents said video availability was important to clients in NAR’s 2025 staging study.
- Real Estate Bees’ 2024 pricing survey uses photographer responses; it is not a universal quote.
- Scope production, rights, distribution and measurement as separate budget units.
Benchmarks at a glance
| NAR / buyer media measure | Result | Year / source | Interpretation |
|---|---|---|---|
| REALTORS® using drone photography/video | 52% | NAR Technology Survey · 2025 | Adoption, combined medium |
| Buyers’ agents valuing listing video | 48% | NAR Profile of Home Staging · 2025 | Agent-reported client importance |
| Sellers more likely to hire for high-res photography | 78% | Zillow Research · 2025 | Seller-reported hiring likelihood |
| Sellers more likely to hire for virtual tours / plans | 71% | Zillow Research · 2025 | Seller-reported hiring likelihood |
| Buyers’ agents valuing listing photos | 73% | NAR · 2025 | Agent-reported client importance |
The budget question starts with the asset, not a magic average
The published figures here describe technology adoption, buyer preferences, agent-reported needs and available production-rate research. Real Estate Bees reported in June 2024 that its editorial team surveyed more than 2,000 active real estate photographers about videography pricing, and its page summarizes rate-model and minimum/maximum-price questions. It also quotes practitioners describing size, time on site, deliverable and acreage as factors. This is a useful price-setting reference, but not an independent transaction database or a universal current quote; collect local proposals for the same scope. “Video campaign” can mean a listing walkthrough, a property lifestyle film, a short vertical edit, a neighbourhood guide, a paid lead-generation creative or a brokerage brand story. Those jobs differ in shoots, post-production, talent, licensing and distribution. A producer quote should spell out capture time, crew, editing rounds, aspect ratios, captions, raw footage, music rights, drone permission and ad versions. Budget distribution separately.
Research source: Real Estate Bees, 2024 real-estate videography survey
What the 2025 NAR technology survey actually says
NAR’s 2025 Technology Survey found drone photography/video was used by 52% of respondents, behind eSignature at 79% and social media at 75%. It surveyed association members about technology use and experience. This is an adoption measure, not a count of dedicated video campaigns, an audience reach figure or proof that video alone generated leads. The report also says 45% of REALTORS® reported very positive client responses to integrating technology into buying and selling, while 66% said time saving motivated technology adoption and 64% cited enhancing client experience. For marketers, these figures support a practical question: will a specific video asset save clients time or clarify a choice? If the answer is no, adoption is a weak rationale. The technology survey also reported 34% spent USD 50–250 monthly on technology for an individual real estate business during the previous 12 months; that is not a video-production budget. Do not repurpose it as one. RISMedia’s 2024 Agent & Broker Marketing Study surveyed thousands of US agents and brokers on marketing activity, investment and measurement, highlighting the challenge of determining what performs. Its cohort is a useful marketing-operations perspective, not a buyer-media preference study.
Research source: NAR 2025 REALTORS® Technology Survey
Read the relevant comparison below alongside the section above; definitions and populations matter.
| Media / decision unit | Share | Study and year | What the result means |
|---|---|---|---|
| Sellers prefer agents offering high-resolution photos | 78% | Zillow Research · 2025 | Seller-reported hiring likelihood |
| Virtual tour / floor plan offer | 71% | Zillow Research · 2025 | Sellers more likely to hire |
| Buyer-agent video importance | 48% | NAR · 2025 | Video available for listings |
| Buyer-agent virtual-tour importance | 43% | NAR · 2025 | Video is not the only format |
| Sellers preferring immersive tours | 87% | Matterport · 2025 | Vendor-commissioned survey |
Buyer-facing listing media: video is one tool among several
Zillow Research’s 2025 Consumer Housing Trends report asked buyers how listing media influences decisions. Zillow’s 2025 agent report found 78% of sellers said they were more likely to hire an agent offering high-resolution photography, and 71% said the same of an agent offering virtual tours and/or interactive floor plans. The report also finds digital tools such as 3D tours increasingly valued by buyers. For a complex property, video may convey layout, sound and movement that still images cannot. But if photography, dimensions and plans are missing, a polished film cannot correct that information gap. Prioritize fundamentals and then test a video variant against the same listing and target audience, with a clear response measure. Define the hook and call to action for a particular buyer question rather than merely repackaging a walkthrough.
Research source: NAR 2025 Profile of Home Staging
Agent perspective: what video availability means
NAR’s 2025 Profile of Home Staging reports 48% of buyers’ agents said videos available for listings were much more or more important to clients, compared with 73% for photos, 57% for traditional physical staging and 43% for virtual tours. This is not the same as buyers ranking video as their top listing feature. Respondents are agents describing client priorities, and the question covers the media available for listings. Read it as a signal that video can be part of a complete marketing kit while photos remain a higher priority in this measure. The report also found 83% of buyers’ agents said staging helped buyers visualize a property as a future home. That finding concerns staging, not video ROI; it may inform creative direction but should not be presented as proof that video causes an offer. Ask agents which property details prospects struggle to imagine, then design a piece of content to answer that specific visualization problem.
Research source: NAR 2025 Profile of Home Staging
Read the relevant comparison below alongside the section above; definitions and populations matter.
| NAR Technology Survey finding | Share | Caveat |
|---|---|---|
| Use drone photography/video | 52% | Does not isolate video production |
| Use social media | 75% | Technology adoption |
| Very positive client response to technology | 45% | Attitude; not revenue effect |
| Technology adopted to save time | 66% | Reported motivation |
| Technology adopted for client experience | 64% | Reported motivation |
How a useful pilot compares video types
A property video plan should name its primary unit of production. Listing walkthroughs document a particular home; neighbourhood clips communicate location context; agent-led explainers establish expertise; short vertical edits may be cut from a longer shoot for social distribution. A single shoot can create multiple versions, but the extra edits, captions, aspect ratios, rights and review time still have costs. Select a pilot property that reflects the intended audience and has permission for filming. Define whether the outcome is qualified inquiry, saved listing, viewing appointment or video completion. Keep each creative variant’s distribution and audience comparable. If paid placements differ, do not attribute performance differences solely to the footage. NAR’s 2025 technology report says social media is the top lead-generating technology reported by members at 39%, with CRM at 23% and local MLS at 17%; these are platform/tool answers, not video-specific lead shares. A video test should plug into a real response path, not end at a view count.
Research source: NAR, 2025 technology survey release
What buyers do online and why context matters
NAR’s 2025 Profile of Home Buyers and Sellers surveyed recent buyers and sellers who transacted from July 2024 through June 2025. Its highlights describe an online-first search process and continued use of websites and mobile devices, while Zillow’s prospective-buyer report gives a separate view of active searchers’ listing preferences. Both can help a marketer understand discovery, but their samples and question wording differ. A buyer who finds a listing online may later inspect it in person, ask an agent, compare floor plans and watch a video. The click trail captures only part of that sequence. A sensible media budget makes room for formats serving different moments: photos for quick scan, plans for layout, tours for remote inspection and video for narrative or movement. Do not add them all automatically; determine which customer uncertainty each asset resolves. Track subsequent steps such as a property detail request or appointment where consent and systems allow.
Research source: realestate.com.au, Property Seeker 2024
Read the relevant comparison below alongside the section above; definitions and populations matter.
| Scope item | Budget definition | Quote detail |
|---|---|---|
| Production | Shoot, crew, location | Hours, travel, equipment |
| Post-production | Edit, caption, versions | Length, aspect ratio, revision count |
| Rights | Music, talent, footage | Term, geography, paid use |
| Distribution | Organic and paid reach | Media spend separate |
| Measurement | Tracking and lead review | CRM, call and landing-page setup |
Scope a quote so that campaign costs are comparable
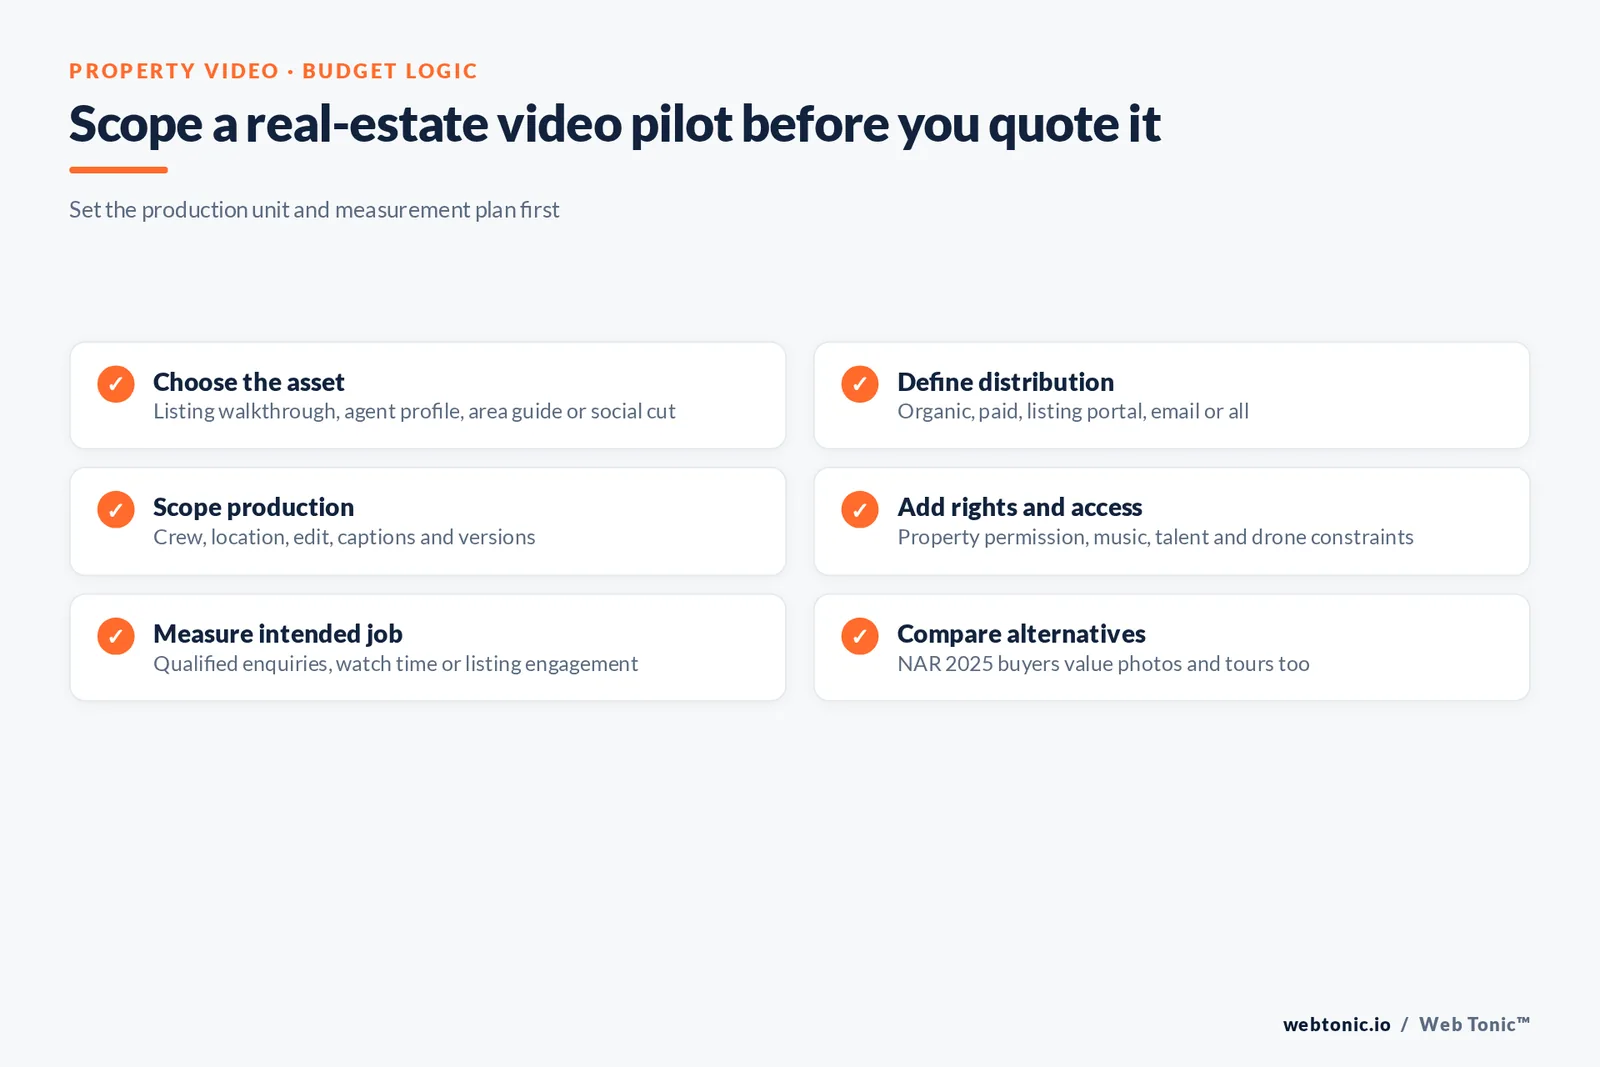
A production quote is only comparable if it covers the same scope. Write down the number of properties, shoot hours, travel, crew, lighting, drone work if any, editing duration, deliverable count, revisions, captions, music licensing, talent and usage term. Specify whether raw footage and project files transfer. Define who secures permission and who handles location access. Then request distribution cost separately: paid media spend is not production. If an agency bundles services, ask for line items and whether the price changes with additional properties or edit versions. Make the first test small enough that an inconclusive outcome is tolerable. Include internal staff time, review and compliance in the real cost of execution. There is no source in this article establishing a standard real-estate video price; publishing a made-up range would create false precision. Obtain a current quote for your market, rights and deliverables.
Research source: Real Estate Bees, 2024 real-estate videography survey
Measurement: move from view count to business question
Views are an input signal, not a business outcome. For a lead-generation campaign, track qualified enquiries and appointments against production plus media cost. For listing discovery, examine detail-page visits, saves and viewing requests. For creative diagnostics, compare watch time, completion and click-through among equivalent audiences and placements. Define a valid view according to the ad platform’s own reporting specification; platforms differ. Use campaign URLs or UTM parameters where appropriate, and preserve source fields in CRM. If phone calls matter, assign tracking consistently and avoid treating every call as qualified. The 2025 NAR survey’s member-reported use and buyer-agent importance figures should not be combined into a calculated conversion rate: their denominators and constructs differ. A small pilot can still be informative if the team predefines its hypothesis, comparison and stop/go rule. Use a verified CRM and measurement plan to connect campaign observations to qualified lead stages.
Research source: NAR REALTOR® Technology Report
Read the relevant comparison below alongside the section above; definitions and populations matter.
| Objective | Useful metric | Avoid claiming |
|---|---|---|
| Lead generation | Qualified enquiry / appointment | Views equal customers |
| Listing discovery | Detail views, saves, showings | One listing proves a pattern |
| Creative diagnosis | Completion, click and response | Comparing unlike audiences |
| Brand awareness | Reach, frequency, recall study | Immediate sales from reach |
How to allocate the 2026 test budget
A practical budget separates five buckets: production, adaptation, rights/access, distribution and measurement. Reserve a portion for one controlled creative test rather than committing all spend to a hero film. Start with the highest-value listing or audience need, and compare a video version with high-quality stills or a virtual-tour asset when possible. Disclose what “success” means before launch. If the goal is awareness, use reach and completed-view metrics as early indicators, but do not declare sales impact from them. If the goal is appointments, count qualified appointments and subsequent outcomes. Think through uneven sample sizes: property supply, price bands, seasonality and local demand all affect results. A single high-performing listing does not establish a replicable benchmark. Update budget only when outcomes repeat across a relevant set of listings and total costs are known. Connect the work to a coordinated marketing plan rather than treating video as a standalone line item.
Research source: Zillow Research, 2025 Consumer Housing Trends for Agents
Risks: rights, representation and operational readiness
Before production, check who can authorize filming, whether tenants or people appear on camera, and whether identifying details should be removed. Drone capture may require legal permissions, licensed operators, airspace checks and property approval depending on jurisdiction; verify locally rather than assuming a universal rule. Music, stock footage, voice and talent must have terms compatible with the intended paid and organic use. Confirm that the footage represents the property honestly. Avoid edits that conceal material limitations or imply features that are absent. Provide captions and accessible alternatives where relevant. Establish a review path so factual errors are caught before a property is advertised. Ensure the landing destination works on mobile and that enquiry routing is staffed; a campaign cannot deliver a useful customer experience if no one answers. Budget includes these safeguards and operational tasks, not just camera time.
Research source: FAA, commercial drone operators
Related planning: growth marketing, data intelligence, performance creative, campaign strategy, and talk with Web Tonic.
Useful next steps: growth marketing, data intelligence, performance creative, and contact Web Tonic.
Frequently Asked Questions
What should real-estate marketers budget for video?
There is no defensible universal rate in the cited surveys. Scope the asset type, shoot days, editing, versions, distribution, rights, location and measurement separately, then collect quotes for that exact scope.
Do buyers prefer video to property photos?
Buyers evaluate a bundle of listing information. Zillow’s 2025 Consumer Housing Trends report and NAR’s 2025 staging study indicate that photos, plans, tours and video each play different roles; the surveys do not establish a universal video-over-photos preference.
How many REALTORS® use video?
NAR’s 2025 Technology Survey reported 52% used drone photography/video. This combines photography and video and does not tell us the share producing listing videos or the amount spent.
Is video important to buyers’ agents?
NAR’s 2025 Profile of Home Staging found 48% of buyers’ agents said videos available for listings were much more or more important to clients. It is an agent-reported importance measure, not a buyer purchase-preference ranking.
What metrics should a property video campaign track?
Choose metrics by objective: qualified enquiries and cost per qualified enquiry for lead generation; completion and click-through for creative diagnostics; or listing-page engagement for property discovery. Attribute leads consistently and include production plus media costs.
Sources
NAR REALTOR® Technology Report
NAR 2025 REALTORS® Technology Survey
NAR 2025 Profile of Home Staging
NAR 2025 Profile of Home Buyers and Sellers
Zillow Research, 2025 Consumer Housing Trends for Agents
realestate.com.au, Property Seeker 2024
Matterport, 2025 buyer and seller study
NAR, 2025 technology survey release
FAA, commercial drone operators
Real Estate Bees, 2024 real-estate videography survey
RISMedia, 2024 Agent & Broker Marketing Study
Florida Realtors, video marketing guidance


