



Table of contents

No ad network publishes real estate native advertising benchmarks, so the most useful data is what buyers say they want to see. NAR's 2025 Generational Trends report shows photos, property detail and floor plans lead buyer preferences, and that is the creative brief a native placement has to meet.
Key Takeaways
- 83% of buyers who used the internet rated listing photos very useful (NAR, 2025 report).
- 79% rated detailed property information very useful; 57% said floor plans.
- 43% of buyers took looking online for properties as their first step.
- Only 29% rated videos very useful and 41% virtual tours.
- 69% of buyers used a mobile or tablet search device; 37% an online video site.
- 88% of buyers bought through an agent in NAR's 2025 Profile (6,103 responses).
- Social media was the top lead-generating technology for 39% of REALTORS in 2025.
- Real estate search leads cost USD 102.51 in WordStream's 2026 data, a paid-search comparator.
- No public source reports a real estate native CTR, CPL or conversion rate.
Real estate native data at a glance
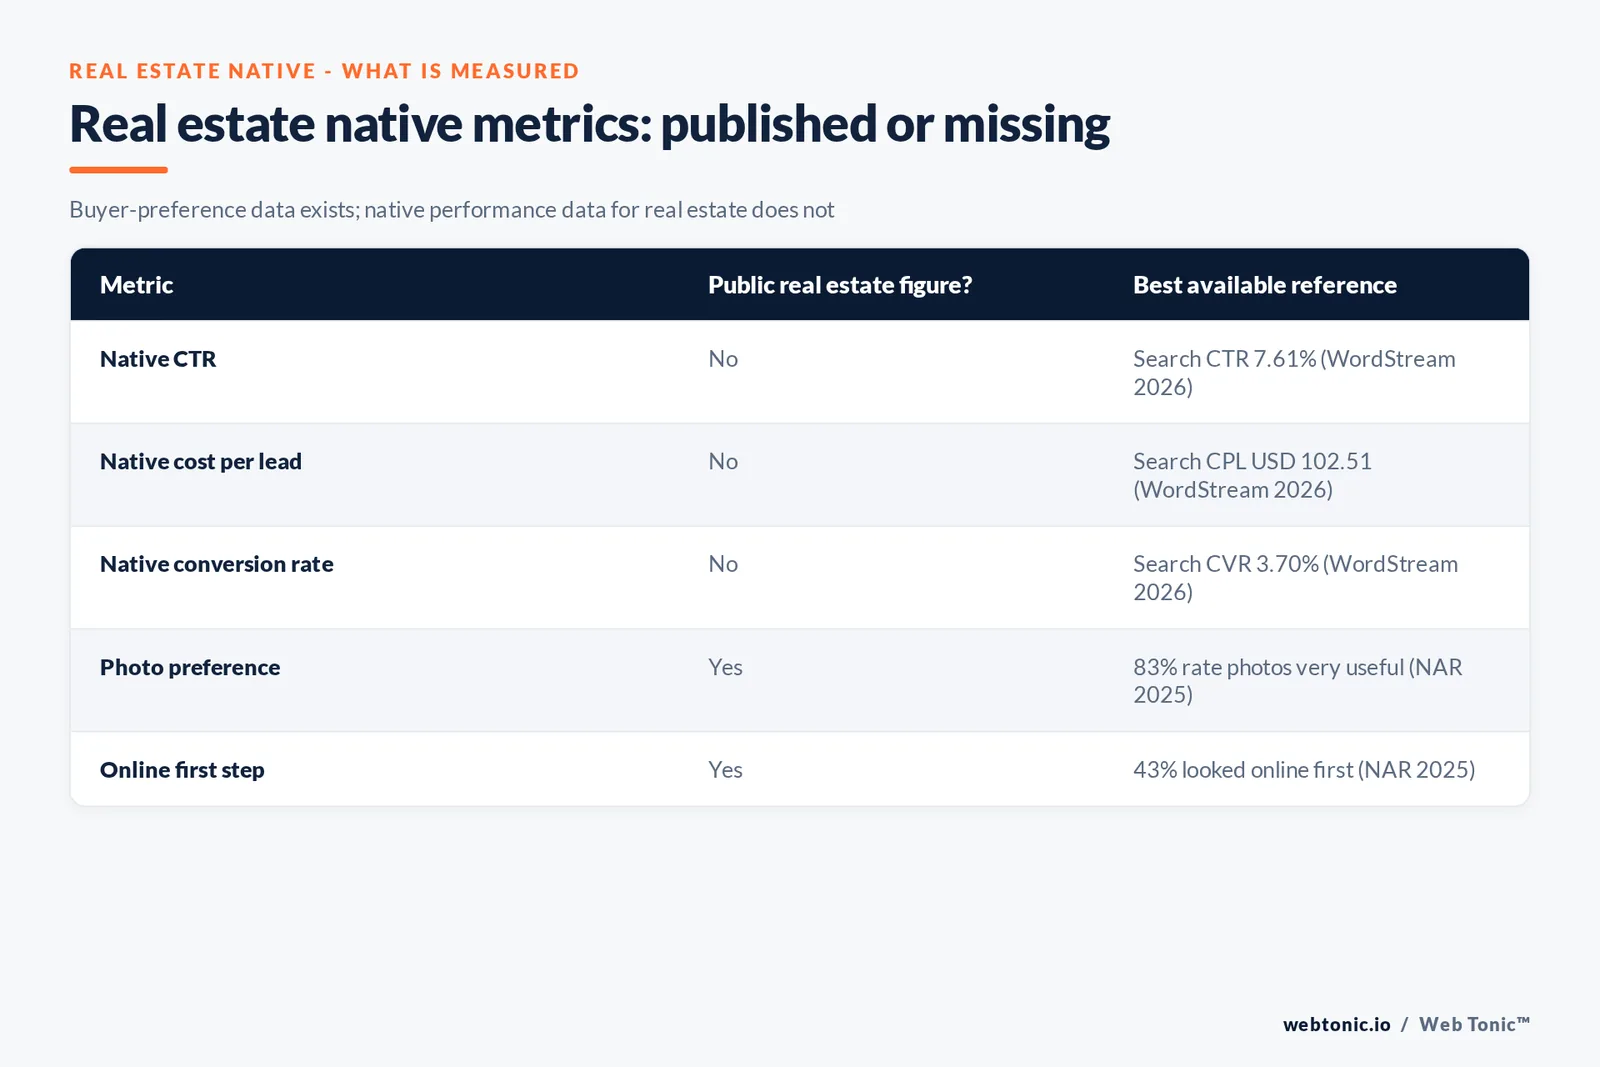
The table separates what is measured from what is not. Buyer preference data is strong because NAR surveys thousands of recent buyers; native performance data for real estate does not exist in public form.
| Data point | Figure | Source and period | Native-specific? |
|---|---|---|---|
| Photos rated very useful | 83% | NAR Generational Trends 2025 | No, buyer behaviour |
| First step: looked online for properties | 43% | NAR Generational Trends 2025 | No |
| Bought through an agent | 88% | NAR Profile 2025 | No |
| Real estate search cost per lead | USD 102.51 | WordStream, Apr 2025-Mar 2026 | No, paid search |
| Real estate native CTR or CPL | Not published | No issuer | Yes, missing |
Where the buyer data comes from
The 2025 Generational Trends report is built on a 127-question survey NAR mailed in July 2024 to 167,750 recent buyers who purchased a primary residence between July 2023 and June 2024; it received 5,390 responses, an adjusted response rate of 3.2%. The newer 2025 Profile of Home Buyers and Sellers surveyed buyers who closed between July 2024 and June 2025 and received 6,103 responses, with a confidence interval of plus or minus 1.25%. Neither survey asks about native ads by name. They measure how buyers search and what content helps them, which is the context native units appear in.
Which listing content buyers rate very useful
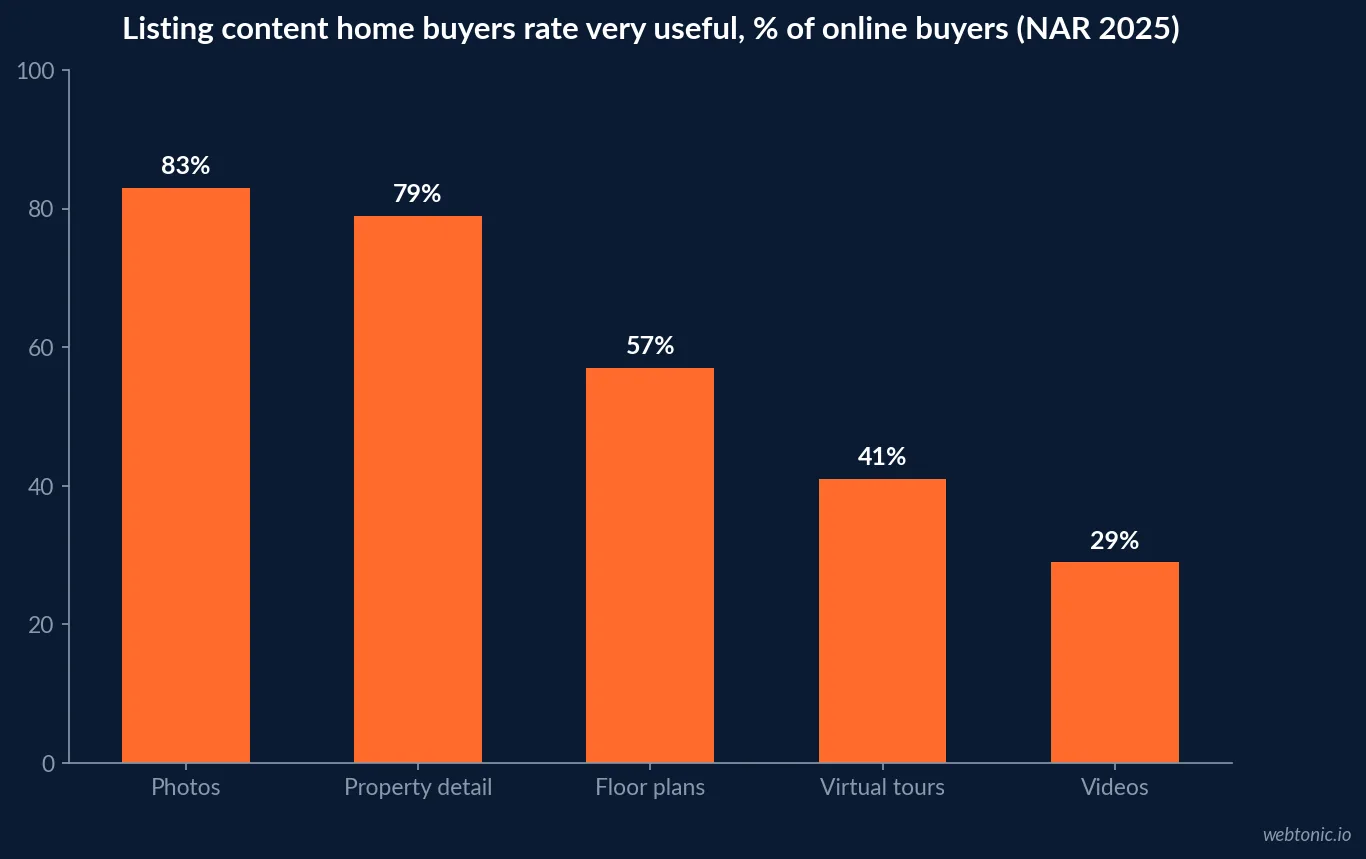
Exhibit 3-6 of the generational report ranks website features among buyers who used the internet. Photos lead at 83%, then detailed information about properties for sale at 79% and floor plans at 57%. Agent contact information came in at 47%, virtual tours at 41%, recently sold data at 37%, neighbourhood information at 35%, pending-sale status at 34%, interactive maps at 30% and videos at 29%.
For native creative the order matters. A sponsored unit that opens on a real interior photo and a price, bed and bath line serves the two highest-rated needs. A video-first unit serves a need fewer than a third of buyers rate very useful, which does not mean video fails, only that it is not what most buyers say they value most.
| Website feature | Very useful, all buyers | Native format it maps to |
|---|---|---|
| Photos | 83% | Image-led sponsored listing card |
| Detailed property information | 79% | Advertorial with specs and price |
| Floor plans | 57% | Carousel or landing page asset |
| Real estate agent contact information | 47% | Click-to-call or form on landing page |
| Virtual tours | 41% | Tour link as secondary call to action |
| Neighbourhood information | 35% | Area guide advertorial |
| Videos | 29% | Motion or video unit, test only |
How preferences shift by buyer age
The age splits are where targeting choices start, and where Fair Housing limits begin. Photos were rated very useful by 86% of buyers aged 35 to 44 but by 66% of buyers aged 79 to 99. Virtual tours peaked at 47% among 35 to 44 year-olds. Agent contact information moved the other way, from 37% among 26 to 34 year-olds to 55% among 70 to 78 year-olds. The data supports varying creative by message, not narrowing who may see a housing ad by age.
| Feature rated very useful | Age 26-34 | Age 35-44 | Age 60-69 | Age 79-99 |
|---|---|---|---|---|
| Photos | 83% | 86% | 79% | 66% |
| Detailed property information | 74% | 79% | 77% | 63% |
| Virtual tours | 36% | 47% | 38% | 34% |
| Agent contact information | 37% | 39% | 48% | 52% |
| Interactive maps | 35% | 37% | 23% | 13% |
How buyers start, and where native can meet them
Exhibit 3-1 of the generational report shows 43% of buyers looked online for properties for sale as their first step, 21% contacted an agent, 9% looked online for information about the buying process and 9% talked with a friend or relative. The online-first share was 31% for 26 to 34 year-olds and 48% for 60 to 69 year-olds. Native placements sit on news and lifestyle sites, so they mostly reach people before or beside that first listing search, not inside it.
That is why the 9% who first look for information about the process matter for native. A paid guide on down payments or closing costs answers a question buyers ask early, which suits a content-recommendation slot better than a listing ad does.
Information sources buyers actually used
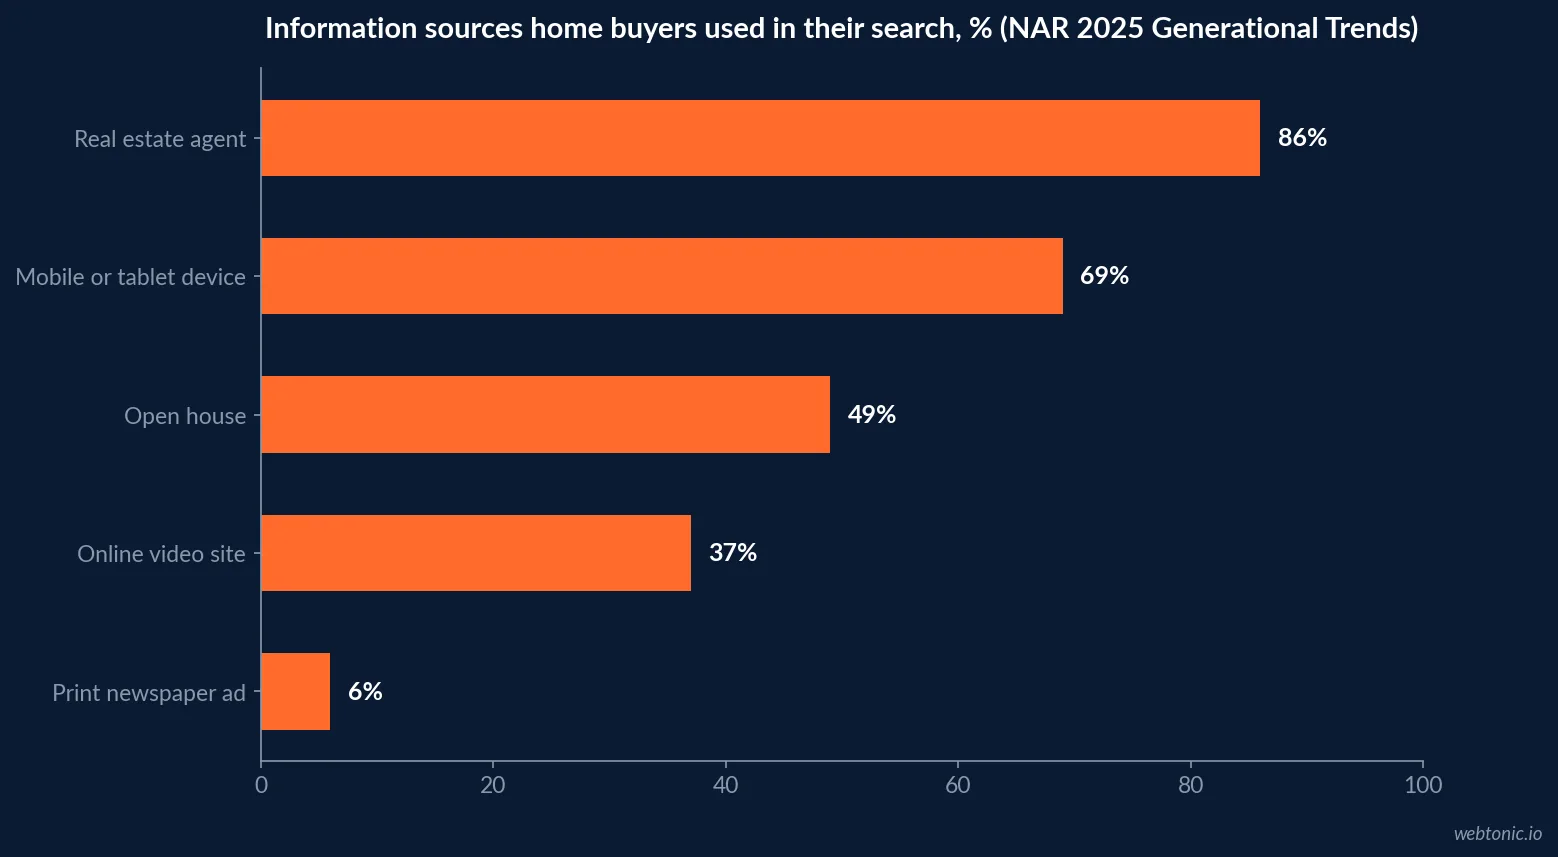
Exhibit 3-2 lists sources buyers used during the search: a real estate agent 86%, a mobile or tablet search device 69%, open houses 49%, an online video site 37%, yard signs 32% and a home builder 17%. Print newspaper advertisements were used by 6%, home books or magazines by 5%, and billboards and television by 3% each. Mobile use fell from 81% among 26 to 34 year-olds to 41% among 79 to 99 year-olds.
| Information source | All buyers | Age 26-34 | Age 79-99 |
|---|---|---|---|
| Real estate agent | 86% | 86% | 89% |
| Mobile or tablet search device | 69% | 81% | 41% |
| Open house | 49% | 52% | 32% |
| Online video site | 37% | 25% | 42% |
| Print newspaper advertisement | 6% | 5% | 13% |
What agents report about lead generation
The supply side comes from NAR's 2025 REALTORS Technology Survey (1,241 usable responses, July 2025, margin of error plus or minus 2.78%). Social media was the top source of quality leads for 39% of respondents, followed by CRM at 23%, the local MLS at 17%, the brokerage website at 13%, their own website and digital ad campaigns at 12% each, email at 11% and listing portals at 9%. Spend on lead generation was modest: 24% spent under USD 50 a month, 27% spent USD 50 to 250, 15% spent USD 251 to 500 and 19% spent more than USD 500. Native is not a category in the survey, so its share of that spend is unknown.
The search comparator, labelled as such
Because no native benchmark exists, buyers of native need a reference price. WordStream's 2026 Google Ads benchmarks (over 13,000 search campaigns, April 2025 to March 2026) list real estate at a 7.61% click-through rate, a USD 3.22 cost per click, a 3.70% conversion rate and a USD 102.51 cost per lead. WordStream also notes real estate had the biggest year-over-year CPC increase of any industry, up 27.27%. These are search numbers, captured from people already looking. A native click from a reader of a news article should be expected to convert lower, and the cost per lead has to be judged against that USD 102.51 figure, not against a native average nobody publishes.
Fair Housing limits on targeting and wording
The Fair Housing rule at 24 CFR 100.75 makes it unlawful to publish any advertisement for the sale or rental of a dwelling that indicates a preference, limitation or discrimination because of race, colour, religion, sex, handicap, familial status or national origin. It lists as discriminatory both "photographs, illustrations, symbols or forms" that convey availability to a particular group and "selecting media or locations for advertising" that deny segments of the market information about housing. Native creative with lifestyle imagery is covered by the first clause, and audience selection by the second.
Google's personalized advertising policy applies the same logic to its own inventory: certain demographics may not be used to target housing ads in the United States and Canada, and ZIP code location targeting cannot be used for them. Open-web native networks set their own policies, but the federal rule applies to the advertiser regardless of network.
Disclosure for listing advertorials
The FTC native advertising guide says a native ad is deceptive if it is not readily identifiable as advertising, that it must be identifiable before consumers reach the main advertising page, and that disclosures must be clear and prominent. A brokerage-funded "best neighbourhoods" article that looks like local news needs a Sponsored or Ad label. The FTC's 2015 enforcement policy statement on deceptively formatted advertisements remains the operative policy, so a market-report advertorial is judged by the same standard as any other native unit.
Who else buys the same native slots
OpenAdLibrary, a native-ad intelligence vendor, counted captured Taboola creatives in June 2026 (vendor index): health led with 6,048, finance 5,558, insurance 4,303, e-commerce 3,330, home and garden 2,630 and software 2,206. Real estate is not one of the named leaders. A listing ad competes for attention beside mortgage, insurance and home-improvement offers, which is another reason to lead with the specific photo and price buyers rate most useful rather than a generic lifestyle image.
| Vertical, Taboola slice | Captured creatives, June 2026 | Relation to real estate |
|---|---|---|
| Health | 6,048 | Unrelated competitor for attention |
| Finance | 5,558 | Includes mortgage and credit offers |
| Insurance | 4,303 | Homeowners insurance adjacent |
| Home and garden | 2,630 | Closest adjacent vertical |
| Real estate | Not named | No count published |
The market backdrop for 2026 listing ads
NAR's August 2026 existing-home sales release put sales at a 3.98 million annual rate, down 2.0% from July, with a median price of USD 429,100. The 2025 Profile adds that first-time buyers fell to a historic low of 21% of buyers and their median age rose to 40, and NAR's summary says 88% of buyers purchased through an agent or broker. Older, equity-rich repeat buyers dominate the pool, which fits the generational data showing agent contact information matters more to older buyers. US digital advertising overall grew 13.9% to USD 294.6 billion in 2025 according to IAB and PwC, but native is not reported as a separate line in that release.
Building native creative from buyer preferences
- Lead with real photos: 83% of online buyers rate them very useful.
- Put specs in the unit: price, beds, baths, because 79% value detailed information.
- Offer floor plans on the landing page, valued by 57%.
- Use process guides for early-stage readers, the 9% who first research how buying works.
- Target by place and topic, never by protected traits, under 24 CFR 100.75.
- Judge cost per lead against USD 102.51, the search comparator, with a holdout.
For cross-industry native data see our native advertising statistics. Real estate search data is in our real estate Google Ads statistics and organic data in our real estate enterprise SEO statistics. Our performance creative team can build listing units around these preferences.
Frequently Asked Questions
Is there a published click-through rate for real estate native ads?
No. Taboola, Teads and the IAB/PwC public summary do not publish a real estate native CTR, CPL or conversion rate. The closest public real estate figures are paid search: WordStream's 2026 data shows a 7.61% CTR, a USD 3.22 CPC and a USD 102.51 cost per lead, which are search comparators, not native results.
What content do home buyers find most useful online?
In NAR's 2025 Generational Trends report, 83% of buyers who used the internet rated photos very useful, 79% detailed property information, 57% floor plans, 41% virtual tours and 29% videos. Native creative that leads with real photos and specific listing details matches those preferences.
Can real estate native ads target by age or ZIP code?
On Google, no for US and Canadian housing ads: Google's policy says certain demographics may not be used to target housing ads and ZIP code location targeting cannot be used. The Fair Housing rule at 24 CFR 100.75 also treats selecting media that deny segments of the market housing information as discriminatory advertising.
Do native advertorials about homes need an ad label?
Yes. The FTC native advertising guide says an ad is deceptive if it is not readily identifiable as an ad, and disclosures must be clear and prominent. A neighbourhood guide paid for by a brokerage needs a visible Sponsored or Ad label before the click.
How much do agents spend on lead generation?
NAR's 2025 Technology Survey found 24% of members spent less than USD 50 a month on lead generation, 27% spent USD 50 to 250 and 19% spent more than USD 500. The survey does not split that spend by channel, so the native share is unknown.
Sources
NAR, 2025 Home Buyers and Sellers Generational Trends Report
NAR, 2025 Profile of Home Buyers and Sellers (highlights)
NAR, 2025 Profile reveals market extremes
NAR, 2025 REALTORS Technology Survey
NAR, existing-home sales, August 2026
eCFR, 24 CFR 100.75 discriminatory advertisements
Google Ads policy, personalized advertising
FTC, Native Advertising: A Guide for Businesses
OpenAdLibrary, Who Advertises on Taboola (vendor index, June 2026)
WordStream, Google Ads Benchmarks 2026
IAB/PwC, Internet Advertising Revenue Report 2025


