



Table of contents
Real estate posted the single biggest year-over-year cost-per-click increase of any industry WordStream tracked into 2026, up 27.27% to $3.22, while its cost per lead of $102.51 sits third highest of the 23 industries in the same report. The unit of analysis here is not "real estate" as one line item - it is the five sub-verticals LocaliQ actually measures separately, because a Homes for Sale by Agent budget and a Property Management budget need different math.
Key Takeaways
- Real estate's overall Google Ads CTR is 7.61%, down 9.73% year over year.
- Overall cost per click is $3.22, up 27.27% - the biggest CPC jump of 23 industries.
- Overall conversion rate is 3.70%, up 12.8% year over year.
- Overall cost per lead is $102.51, up 2.02% year over year.
- Real estate's cost per lead ranks third highest of 23 industries WordStream measured.
- The cross-industry Google Ads cost per lead average is $66.69 for comparison.
- Residential Real Estate Agent has the highest sub-vertical CTR, at 8.00%.
- Homes for Sale by Agent saw a CPC increase of 78.9% year over year, the steepest.
- Property Management converts at 10.24%, the best of the five sub-verticals.
- Property Management's cost per lead is $76.71, the cheapest of the five.
- Real Estate Broker cost per lead rose 53.72% year over year, to $162.39.
- High-intent keywords cost $4 to $8 a click but convert at 8-12%.
- Google Ads CPC has more than doubled since 2016, from $2.32 to $5.42 cross-industry.
- About half of agents budget $50-500 a month on all marketing technology.
- Only 16% of agents use marketing automation tools at all.
- 96% of agents rely on the MLS as their core listing technology.
- Homes for Sale by Agent CTR fell 39.17% year over year, the steepest CTR decline.
- Real Estate Broker CTR rose 17.77%, the strongest CTR gain of the sub-verticals.
Real estate's Google Ads scorecard for 2026
LocaliQ pulled nearly 900 unique real estate search campaigns running from April 2025 through March 2026 to build this year's benchmark. The headline: costs are up, but so is the payoff. Click-through rate slipped, cost per click jumped, yet conversion rate improved more than the cost increases did.
| Metric (2026, all real estate) | Value | Year-over-year change |
|---|---|---|
| Click-through rate | 7.61% | -9.73% |
| Cost per click | $3.22 | +27.27% |
| Conversion rate | 3.70% | +12.8% |
| Cost per lead | $102.51 | +2.02% |
Why the sub-vertical you fall into matters more than the category average
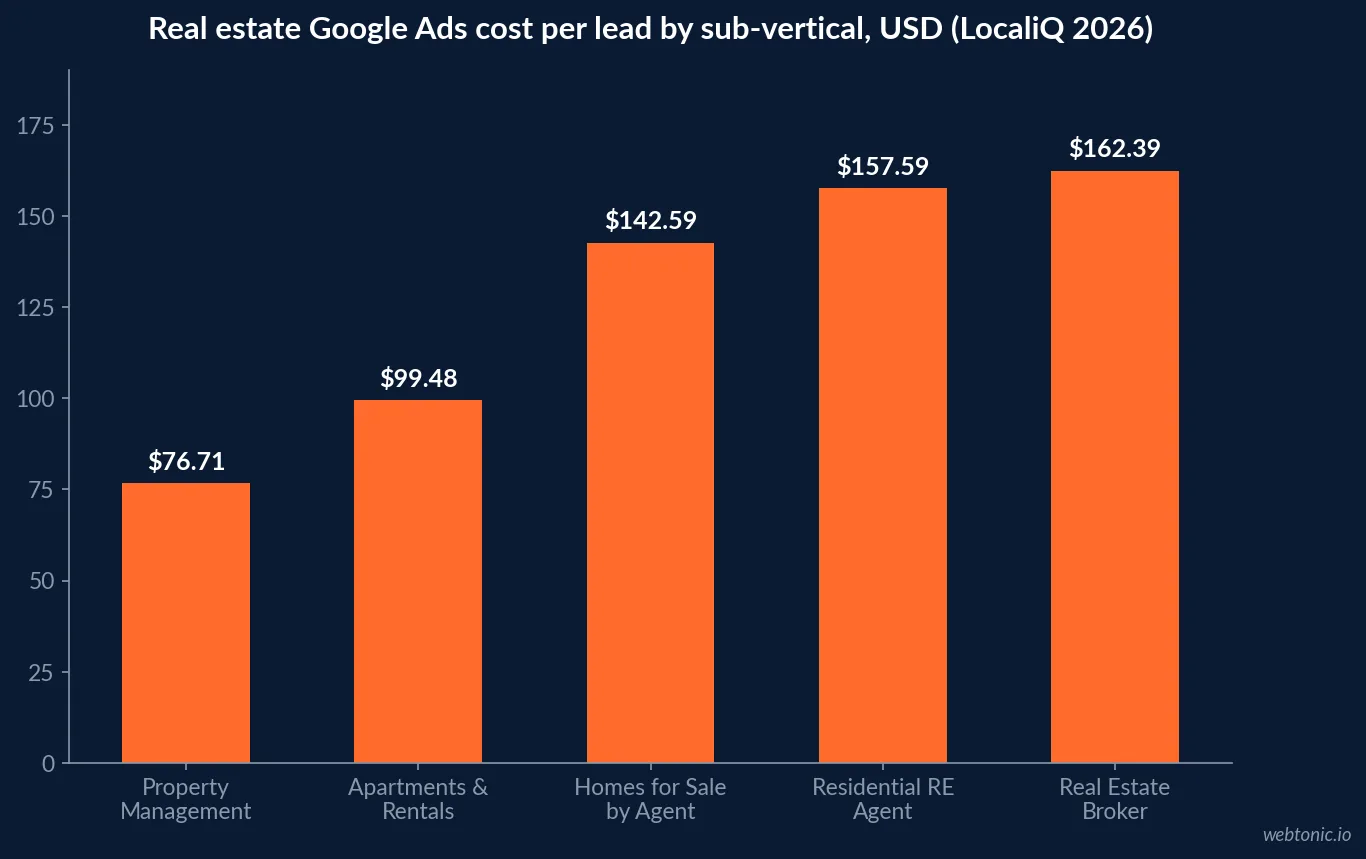
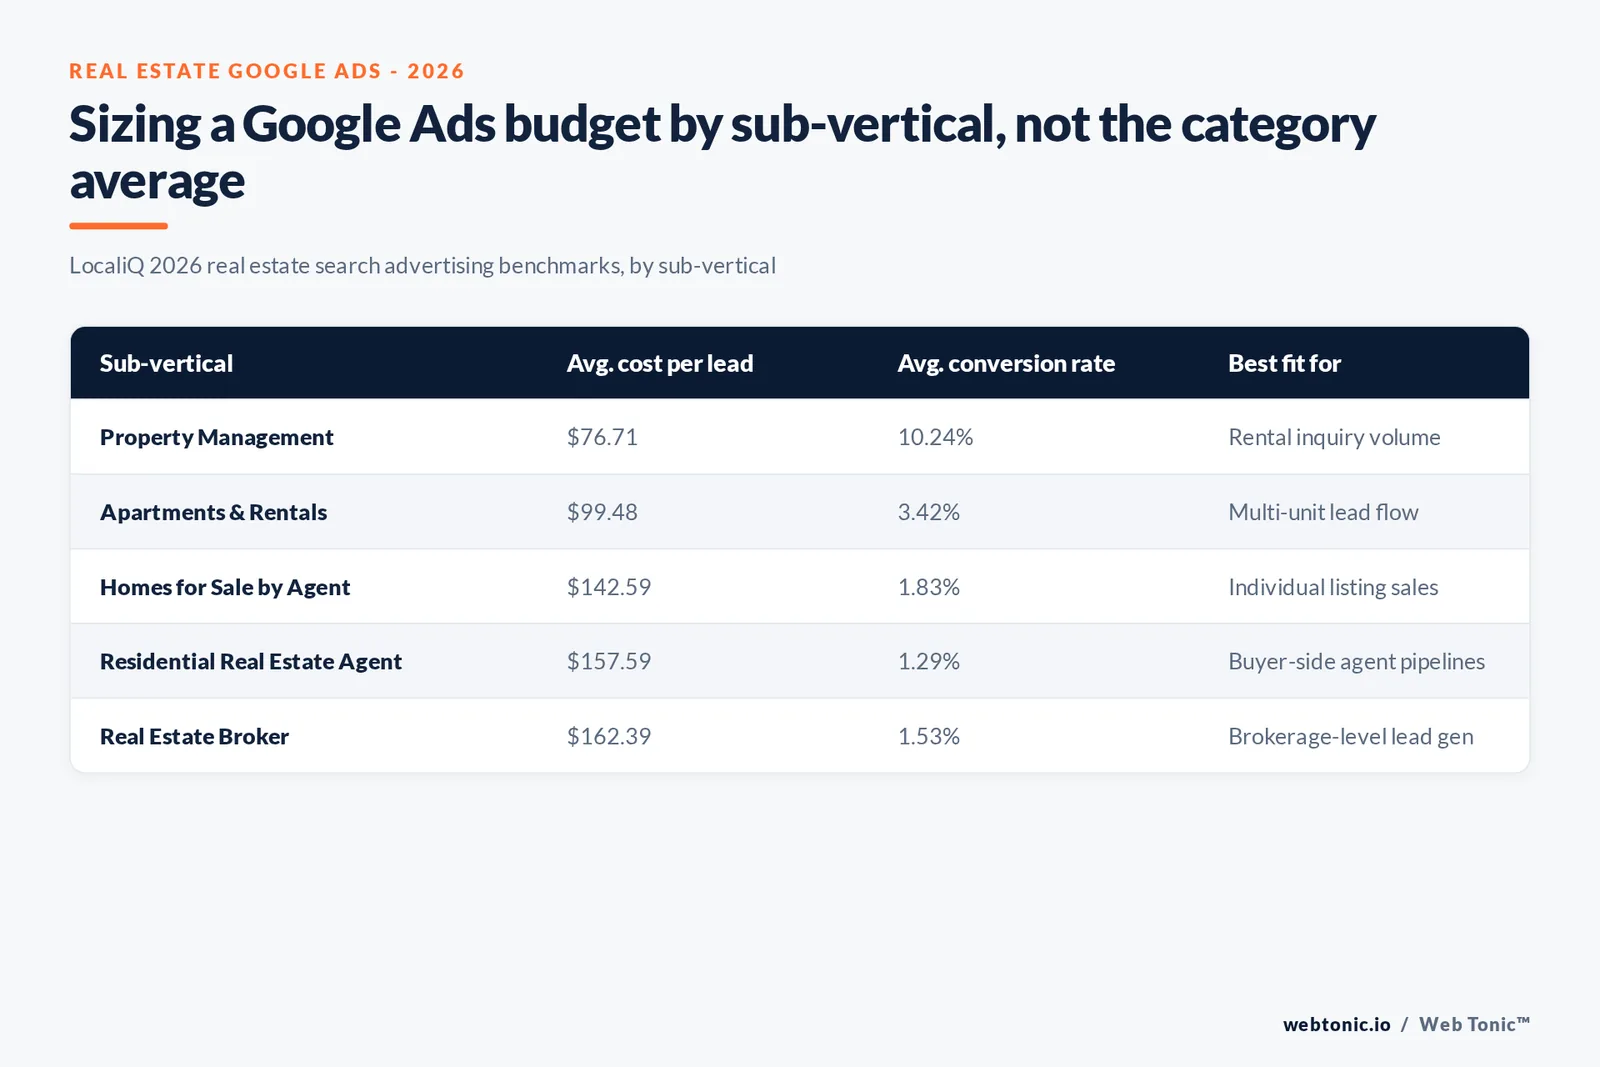
"Real estate" as a single line hides a five-way split. LocaliQ breaks its sample into Apartments & Rentals, Homes for Sale by Agent, Property Management, Real Estate Broker, and Residential Real Estate Agent - and the spread between the cheapest and priciest sub-vertical is more than double on cost per lead. A brokerage budgeting off the $102.51 category average when it actually competes as a Real Estate Broker ($162.39) will underfund its account by more than a third.
| Sub-vertical | Avg. CTR | Avg. CPC | Avg. conversion rate | Avg. cost per lead |
|---|---|---|---|---|
| Apartments & Rentals | 7.73% | $3.10 | 3.42% | $99.48 |
| Homes for Sale by Agent | 5.87% | $3.90 | 1.83% | $142.59 |
| Property Management | 6.66% | $3.94 | 10.24% | $76.71 |
| Real Estate Broker | 7.29% | $3.71 | 1.53% | $162.39 |
| Residential Real Estate Agent | 8.00% | $3.19 | 1.29% | $157.59 |
The cost per click story: real estate is the year's biggest mover
WordStream's 2026 Search Advertising Benchmarks report, drawn from more than 13,000 campaigns across 23 industries, names real estate the single biggest cost-per-click gainer of the year, up 27.27%. Zoom into the sub-verticals and two are doing almost all of that work: Homes for Sale by Agent cost per click rose 78.9% year over year, and Real Estate Broker cost per lead rose 53.72%. Property Management moved the opposite direction, with cost per click down 18.09% and cost per lead down 13.92% - proof that "real estate got more expensive" is only half the story.
| Year-over-year change (2026) | Sub-vertical | Direction |
|---|---|---|
| Cost per click | Homes for Sale by Agent | +78.9% (steepest rise) |
| Cost per lead | Real Estate Broker | +53.72% (steepest rise) |
| Click-through rate | Real Estate Broker | +17.77% (best gain) |
| Click-through rate | Homes for Sale by Agent | -39.17% (steepest decline) |
| Cost per click | Property Management | -18.09% (best decline) |
| Cost per lead | Property Management | -13.92% (best decline) |
How real estate's cost per lead compares to every other industry
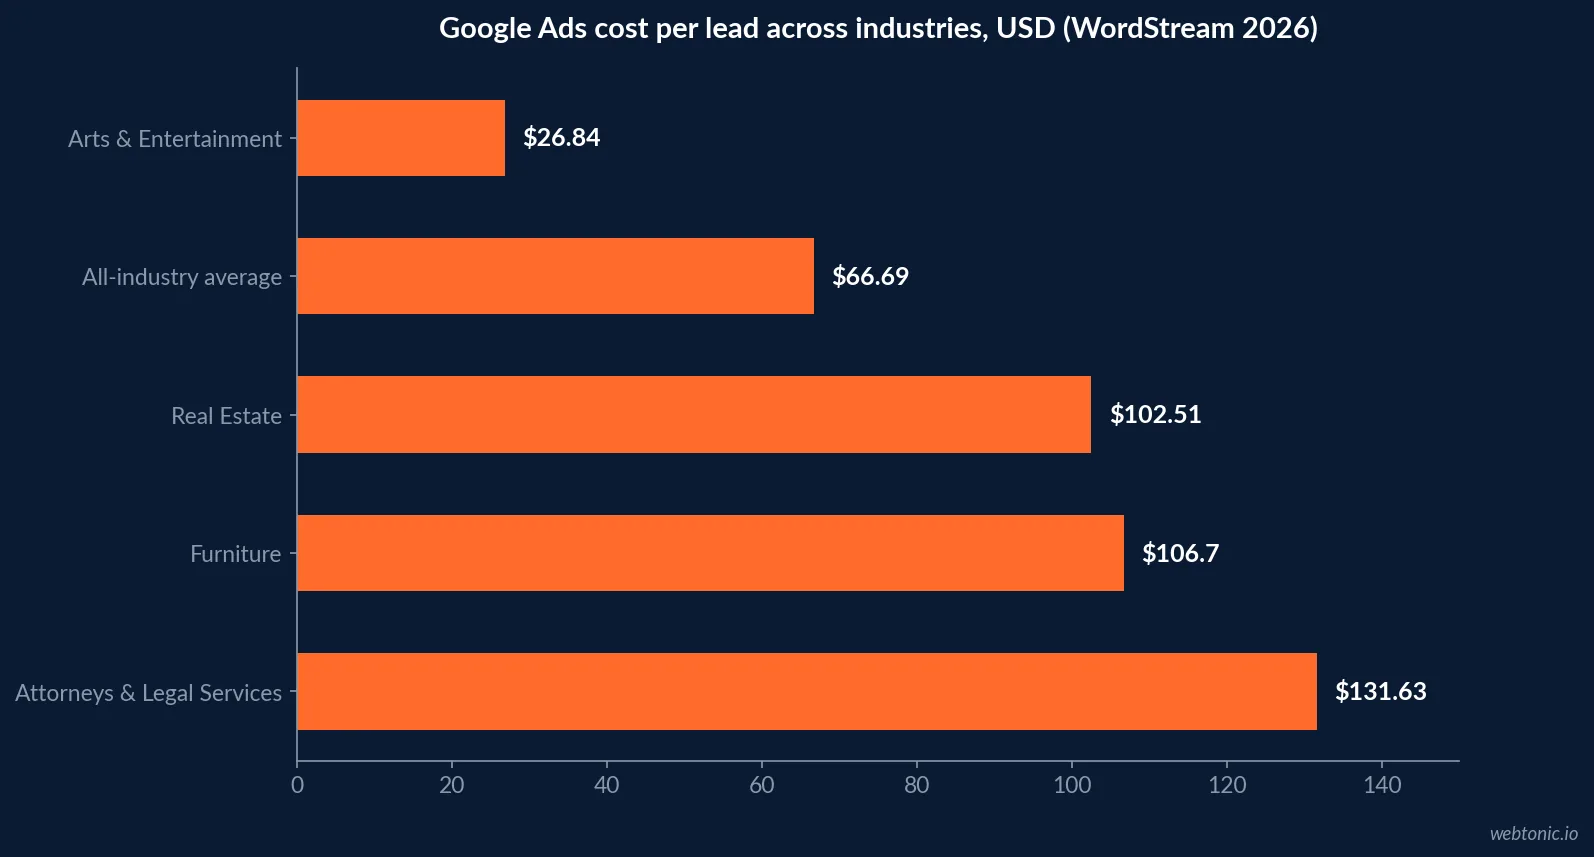
WordStream's cross-industry table puts real estate's $102.51 cost per lead third highest of the 23 industries it measured for 2026, trailing only Attorneys and Legal Services ($131.63) and Furniture ($106.70). That is more than 50% above the $66.69 all-industry average. Budgets built on a generic "Google Ads cost per lead" benchmark from a marketing blog, rather than the real estate-specific number, will be underfunded before the first click is bought.
| Industry (2026) | Cost per lead | Where real estate ranks |
|---|---|---|
| Attorneys and Legal Services | $131.63 | Highest of 23 industries |
| Furniture | $106.70 | 2nd highest |
| Real Estate | $102.51 | 3rd highest |
| All-industry average | $66.69 | Real estate is 53.8% above average |
| Arts and Entertainment | $26.84 | Lowest of 23 industries |
What the ten-year trend means for a 2026 budget
WordStream has run this report for a decade, and its own framing matters: cost per click across all industries is now more than double what it was 10 years ago ($2.32 in 2016 versus $5.42 in 2026), and cost per lead has grown from $59.18 to $66.69 over the same span. Real estate's 2026 numbers sit inside a market that has structurally re-priced, not a one-year spike. A budget built on 2023 or 2024 assumptions is already stale.
Paying for high-intent keywords on purpose
LocaliQ's own tip for the category: terms like "homes for sale Houston" or "sell my house fast" run $4.00 to $8.00 a click, roughly double the $3.22 category average, but convert at 8% to 12% against the category's 3.70% average. The instinct to protect a low average cost per click by avoiding those terms is the wrong instinct - the extra spend buys leads that are two to three times more likely to close, not just more traffic.
Structuring a Google Ads account around intent tiers, rather than one flat keyword list, is how that trade-off gets managed without blowing the monthly budget on branded or low-intent terms.
Sizing the budget against the technology stack agents already pay for
Google Ads spend does not happen in a vacuum. The National Association of REALTORS' 2026 Technology Report, based on 1,200 agents surveyed in June 2026, found about half budget $50 to $500 a month on all marketing technology combined, 22% spend more than $500, and 18% spend under $50. Only 16% of agents use any marketing automation tool, and 96% still lean on the MLS as their core listing system. A Google Ads budget that assumes a mature martech stack behind it, when the account has none, will waste spend on leads nobody follows up.
| Agent tech spend band (NAR 2026) | Share of 1,200 agents surveyed |
|---|---|
| Under $50 a month | 18% |
| $50 to $500 a month | ~50% |
| Over $500 a month | 22% |
Building the monthly number
The arithmetic is simple once the sub-vertical is right: monthly lead target multiplied by the sub-vertical's cost per lead equals the monthly Google Ads budget, before agency fees or landing page spend. A Property Management operator chasing 50 leads needs roughly $3,836 ($76.71 x 50). A Residential Real Estate Agent chasing the same 50 leads needs roughly $7,880 ($157.59 x 50) - more than double, for the identical lead count.
| Monthly lead target | Property Management budget | Residential Real Estate Agent budget |
|---|---|---|
| 20 leads | $1,534 | $3,152 |
| 50 leads | $3,836 | $7,880 |
| 100 leads | $7,671 | $15,759 |
Where a Google Ads budget should sit next to paid social
Google Ads is not the only paid channel worth funding, and real estate's own numbers make the case for splitting spend rather than concentrating it. Meta's leads-objective cost per lead for real estate runs far below Google's - a comparison worth reading in full alongside this benchmark before finalizing a channel mix.
How the trade press read the same technology shift
The budget conversation does not happen in a vacuum inside a single agent's spreadsheet. RISMedia's coverage of the same 2026 NAR Technology Report frames the story as agents making "practical choices" rather than chasing every new tool, which lines up with the budget bands above: most agents are not funding a large martech stack, so a Google Ads line item has to compete for a modest, mostly untouched pool of monthly spend rather than an already-generous marketing budget.
What to check before signing off a monthly report
A monthly Google Ads report for a real estate account should be read against the sub-vertical benchmark, not the category average, and against the prior-year change, not just the current number. Four checks catch most of the budget mistakes this data set exposes.
| Check | Why it matters for real estate specifically |
|---|---|
| Is the sub-vertical benchmark being used, not the $102.51 blended average? | The five sub-verticals span $76.71 to $162.39 cost per lead - a 2x spread |
| Is spend tilted toward high-intent terms despite the higher CPC? | $4-8 clicks convert at 8-12%, roughly double the category average |
| Does the YoY change match the sub-vertical's known direction? | Some sub-verticals got cheaper in 2026 (Property Management) while others got sharply more expensive |
| Is the Google Ads line sized against the agent's total tech budget? | Half of agents spend under $500/mo on all marketing technology combined |
For agencies running this account, pairing that report against a documented Google Ads agency benchmark and the general cost-of-Google-Ads guide keeps the client conversation anchored in real estate's own numbers instead of a generic industry average that understates what a Real Estate Broker or Residential Agent account should expect to pay.
Frequently Asked Questions
How much should a real estate business budget for Google Ads in 2026?
Start from LocaliQ's 2026 real estate average cost per lead of $102.51 and multiply by the number of leads your funnel needs in a month. A brokerage chasing 40 leads a month should plan on roughly $4,100 in monthly ad spend before agency or tooling fees, more if it competes in a Homes for Sale by Agent or Real Estate Broker sub-vertical where cost per lead runs $142 to $162.
Why did real estate cost per click jump so much in 2026?
WordStream's 2026 industry benchmark report names real estate the single biggest cost-per-click gainer of the 23 industries it tracks, up 27.27% year over year to $3.22. Two sub-verticals drove it: Homes for Sale by Agent (+78.9%) and Real Estate Broker, both pushed by tighter housing inventory and more agents bidding on the same finite pool of high-intent searches.
Which real estate sub-vertical gets the cheapest leads on Google Ads?
Property management. LocaliQ's data puts its cost per lead at $76.71 and its conversion rate at 10.24%, far above the other four sub-verticals measured, because rental inquiries convert faster and cheaper than a home purchase decision that can take months.
Is real estate cost per lead high compared to other industries on Google Ads?
Yes. WordStream's 2026 cross-industry report ranks real estate's $102.51 cost per lead third highest of 23 industries, behind only Attorneys and Legal Services ($131.63) and Furniture ($106.70), and well above the $66.69 all-industry average.
Should a real estate budget chase high-intent keywords even though they cost more?
Generally yes. LocaliQ reports that high-intent terms such as "homes for sale [city]" or "sell my house fast" run $4 to $8 a click, roughly double the $3.22 category average, but convert at 8-12% against the category's 3.70% average - the extra spend buys a materially higher close rate, not just more traffic.
Sources
LocaliQ - 2026 Real Estate Search Advertising Benchmarks
WordStream - Search Advertising Benchmarks by Industry 2026 (PDF)
National Association of REALTORS - 2026 Technology Report coverage
National Association of REALTORS - REALTORS Technology Report
NAR Store - 2026 REALTORS Technology Report
Web Tonic - Growth Marketing services
Web Tonic - Google Ads agency services
Web Tonic - Google Ads strategy guide


