Table of contents

A home cannot be a Google Shopping ad: Google's Unsupported Shopping content policy names real estate, non-portable homes and plots of land as immovable property. A property feed therefore has to be used through other Google formats, each with housing-specific targeting limits.
Key Takeaways
- Real estate is unsupported Shopping content, and so are brokerage services.
- US existing-home sales ran at a 3.98 million annual rate in August 2026 (NAR).
- Median existing-home price: USD 429,100, up 1.6%.
- Inventory reached 1.62 million units, or 4.9 months of supply.
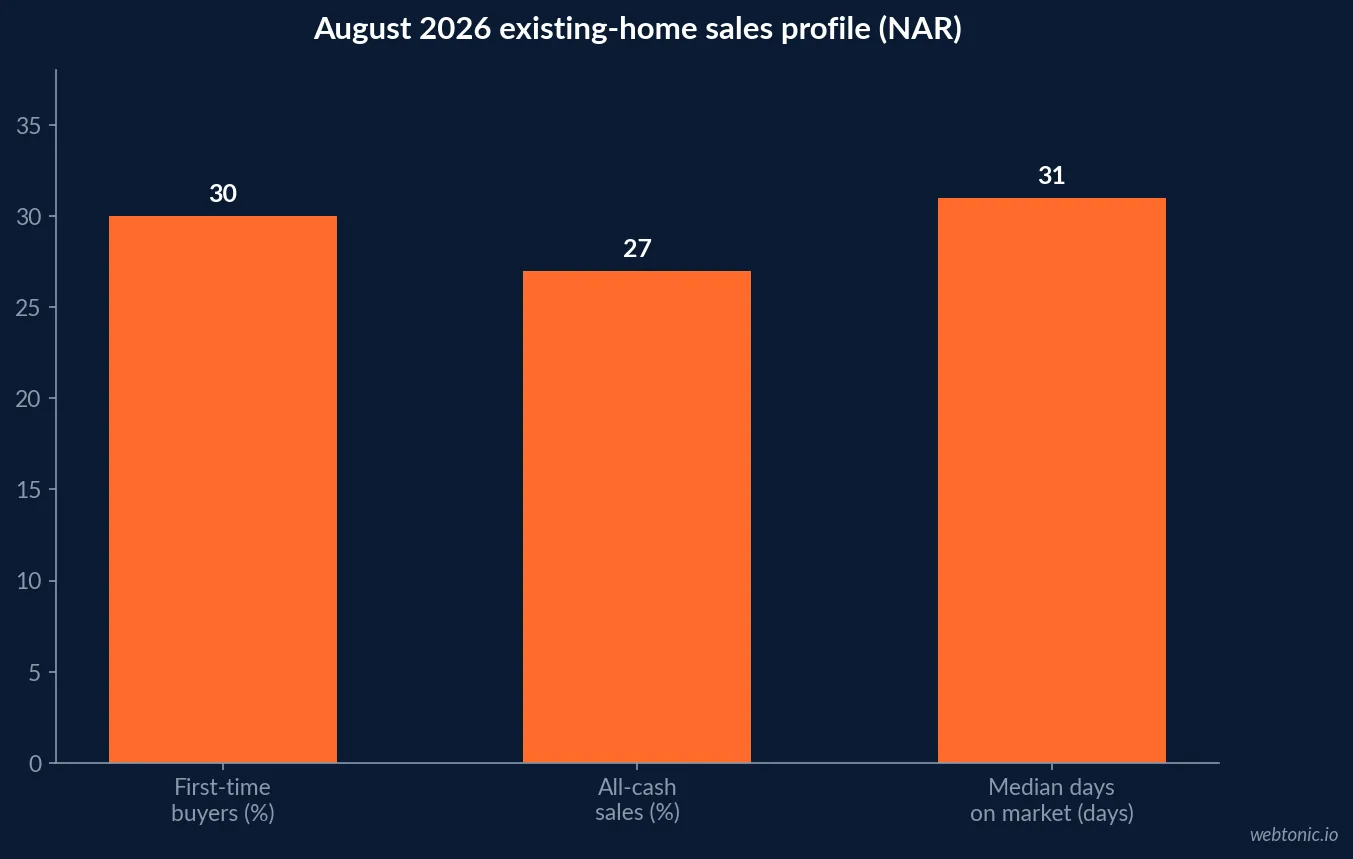
- First-time buyers were 30% of August sales; cash buyers 27%.
- Median time on market: 31 days.
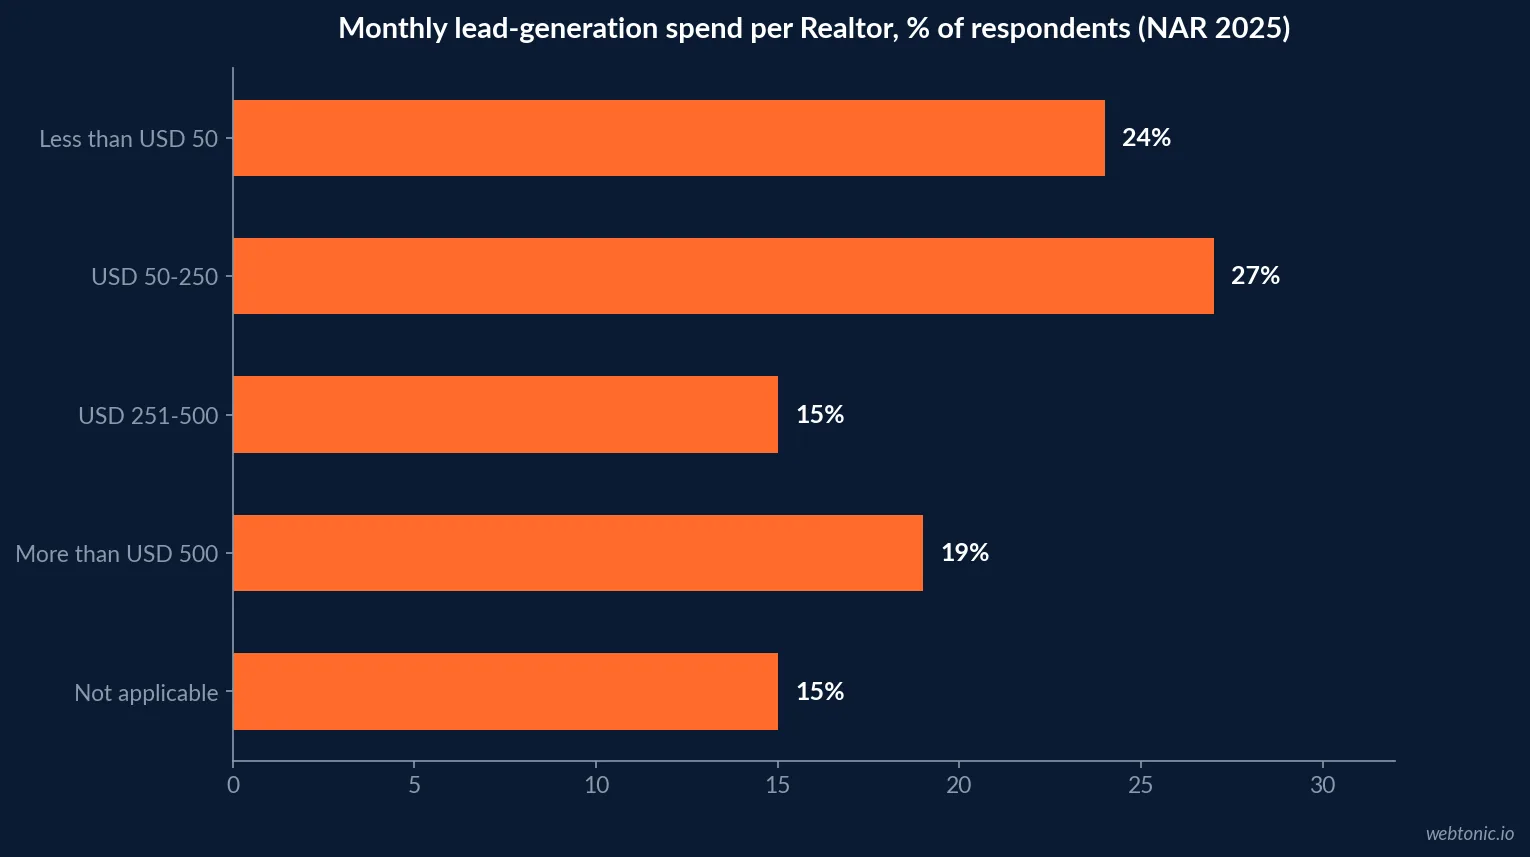
- 24% of Realtors spend under USD 50 a month on lead generation (NAR 2025).
- 19% spend more than USD 500 a month.
- Housing ads in the US and Canada cannot use ZIP targeting or age, gender, marital or parental status.
- Local Services Ads charge per valid lead and list Real estate services.
- Search took 38.8% of US internet ad revenue in 2025 (IAB/PwC).
Why a property feed cannot run in Shopping
The policy defines immovable property as "property not physically movable or which cannot be moved without being altered or destroyed" and gives three examples: "real estate, non-portable homes, plots of land". Agent and broker work also falls under the separate services exclusion - "labor, time, effort, expertise, or actions, which do not result in ownership of a tangible product". Neither a listing nor a commission can be a Merchant Center product, and the exclusion applies to paid Shopping ads and to free product listings alike.
Two edge cases are worth naming. Portable structures that are sold and shipped as goods are not "non-portable homes", so a retailer of sheds or garden buildings appears to sit in ordinary product territory. And the policy's vehicles section only admits cars, trucks and RVs through a separate vehicle ads format, which is not available for property. For an agent, brokerage or developer, Shopping is simply not a route.
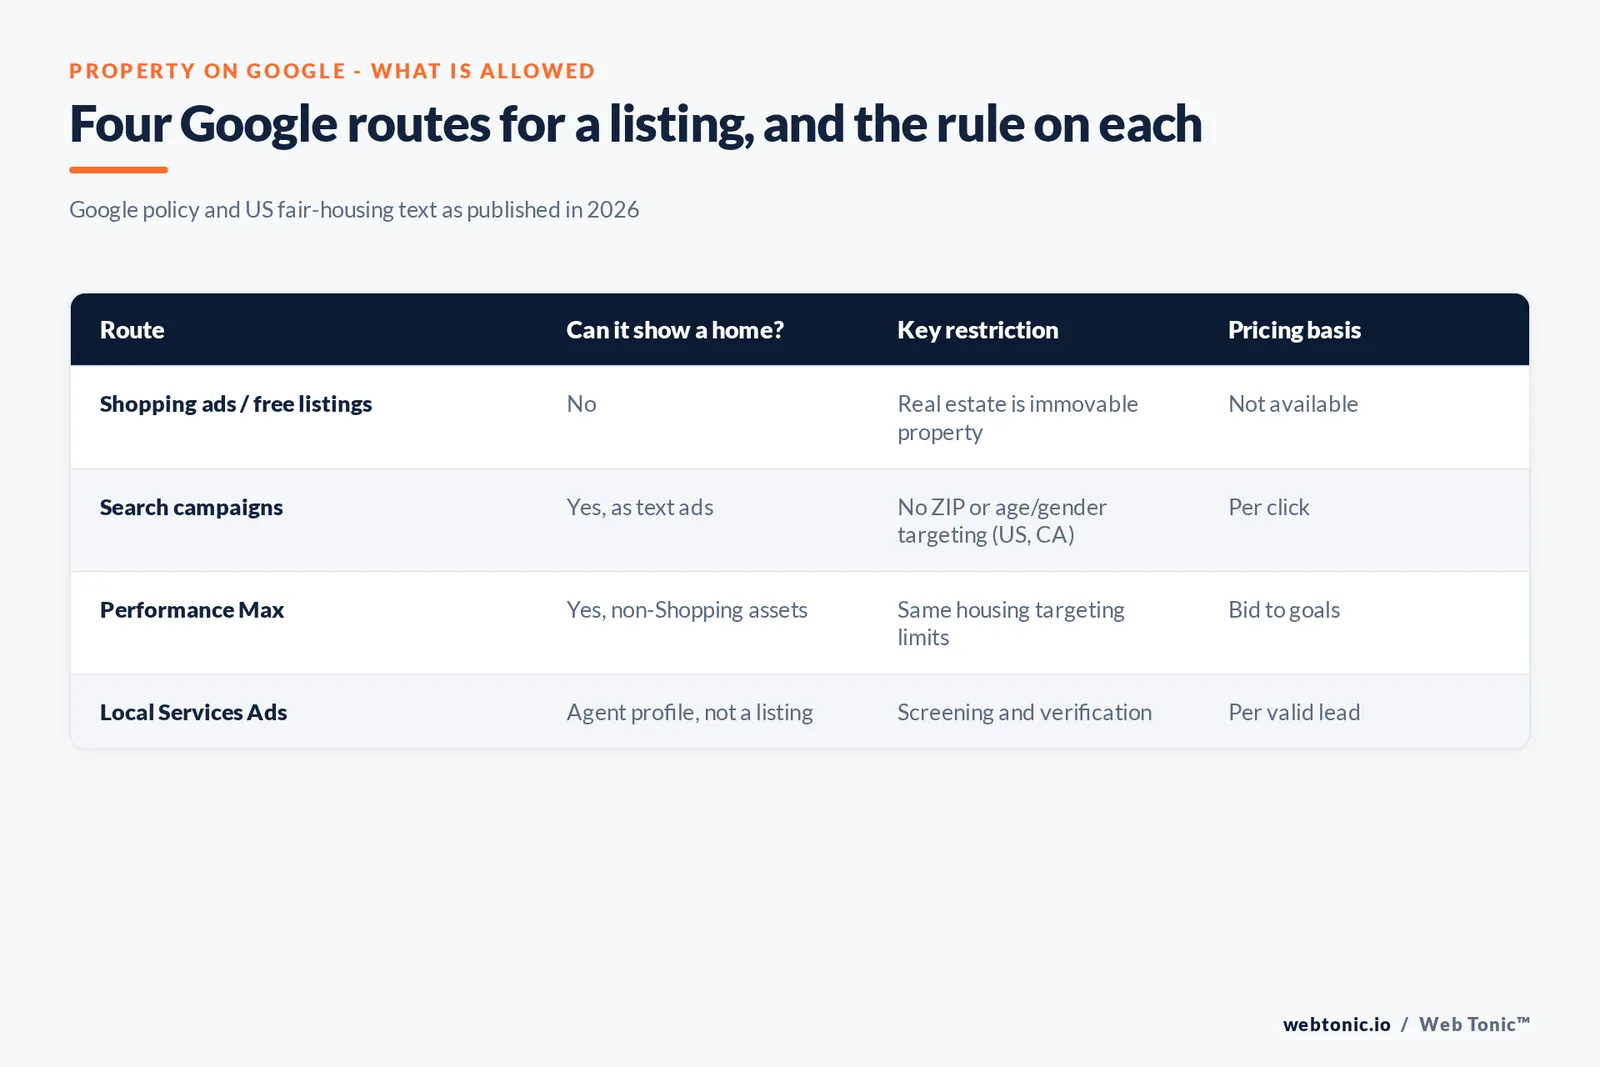
| Google route | Can it promote a listing? | Restriction that applies | Source |
|---|---|---|---|
| Shopping ads | No | Immovable property unsupported | Merchant Center policy |
| Free product listings | No | Same policy | Free listings help |
| Search campaigns | Yes, as text ads | Housing targeting limits (US, Canada) | Personalized ads policy |
| Performance Max without a feed | Yes, with assets | Housing targeting limits | Performance Max help |
| Local Services Ads | Promotes the agent, not a home | Category screening | LSA categories |
The housing restrictions on every other route
Google's Personalized advertising policy lists housing alongside employment and consumer finance. Its notes state that "certain demographics (age, gender, marital status, parental status) may not be used to target Housing, Employment, and Consumer Finance Ads in the United States and Canada" and that "ZIP code location targeting cannot be used" for them. Advertiser-curated audiences are also restricted for sensitive categories. For a neighbourhood-focused agent, that removes the most obvious targeting lever and pushes geography to city or radius level.
The legal backdrop is federal. 24 CFR 100.75 makes it unlawful to publish "any notice, statement or advertisement with respect to the sale or rental of a dwelling which indicates any preference, limitation or discrimination because of race, color, religion, sex, handicap, familial status, or national origin".
| Targeting feature | Housing ads, US and Canada | Policy wording |
|---|---|---|
| Age, gender targeting | Not allowed | Certain demographics may not be used |
| Marital or parental status | Not allowed | Certain demographics may not be used |
| ZIP code location targeting | Not allowed | Cannot be used for housing ads |
| City, region or radius targeting | Allowed | Only ZIP is named as barred |
| Advertiser-curated audiences | Restricted | Not usable for sensitive categories |
| Predefined Google audiences | Allowed | Sensitive signals excluded |
What the 2026 market looks like
NAR's August 2026 existing-home sales report shows sales down 2.0% on the month to a seasonally adjusted annual rate of 3.98 million. Inventory rose to 1.62 million units, equal to 4.9 months of supply - its highest level in over ten years - and the first time since November 2019 that inventory exceeded 1.6 million. The median price reached USD 429,100, up 1.6% from a year earlier and the 38th consecutive month of annual gains. First-time buyers took 30% of sales, cash buyers 27%, and the median property sat 31 days on the market.
More inventory and longer supply mean more listings competing for the same buyers - a marketing problem for sellers' agents, but one Google solves with Search and Local Services, not with a product feed.
| NAR metric, August 2026 | Value | Change noted by NAR |
|---|---|---|
| Existing-home sales (SAAR) | 3.98 million | -2.0% month over month |
| Median existing-home price | USD 429,100 | +1.6% year over year |
| Total inventory | 1.62 million units | Above 1.6 million for the first time since Nov 2019 |
| Months of supply | 4.9 | Highest in over ten years |
| First-time buyer share | 30% | Up from 28% a year earlier |
| All-cash sales | 27% | - |
Regional spread: why geography is the real lever
With ZIP targeting off the table, region and city become the main budget levers, and NAR's August data shows how far apart the regions are. The Northeast ran at an annual rate of 480,000 sales with a median price of USD 556,900, up 4.3%; the West at 720,000 with the highest median, USD 619,100, down 0.2%. The South is the volume market at 1.84 million, unchanged on the year, with a median of USD 366,500, and the Midwest ran at 940,000 at USD 340,400. Single-family homes sold at 3.62 million with a median of USD 434,800; condos and co-ops at 360,000 with a median of USD 371,600.
For a brokerage covering several metros, those gaps argue for separate Search campaigns and budgets per market rather than one national campaign: the price of the product, and therefore the value of a lead, differs by more than 80% between the Midwest and the West. Individual investors and second-home buyers were 15% of August transactions, down from 21% a year earlier, which also changes which searches are worth buying.
| Region, August 2026 | Annual sales rate | Median price | Price change YoY |
|---|---|---|---|
| Northeast | 480,000 | USD 556,900 | +4.3% |
| Midwest | 940,000 | USD 340,400 | +3.3% |
| South | 1.84 million | USD 366,500 | +0.7% |
| West | 720,000 | USD 619,100 | -0.2% |
| Single-family (national) | 3.62 million | USD 434,800 | +1.7% |
The annual buyer profile
NAR's 2025 Profile of Home Buyers and Sellers puts first-time buyers at a historic low of 21% of annual purchases, with the median first-time buyer age rising to 40. The monthly 30% and the annual 21% measure different things - a single month of existing-home sales versus a year of buyer surveys - and should not be compared as a trend. Both describe an older, more equity-rich buyer pool, which suits Search campaigns built around specific property needs rather than broad demographic targeting that the housing policy does not allow anyway.
What agents actually spend on leads
For an agent-level budget, the most useful published figure is self-reported. NAR's 2025 REALTORS Technology Survey found 24% of respondents spent less than USD 50 a month on lead generation over the past year and 27% spent USD 50 to 250; 15% spent USD 251 to 500 and 19% more than USD 500, with 15% not applicable. Separately, 34% spent USD 50 to 250 a month on technology for their business. Social media remained the top lead-generating technology.
| Monthly lead-generation spend (NAR 2025) | Share of Realtors | Google route it can fund |
|---|---|---|
| Less than USD 50 | 24% | Free Business Profile, organic |
| USD 50-250 | 27% | Small Search campaign or a few LSA leads |
| USD 251-500 | 15% | Search plus Local Services Ads |
| More than USD 500 | 19% | Search, LSA and Performance Max |
| Not applicable | 15% | Brokerage-funded marketing |
Local Services Ads for agents
Google's US Local Services category list includes Real estate services, and Google's Local Services page lists real estate agent among professional services. An ad promotes the agent's verified profile rather than a property, and you are charged per valid lead, with a monthly maximum derived from an average weekly budget. Google's transition notice says Local Services campaigns are migrating to a Performance Max type with pay-per-lead goals, beginning in August 2026 with home services and reaching remaining categories by 2027.
Search and Performance Max budgets
For click-based formats Google's budget rules apply: a campaign can spend up to 2 times its average daily budget in a day, with a monthly cap of 30.4 times that budget, and Google's Performance Max guidance advises a daily budget of at least 3 times the target CPA. Performance Max can run without a product feed, serving text, images and video across Search, YouTube, Display, Discover, Gmail and Maps. See our Google Ads cost guide for click prices.
Cross-industry context, labelled as such
There is no published Shopping benchmark for real estate because the format is closed to it, and we do not estimate property click-through or conversion rates. Cross-industry, the IAB/PwC FY 2025 report puts US search revenue at USD 114.2 billion, 38.8% of internet ad revenue, and Tinuiti's Q4 2025 report (vendor client data) recorded Shopping spend up 16% with CPC down 1% - numbers that describe retail product advertisers, not property. US e-commerce was 17.1% of retail sales in Q2 2026 per the Census Bureau; homes are not part of that retail total either.
A compliant Google plan for a brokerage
- Do not upload listings to Merchant Center; they are unsupported content.
- Declare housing ads so targeting defaults match Google's US and Canada restrictions.
- Use city or radius geography instead of ZIP codes.
- Apply for Local Services Ads under Real estate services for agent-level leads.
- Check every ad and landing page against 24 CFR 100.75 language rules.
For video budgets see our real estate CTV data, and our data intelligence team can track lead source through to closing.
Frequently Asked Questions
Can a real estate listing appear as a Google Shopping ad?
No. Google's Unsupported Shopping content policy lists immovable property - property not physically movable or which cannot be moved without being altered or destroyed - as not allowed, with real estate, non-portable homes and plots of land as examples. Brokerage services are also excluded as services.
What Google ad options exist for property listings?
Search campaigns, Performance Max campaigns built on text, image and video assets rather than a product feed, and Local Services Ads, where Real estate services appears on Google's US category list. Each is subject to Google's housing targeting restrictions in the United States and Canada.
What targeting restrictions apply to housing ads on Google?
Google's Personalized advertising policy says age, gender, marital status and parental status may not be used to target housing ads in the United States and Canada, and that ZIP code location targeting cannot be used for them either.
How much do Realtors spend on lead generation?
NAR's 2025 Technology Survey found 24% of respondents spent less than USD 50 a month on lead generation, 27% spent USD 50 to 250, 15% spent USD 251 to 500 and 19% spent more than USD 500, with 15% answering not applicable.
How active is the US housing market in 2026?
NAR reported existing-home sales at a seasonally adjusted annual rate of 3.98 million in August 2026, a median price of USD 429,100, 4.9 months of supply, 31 median days on market and first-time buyers at 30% of sales.
Sources
Google Merchant Center - Unsupported Shopping content
Google - Restricted targeting in personalized advertising
Google Local Services Ads - Categories (US)
Google - Local Services Ads
NAR - Existing-home sales, August 2026
NAR - 2025 REALTORS Technology Survey
NAR - 2025 Profile of Home Buyers and Sellers
eCFR - 24 CFR 100.75
Tinuiti - Digital Ads Benchmark Report Q4 2025
IAB/PwC - Internet Advertising Revenue Report FY 2025
US Census Bureau - Quarterly Retail E-Commerce