



Table of contents
Quick commerce reached USD 161.93 billion in 2026, up from USD 129.73 billion a year earlier, while the delivery it is displacing still moves on a completely different cost curve. This page puts the two models' 2026 numbers side by side, not as a trend piece but as an operating comparison.
Key Takeaways
- Quick commerce hit USD 161.93 billion in 2026, up from USD 129.73 billion in 2025.
- That is 24.8% year-on-year growth, per The Business Research Company.
- The market is forecast to reach USD 358.16 billion by 2030.
- A separate 2026 estimate puts the market at USD 213.59 billion, growing 20.62% through 2031.
- Asia-Pacific is the fastest-growing region in both major 2026 forecasts.
- North America holds the largest current share, around 33.43% per Fortune Business Insights.
- Food and groceries will reach USD 201.66 billion by 2030 inside quick commerce.
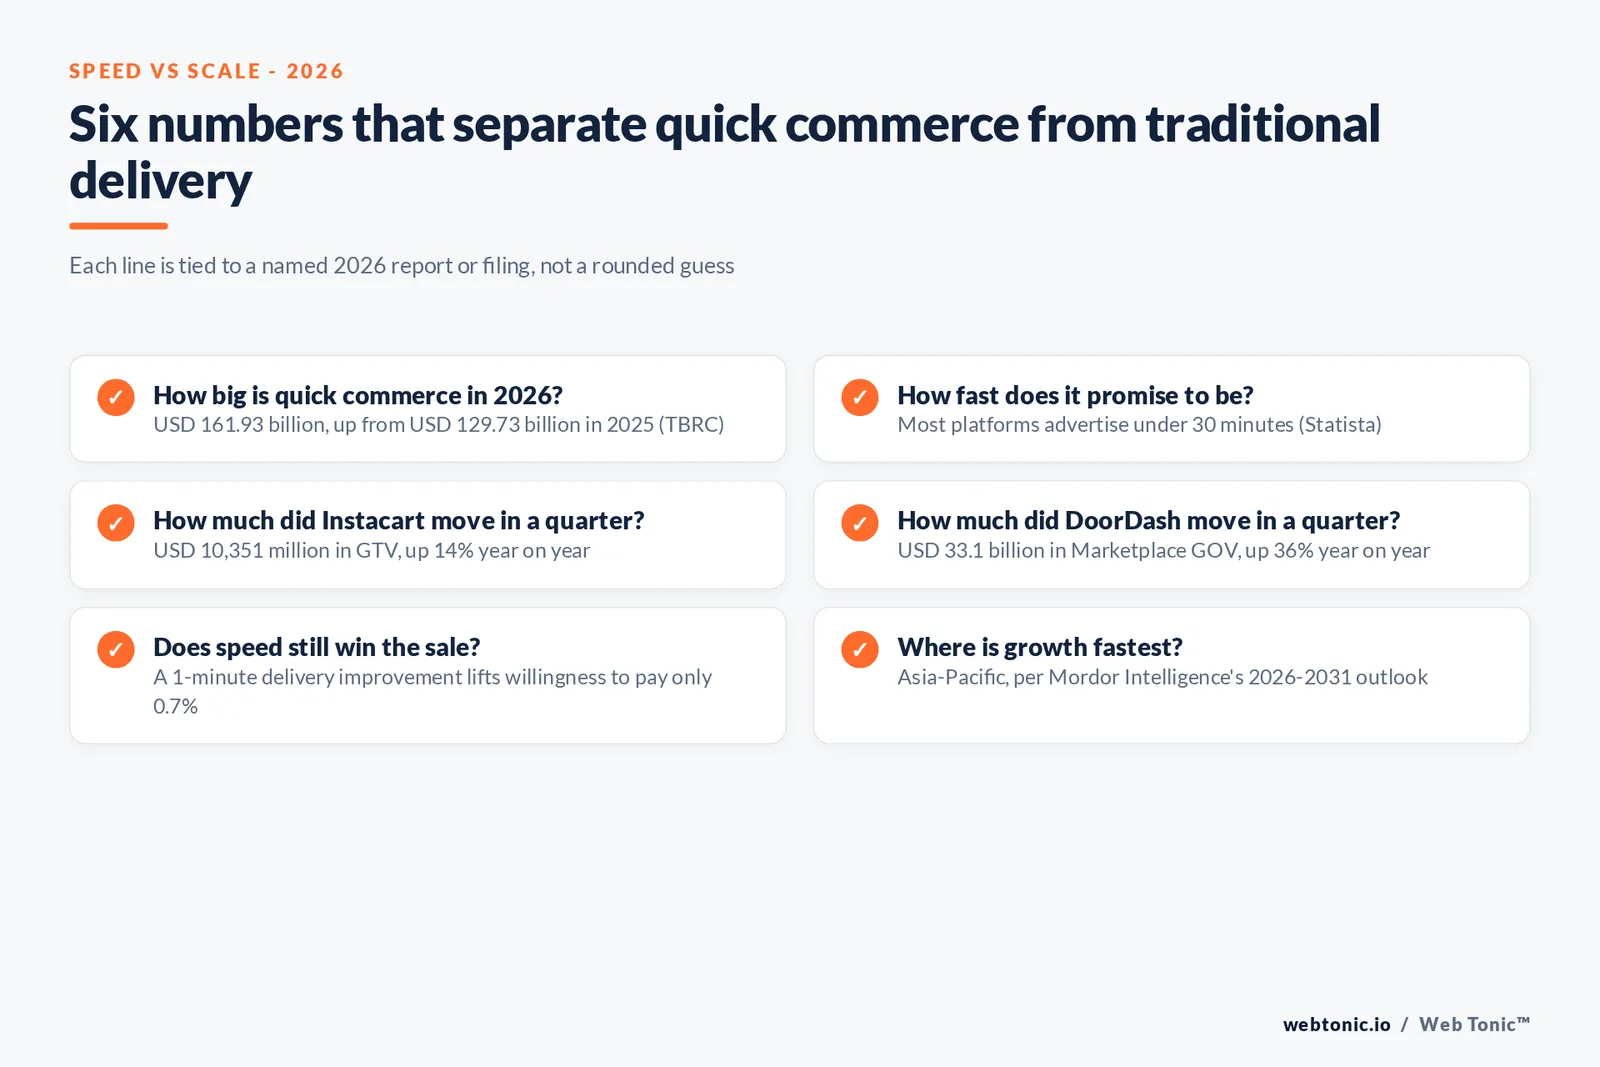
- Instacart's Q2 2026 GTV was USD 10,351 million, up 14% year on year.
- DoorDash's Q2 2026 Marketplace GOV was USD 33.1 billion, up 36% year on year.
- DoorDash orders grew 27% year on year in the same quarter.
- Instacart processed 90.3 million orders in Q2 2026, up 9%.
- A 1-minute delivery improvement lifts willingness to pay by only 0.7%.
- Delivery speed has fallen to roughly fifth place among what shoppers value most.
- Instacart's advertising revenue grew 16% year on year to USD 297 million.
- Instacart's free cash flow grew 156% year on year to USD 480 million.
The size gap in one number
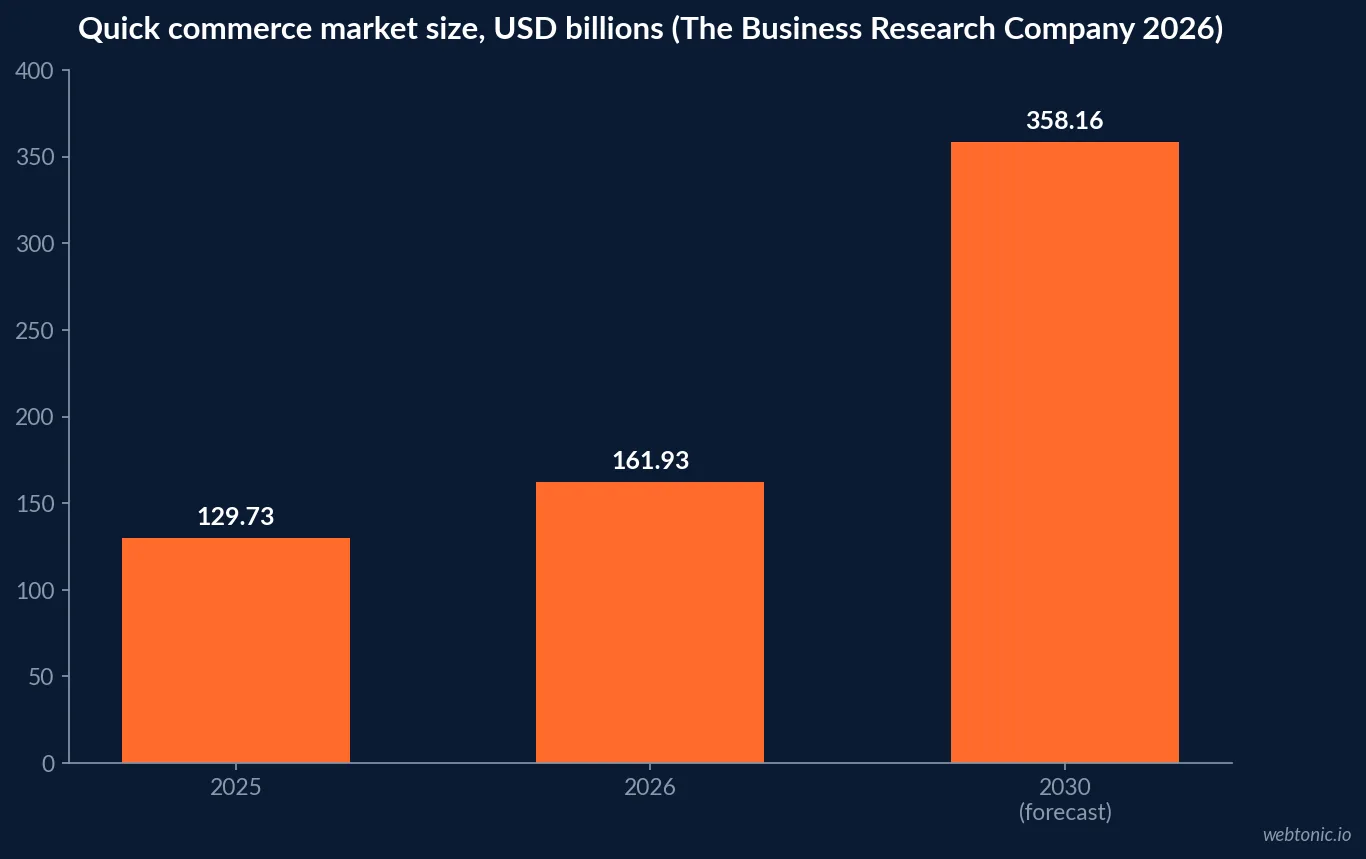
Quick commerce is still a fraction of total e-commerce, but it is not a niche any longer. The Business Research Company's 2026 report puts the market at USD 161.93 billion this year, up from USD 129.73 billion in 2025, a 24.8% compound annual growth rate. Growth is forecast to ease slightly to 22.0% through 2030, when the market is projected to reach USD 358.16 billion. A separate estimate from Mordor Intelligence puts the 2026 market at USD 213.59 billion, growing at 20.62% through 2031 — the two firms disagree on the base number but agree on the direction and the region driving it.
| Market size estimate (2026) | Figure | Growth rate | Source |
|---|---|---|---|
| Quick commerce, 2025 actual | USD 129.73 billion | — | The Business Research Company |
| Quick commerce, 2026 | USD 161.93 billion | 24.8% YoY | The Business Research Company |
| Quick commerce, 2030 forecast | USD 358.16 billion | 22.0% CAGR | The Business Research Company |
| Quick commerce, 2026 (alt. estimate) | USD 213.59 billion | 20.62% CAGR to 2031 | Mordor Intelligence |
| Quick commerce, North America share | 33.43% | Largest current region | Fortune Business Insights |
Who is actually moving the volume
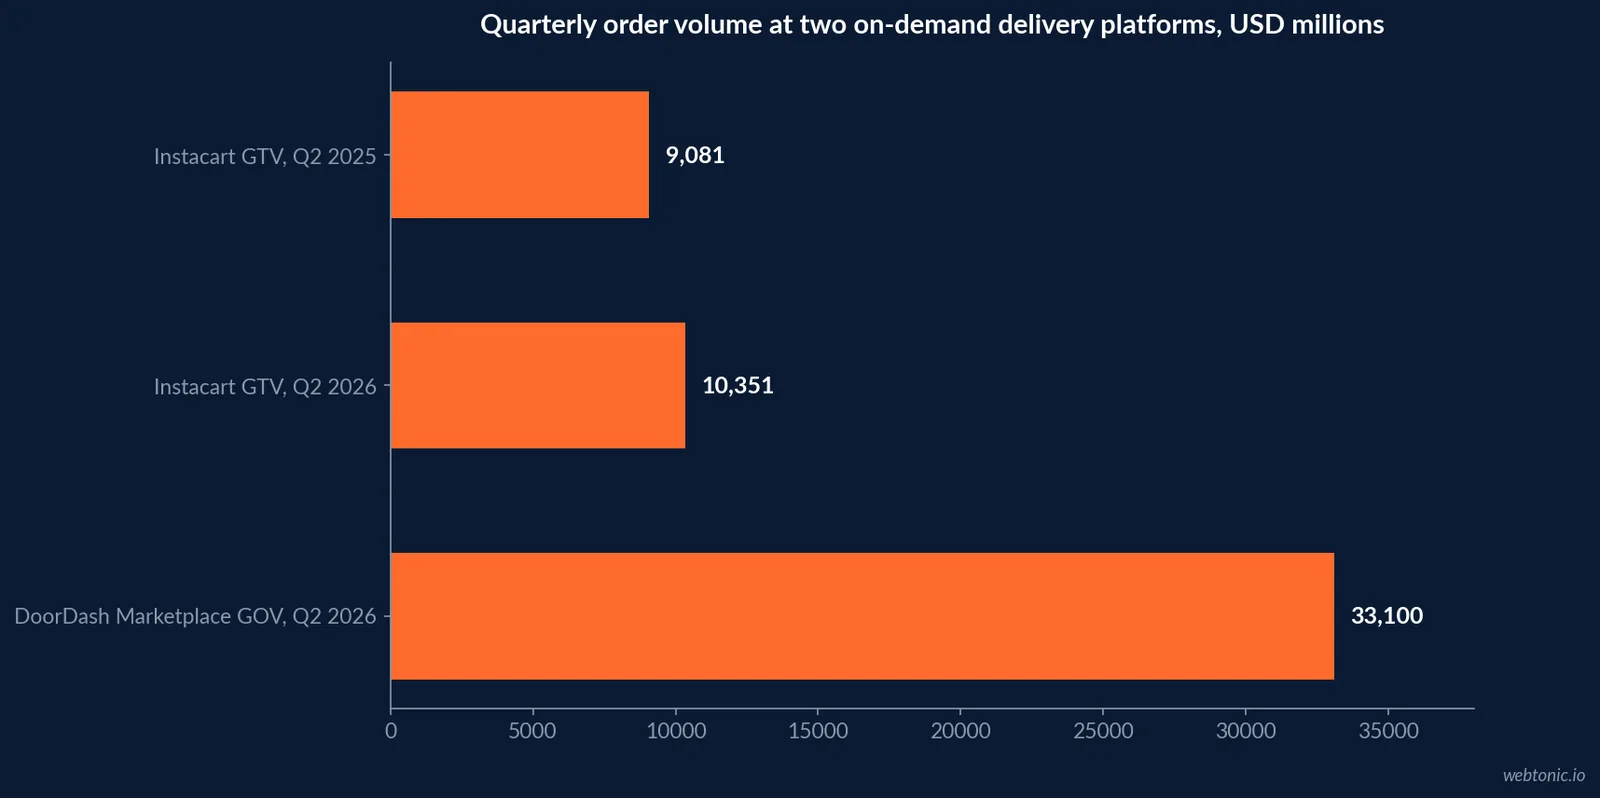
The clearest read on real order economics comes from the platforms' own filings rather than market-size estimates. Instacart's Q2 2026 results reported gross transaction value of USD 10,351 million, up 14% year on year, on 90.3 million orders — a model that blends traditional grocery delivery with faster fulfilment options. DoorDash, which runs both restaurant delivery and an expanding quick-commerce grocery line, reported Marketplace gross order value of USD 33.1 billion for the same quarter, up 36% year on year including the Deliveroo acquisition, on orders up 27%.
The scale difference between the two platforms is a reminder that "delivery" now spans wildly different unit economics depending on category mix, not just speed.
| Platform metric, Q2 2026 | Figure | YoY change | Source |
|---|---|---|---|
| Instacart GTV | USD 10,351 million | +14% | Instacart Q2 2026 results |
| Instacart orders | 90.3 million | +9% | Instacart Q2 2026 results |
| Instacart advertising revenue | USD 297 million | +16% | Instacart Q2 2026 results |
| Instacart free cash flow | USD 480 million | +156% | Instacart Q2 2026 results |
| DoorDash Marketplace GOV | USD 33.1 billion | +36% | DoorDash Q2 2026 results |
| DoorDash total orders | 970 million | +27% | DoorDash Q2 2026 results |
Does speed still sell?
The category was built on the promise of delivery in 10 to 30 minutes, but the evidence that speed alone still commands a premium is thinning. McKinsey's package-delivery survey work found delivery speed has fallen out of the top four things online shoppers say they value, well behind cost predictability and reliable tracking. Separate 2026 market-intelligence tracking on delivery economics found that each additional minute shaved off delivery time now lifts a customer's willingness to pay by only about 0.7% — a small enough number that several operators have started marketing reliability and assortment instead of pure speed.
That does not make speed irrelevant. It makes it a qualifying feature rather than the entire pitch, which changes what an operator should actually be optimising a marketing budget around.
| Consumer behaviour signal (2026) | Figure | Source | What it means for the category |
|---|---|---|---|
| Willingness-to-pay lift per 1-minute faster delivery | ~0.7% | 2026 delivery market-intelligence tracking | Speed alone is a weak differentiator now |
| Delivery speed's rank among shopper priorities | Fell to roughly 5th | McKinsey delivery preference survey | Reliability and tracking rank higher |
| Advertised delivery window, most platforms | Under 30 minutes | Statista quick commerce topic page | Still the category's core promise |
| Typical order fulfilment radius | Dark store / micro-warehouse | Statista quick commerce topic page | Different cost base than regional DCs |
Where the categories will keep diverging
Fortune Business Insights puts quick commerce at USD 199.92 billion in 2026 on its own methodology, growing to USD 385.36 billion by 2034 at an 8.55% CAGR, with North America holding 33.43% of the market today even as Asia-Pacific grows fastest. That regional split matters for anyone benchmarking against a US or European delivery business: the category's headline growth numbers are being pulled by markets most Western operators are not competing in directly.
Food and groceries remain the anchor product category, with The Business Research Company projecting the segment alone to reach USD 201.66 billion by 2030, ahead of personal care items at USD 54.08 billion and household products at USD 43.16 billion.
| Regional / category split (2026) | Figure | Source | Note |
|---|---|---|---|
| North America market share, current | 33.43% | Fortune Business Insights | Largest region today |
| Fastest-growing region | Asia-Pacific | Fortune Business Insights / Mordor Intelligence | Both major forecasts agree |
| Food and groceries, 2030 forecast | USD 201.66 billion | The Business Research Company | Anchor product category |
| Personal care items, 2030 forecast | USD 54.08 billion | The Business Research Company | Second-largest segment |
| Household products, 2030 forecast | USD 43.16 billion | The Business Research Company | Growing dark-store assortment |
What this means for a delivery or grocery marketing budget
The practical takeaway is not "go quick commerce" or "stay traditional." It is that the two models now compete on different variables — assortment and reliability for quick commerce, cost efficiency and predictability for traditional delivery — and a marketing plan built around 2022-era speed claims is arguing a point shoppers have already stopped prioritising as highly. Our data and analytics practice builds the cohort-level view that shows which of those variables is actually moving conversion for a specific catalogue, our team overview covers how we structure that work for retail and logistics clients end to end, and our performance creative practice adapts the messaging once the data points one way. Talk to us if a delivery brand needs that comparison run against its own numbers.
The traditional side is not standing still either
Traditional grocery e-commerce, the format quick commerce is often framed as replacing, is itself accelerating. Brick Meets Click's 2026 tracking recorded US eGrocery sales up nearly 25% year over year in August 2026 and 21.5% in July, with December 2025 eGrocery sales hitting USD 12.7 billion for the month and online's share of total grocery spending reaching 19%, up 430 basis points from the year before. That growth is split across two different fulfilment models — delivery and pickup — which is why Brick Meets Click frames 2026 as a "dueling fulfilment innovations" story rather than a single quick-commerce narrative.
The practical read: traditional grocery e-commerce is not losing share to quick commerce so much as both formats are pulling share from in-store shopping at the same time, at different points in the basket.
| Traditional eGrocery signal (2026) | Figure | Source | Reading |
|---|---|---|---|
| eGrocery sales growth, August 2026 | ~25% YoY | Brick Meets Click | Traditional online grocery is still accelerating |
| eGrocery sales growth, July 2026 | 21.5% YoY | Brick Meets Click | Driven by order frequency, not just new users |
| eGrocery sales, December 2025 | USD 12.7 billion | Brick Meets Click | Record month for the format |
| Online share of total grocery spend | 19%, +430 bps YoY | Brick Meets Click | Both delivery and quick commerce are gaining on in-store |
Frequently Asked Questions
What counts as quick commerce versus traditional delivery in 2026?
Quick commerce covers orders fulfilled from a nearby dark store or micro-warehouse in under an hour, typically 10 to 30 minutes, using app-based dispatch. Traditional e-commerce delivery relies on regional distribution centres and multi-day shipping cycles. The Business Research Company's 2026 market report sizes quick commerce at USD 161.93 billion this year against a broader e-commerce logistics market that is an order of magnitude larger, which is the core structural difference: quick commerce trades warehouse efficiency for delivery speed.
How fast is quick commerce actually growing in 2026?
The Business Research Company puts the 2025-to-2026 jump at USD 129.73 billion to USD 161.93 billion, a 24.8% compound annual growth rate, before slowing to a still-fast 22.0% CAGR through 2030 when the market is forecast to reach USD 358.16 billion. Mordor Intelligence's separate 2026 estimate puts the current market at USD 213.59 billion with 20.62% growth through 2031, and both agree Asia-Pacific is the fastest-growing region.
Do consumers still pay more for faster delivery in 2026?
Less than they used to. Delivery speed has fallen out of the top four things online shoppers say they value about deliveries, behind cost, reliability and tracking, according to McKinsey survey work on package delivery preferences. Separate 2026 market-intelligence tracking found each one-minute improvement in delivery time now lifts a customer's willingness to pay by only about 0.7%, which is why several operators are shifting their pitch from raw speed to reliability.
How do quick-commerce order volumes compare to traditional delivery platforms?
Instacart, whose grocery model sits closer to traditional next-day and same-day delivery, reported gross transaction value of USD 10,351 million for the second quarter of 2026, up 14% year on year, on 90.3 million orders. DoorDash, which runs both traditional restaurant delivery and a growing quick-commerce grocery business, reported Marketplace gross order value of USD 33.1 billion for the same quarter, up 36% year on year including its Deliveroo acquisition.
Which product categories are driving quick commerce growth?
Food and groceries dominate: The Business Research Company's 2026 report expects the category to reach USD 201.66 billion by 2030, with personal care items at USD 54.08 billion and household products at USD 43.16 billion. That ordering matches how the format was built, around perishable and urgent-need purchases that traditional multi-day shipping cannot serve at all.
Sources
The Business Research Company — Quick Commerce Global Market Report 2026
Mordor Intelligence — Quick Commerce Market Size & Share, 2026
Fortune Business Insights — Quick Commerce Market Size, Share & Forecast
Instacart (Maplebear Inc.) — Second Quarter 2026 Financial Results
DoorDash, Inc. — Second Quarter 2026 Financial Results
Statista — Quick Commerce, Statistics & Facts
Brick Meets Click — U.S. eGrocery Hyper-Growth Trend, 2026


