



Table of contents
A validated coupon code converts to a redemption about 15% of the time on average, but the real spread runs from under 9% to nearly 18% depending on sector and discount depth - and pairing that redemption math with 2026 click and lead-cost benchmarks is what turns a promotion from a guess into a plan.
Key Takeaways
- 15.29% of validated coupon codes convert to a redemption across 90 merchants in H1 2026, per Uniqodo.
- Retail and fashion convert at 17.81%, more than double telco's 8.04%.
- Shallow retail discounts (≤10%) convert at 22.30%, beating 20%-off codes at 9.08%.
- 44.1% of non-batch redemptions happen within the first hour of a code's issue.
- Coupon distribution fell to 34 billion in 2025 from 53.1 billion the year before, per Inmar.
- Total redemption volume held far steadier than distribution volume over the same period.
- Klaviyo brands generated over USD 1 billion in Black Friday 2025 sales alone.
- Same-site BFCM 2025 sales rose 11% YoY even as average discount rates fell.
- Average discount rates fell to 26.2% in 2025 from 29.6% the year prior.
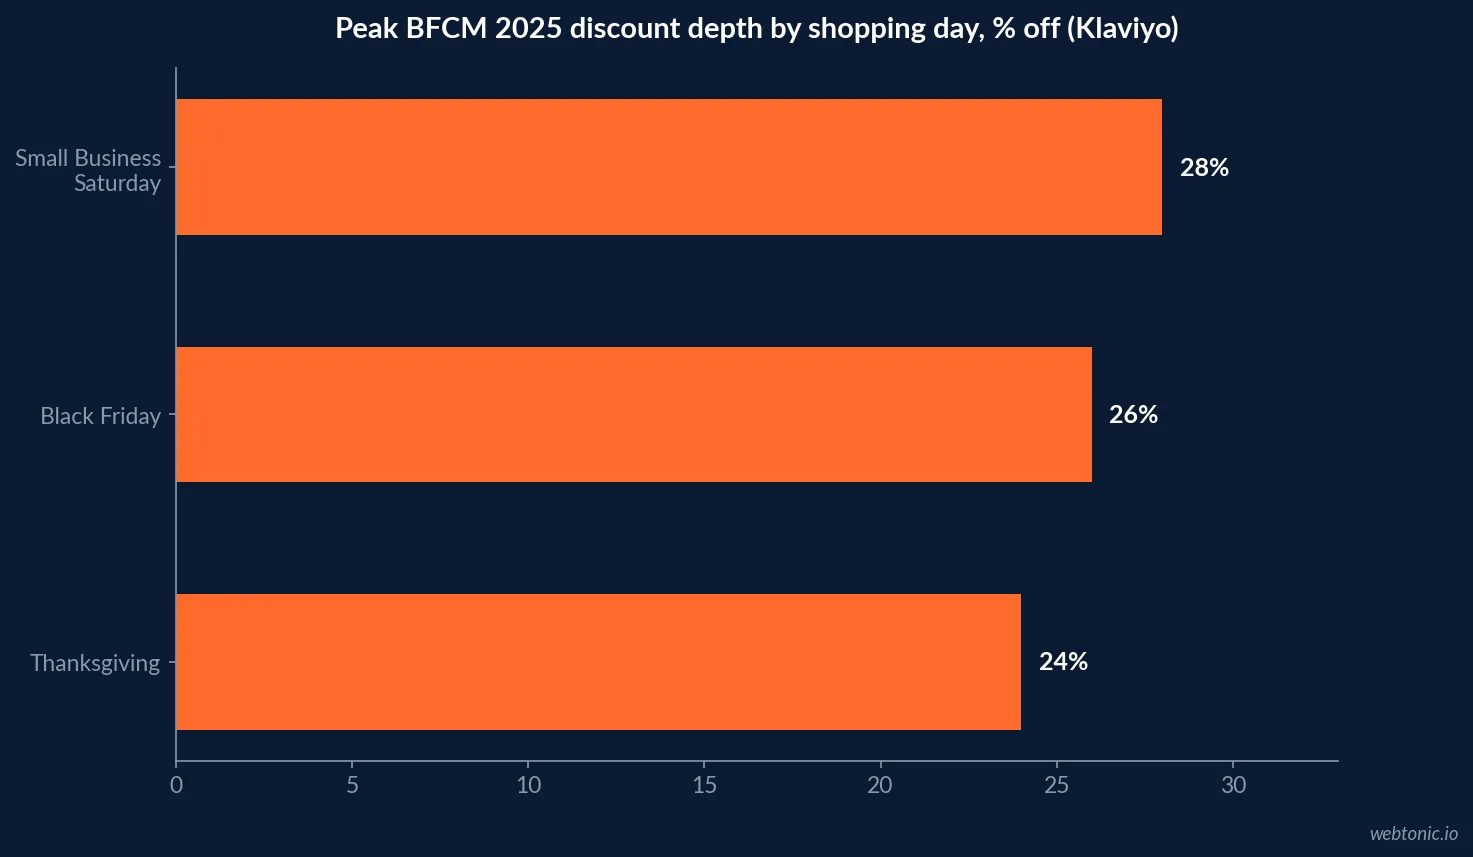
- Small Business Saturday ran the deepest discounts, around 28%, ahead of Black Friday's 26%.
- Repeat purchases rose 14% YoY versus 9% for new buyers over BFCM 2025.
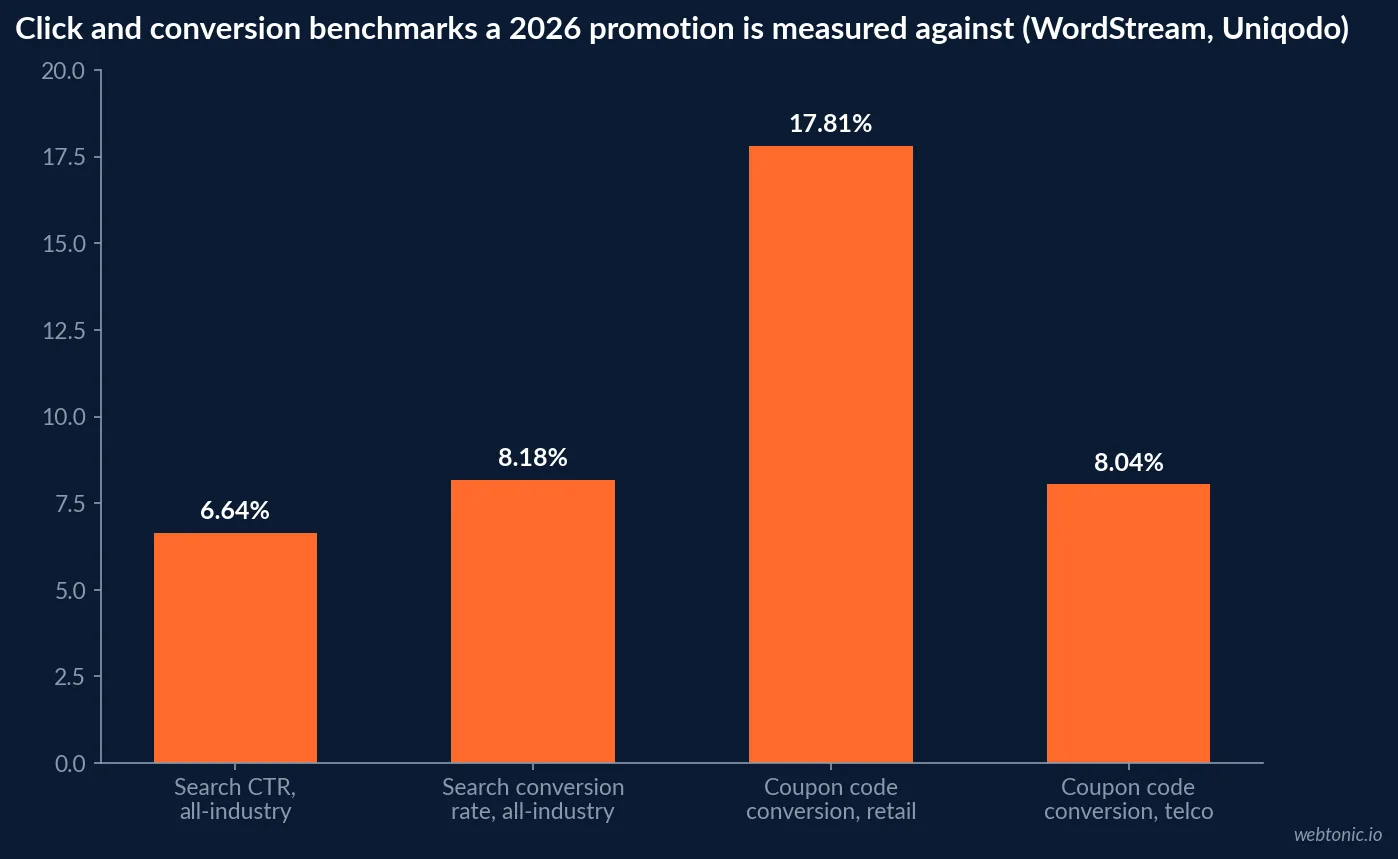
- All-industry search CTR averages 6.64%, per WordStream's 2026 benchmarks.
- All-industry search conversion rate averages 8.18%, ranging 2.64% to 16.22% by category.
- Average cost per lead sits at USD 66.69, ranging USD 26.84 to USD 131.63 by category.
The redemption math a promotion is actually built on
The most granular 2026 data on coupon performance comes from Uniqodo's analysis of 51.6 million unique coupon codes issued across 90 merchants and 4,124 promotions between January and June 2026, covering travel, retail and telco. Of 11.7 million validations, 1.79 million redemptions followed - a 15.29% validated-to-redeemed conversion rate overall. That average conceals a wide sector spread: retail and fashion converted at 17.81%, more than double telco's 8.04%, with travel in between at 13.74%.
Timing matters as much as sector. 44.1% of non-batch redemptions occurred within the first hour of a code's issue, based on 572,433 redemptions in the dataset, and validated-to-redeemed conversion climbed from 12.52% in January to 17.40% in June - evidence that a promotion's redemption window is short and that seasonal timing shifts the baseline conversion rate on its own, independent of the offer.
| Sector | Validated-to-redeemed conversion | Sample basis | Source |
|---|---|---|---|
| Retail / fashion | 17.81% | 90 merchants, 4,124 promotions | Uniqodo, H1 2026 |
| Travel | 13.74% | 90 merchants, 4,124 promotions | Uniqodo, H1 2026 |
| Telco | 8.04% | 90 merchants, 4,124 promotions | Uniqodo, H1 2026 |
| All sectors, blended | 15.29% | 51.6M codes, 11.7M validations | Uniqodo, H1 2026 |
Does a bigger discount actually convert more people?
Not reliably, and the retail data runs backwards from the intuitive answer. Uniqodo found retail discounts of 10% or less converted 22.30% of validated codes, nearly two and a half times the 9.08% conversion rate seen on 20%-off codes - deeper discounts pulled in less-qualified traffic in that dataset rather than more. In travel, the pattern flips on value instead of rate: 15% discounts returned the highest average order value at GBP 2,778, while discounts of 30% or more converted at 71.77% but returned only GBP 234 per redemption - high conversion, low value, the opposite trade-off from retail.
Klaviyo's analysis of Black Friday/Cyber Monday 2025 across its brand base backs the same conclusion at the macro level: brands offering the smallest discounts saw some of the healthiest sales growth, driven by personalization, lifecycle timing and AI-powered recommendations rather than markdown depth. Same-site sales rose 11% year over year and Klaviyo brands crossed USD 1 billion in Black Friday sales for the first time, even as the average discount rate fell to 26.2% from 29.6% the year before.
| Discount depth | Best result observed | Worst trade-off | Source |
|---|---|---|---|
| ≤10% off, retail | 22.30% conversion | Lower perceived urgency | Uniqodo H1 2026 |
| 20% off, retail | 9.08% conversion | Less-qualified traffic drawn in | Uniqodo H1 2026 |
| 15% off, travel | GBP 2,778 average order value | Lower redemption volume | Uniqodo H1 2026 |
| 30%+ off, travel | 71.77% conversion | GBP 234 average order value | Uniqodo H1 2026 |
| 20-29% off, low-AOV brands | Strongest open/conversion rates | N/A | Klaviyo BFCM 2025 |
| 30-39% off, mid/high-AOV brands | Strongest open/conversion rates | N/A | Klaviyo BFCM 2025 |
Which day actually discounts the deepest
Klaviyo's BFCM 2025 data ranks the peak discount days precisely: Small Business Saturday carried the deepest discounts of the season at roughly 28%, ahead of Black Friday at 26% and Thanksgiving at 24%. Average selling price still rose 4.8% year over year across the weekend, meaning a smaller headline discount on a higher base price still delivered meaningful savings to the shopper. Repeat purchases climbed nearly 14% year over year, well ahead of the 9% lift among new buyers - a signal that promotions are increasingly a retention tool for brands that already have a list, not just an acquisition lever.
Zooming out to the industry level, Inmar Intelligence's 2026 Promotion Industry Analysis found overall coupon distribution fell sharply to 34 billion in 2025 from 53.1 billion the year prior, while total redemption volume held far steadier - a shift the report frames as a move away from mass-scale distribution toward precision targeting, producing smaller volumes but stronger per-promotion engagement.
| Metric (2026 data) | Figure | Source | Direction vs. prior year |
|---|---|---|---|
| Total coupon distribution | 34 billion | Inmar Intelligence | Down from 53.1 billion |
| Total coupon redemption | 0.81 billion | Inmar Intelligence | Down slightly from 0.87 billion |
| BFCM 2025 same-site sales | +11% YoY | Klaviyo | Up despite lower discounts |
| Average BFCM discount rate | 26.2% | Klaviyo | Down from 29.6% |
| Repeat purchase growth, BFCM 2025 | +14% YoY | Klaviyo | Up, ahead of new-buyer growth |
What a promotion costs once it runs as a paid campaign
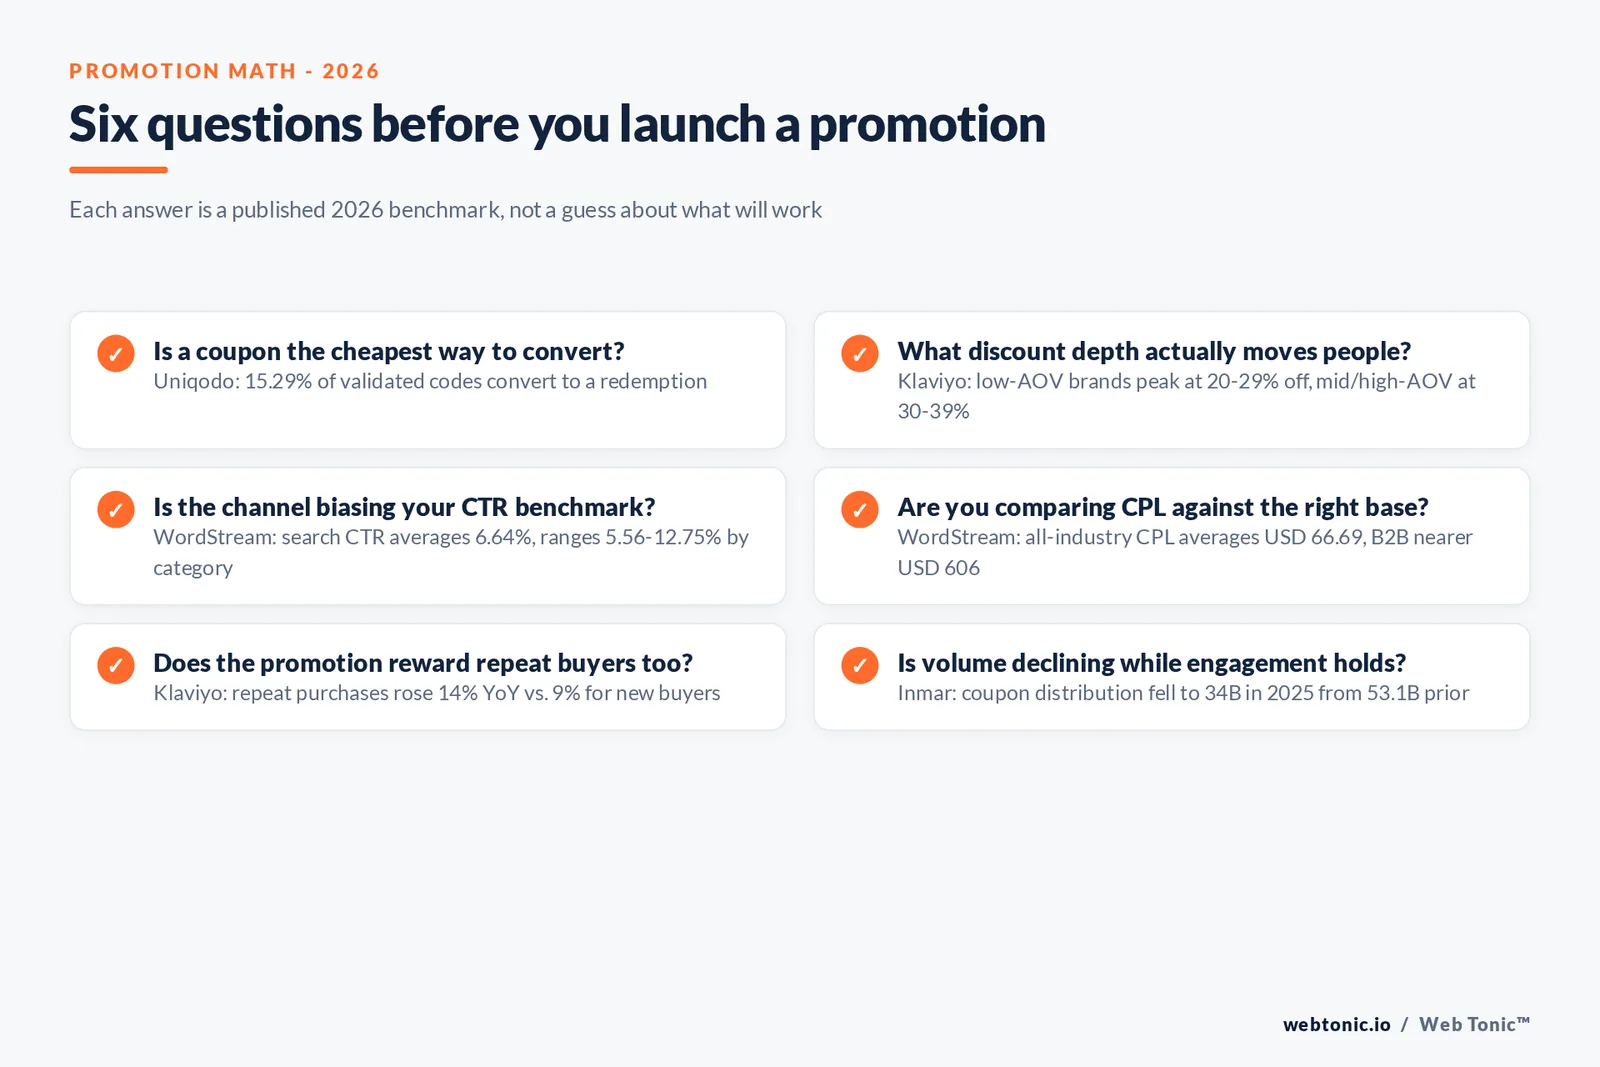
Most promotions run through a paid channel to reach an audience, and that channel has its own cost structure independent of the offer. WordStream's 2026 Google Ads Benchmarks report, drawn from over 13,000 US search campaigns across 23 industries between April 2025 and March 2026, puts the all-industry average click-through rate at 6.64% (ranging 5.56% to 12.75% across categories), average conversion rate at 8.18% (ranging 2.64% to 16.22%), and average cost per lead at USD 66.69 (ranging USD 26.84 to USD 131.63). Managed B2B client data compiled separately by performance agencies puts B2B cost per conversion far higher, often several times the all-industry figure - a reminder that a promotion's CPL target should be set against its own category's benchmark, not a blended average that mixes consumer and B2B funnels.
Promodo's 2026 conversion rate benchmarks add the device layer most CPL discussions skip: ecommerce conversion rates vary not just by industry and channel but by device mix, which means a promotion's CTR or CVR target should be set per traffic source, not as one blended site-wide number.
Put together with the redemption data above, the full cost of a promotion is really two numbers multiplied together: what it costs to get a validated code in front of the right person, and what share of those validations actually convert once they land. Optimizing either number alone, without watching the other, is how a "successful" click-through campaign still loses money on the redemption side.
What the redemption-window data means for scheduling a promotion
Uniqodo's finding that 44.1% of non-batch redemptions land inside the first hour of a code's issue has an operational implication most promotion calendars ignore: the window in which a promotion earns most of its revenue is short, and inventory, staffing and email-send timing all need to be built around that first-hour spike rather than an assumed slow build over a multi-day campaign. The same dataset's month-over-month conversion climb - from 12.52% in January to 17.40% in June - shows the baseline redemption rate itself drifts across the year, so a promotion compared only against last quarter's numbers, without adjusting for seasonality, will look better or worse than it actually performed.
Inmar's volume data reinforces the same shift toward precision: as total distribution fell from 53.1 billion to 34 billion codes, the promotions that survived the cut were the ones targeted well enough to hold redemption steady on a much smaller base. That is the practical argument for fewer, better-targeted promotions over a return to mass blanket discounting.
Building the promotion on the right numbers
Our growth marketing team builds promotion calendars around the discount-depth and channel-cost data that actually applies to your category, not a blended industry average, and our analytics practice instruments redemption and repeat-purchase tracking so a promotion's real ROI is visible before the next one is planned. Talk to us before locking in your next discount depth.
Frequently Asked Questions
What is a good coupon code conversion rate in 2026?
Across 90 merchants and 4,124 promotions on the Uniqodo platform in H1 2026, 15.29% of validated coupon codes converted to a redemption, but that average hides a wide sector spread: retail and fashion converted at 17.81%, travel at 13.74%, and telco at only 8.04%. A promotion running below its sector's figure is underperforming even if the raw number looks reasonable in isolation.
Does a deeper discount always convert better?
No, and the data runs in the opposite direction in retail. Uniqodo found retail discounts of 10% or less converted 22.30% of validated codes, compared with just 9.08% at 20% off - deeper discounts attracted less-qualified traffic in that dataset. Klaviyo's 2025 Black Friday/Cyber Monday data backs this up at the macro level: brands offering the smallest discounts saw some of the healthiest sales growth, driven by personalization and lifecycle timing rather than markdown depth.
What discount depth actually works, then?
It depends on average order value. Klaviyo's BFCM 2025 data found low-AOV brands got their strongest open and conversion rates discounting 20-29% off, while mid- and high-AOV brands performed best at 30-39% off - and Small Business Saturday saw the deepest discounts of the season at roughly 28%, ahead of Black Friday's 26% and Thanksgiving's 24%.
How does cost per lead vary by channel and industry for a promotion?
Widely. WordStream's 2026 benchmark data, compiled from 13,474 US search campaigns, puts the all-industry average cost per lead at USD 66.69 with a range of USD 26.84 to USD 131.63 across categories - but the B2B reference point from 42 Agency's managed-client data sits near USD 606 per conversion, on a different measurement basis. Comparing a consumer promotion's CPL against a B2B benchmark, or vice versa, will always look wrong because the two are not measuring the same funnel.
Is overall coupon volume growing or shrinking in 2026?
Shrinking in raw volume, but concentrating in engagement. Inmar Intelligence's 2026 industry analysis found total coupon distribution fell to 34 billion in 2025 from 53.1 billion the year before, while total redemption held relatively steady - a move away from mass-scale distribution toward smaller, more precisely targeted promotions.
Sources
Uniqodo - Coupon Code Statistics 2026 (1.79M Redemptions)
Inmar Intelligence - 2026 Promotion Industry Analysis
Klaviyo - BFCM 2025: Why Smarter Pricing Strategies Outperformed Deep Discounts
WordStream by LocaliQ - Google Ads Benchmarks 2026
Promodo - Conversion Rate Benchmarks by Industry, Channel and Device (2026)


