



Table of contents
Only about a third of new products reach meaningful household penetration in year one, and the data traces most failures to a small set of repeatable causes - poor product-market fit, no defined launch process, and diagnosing trouble too late to fix it. CB Insights, NielsenIQ, PDMA, ProductPlan and Atlassian each measured a different part of the same pattern in 2025-2026.
Key Takeaways
- 70% of 431 VC-backed shutdowns since 2023 cite running out of capital, per CB Insights - but that is the final event, not the root cause.
- 43% of those same shutdowns cite poor product-market fit as a primary cause.
- 29% cite bad timing or macro conditions, concentrated in a handful of sectors.
- 19% cite unsustainable unit economics once capital dried up.
- Only about 33% of new FMCG launches reach 1% of households in year one across five European markets, per NielsenIQ.
- Just 50% of launched innovations are still growing by their second year.
- Only 7% of companies grow their innovation sales in a given year.
- Innovation sales growers are 2.03 times more likely to grow total sales overall.
- First-quarter velocity and distribution growth predicts a 1.6x higher chance of year-two growth.
- Best-performing companies hit a 76% launch success rate against 51% for everyone else, per PDMA's 453-company study.
- Average alignment to company goals sits at 3.5 out of 5 among product teams.
- Confidence in measuring business impact averages only 3 out of 5.
- 84% of product managers fear their own product will fail, per Atlassian's 2026 survey of 1,000-plus professionals.
- 56% of ProductPlan's 2026 respondents are individual contributors, 43% are leaders.
- Food launches in France break through at 37% versus roughly 30% category-wide.
What "failure" actually means in the data
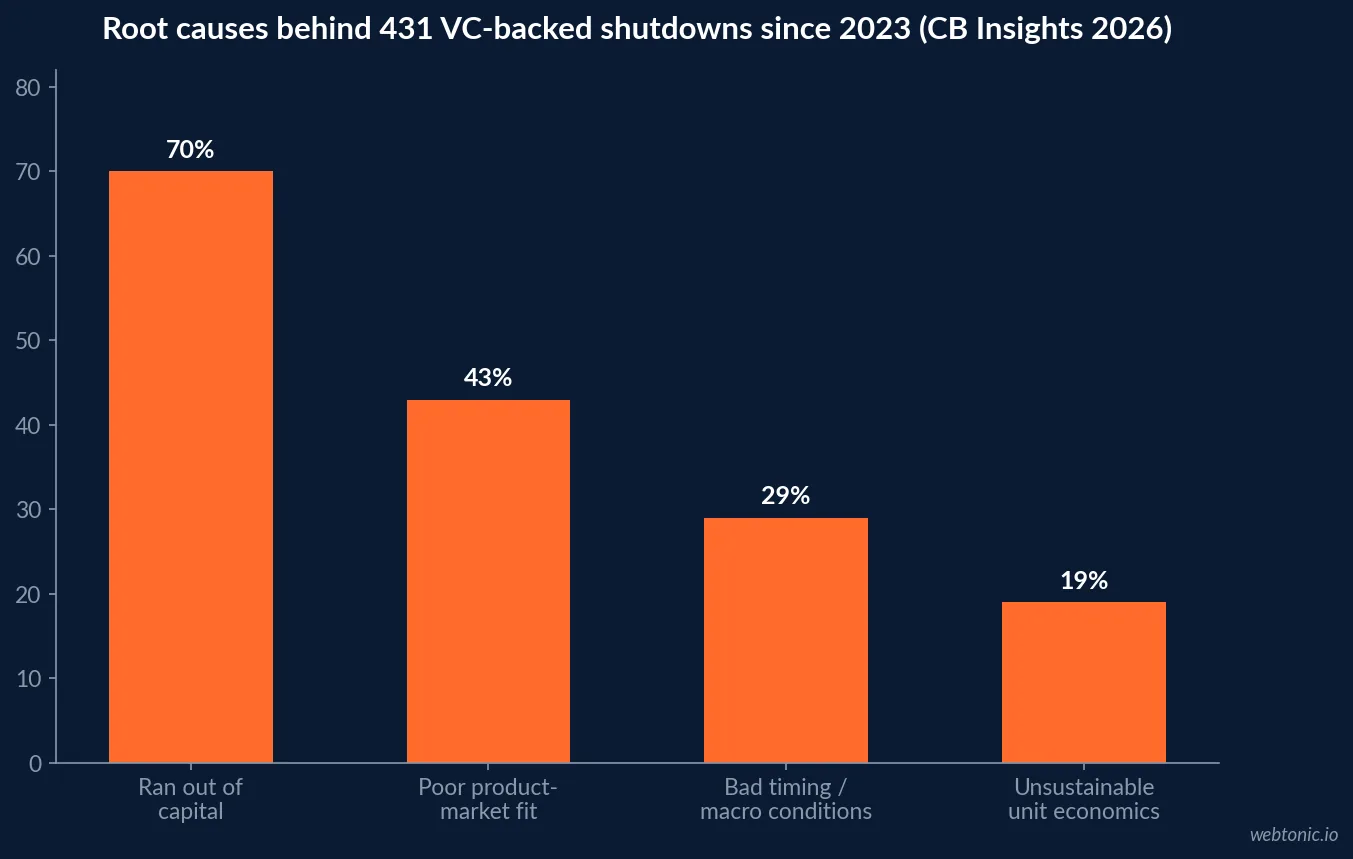
Failure is rarely one event. CB Insights' 2026 analysis of public post-mortems from 431 VC-backed companies that shut down since 2023 found "ran out of capital" cited in 70% of cases - but its own conclusion is that this is almost always the final cause of death, not the root problem underneath it. The more diagnostic causes are poor product-market fit at 43%, bad timing or macro conditions at 29%, and unsustainable unit economics at 19%. Two-thirds of the product-market-fit failures were early-stage companies that never found a market at all; the rest were later-stage companies that raised on early traction that never widened into a real one.
| Root cause (CB Insights, 2026) | Share of shutdowns | What it actually signals | Where it concentrates |
|---|---|---|---|
| Ran out of capital | 70% | The final event, not the root cause | Across nearly every sector |
| Poor product-market fit | 43% | No launch process caught it early enough | Two-thirds early-stage, some Series B+ |
| Bad timing / macro conditions | 29% | A launch bet on a trend that reversed | Climate & energy, food & agriculture, blockchain |
| Unsustainable unit economics | 19% | Growth outran the business model | Fintech, emerging-market expansion |
How many launches actually stick
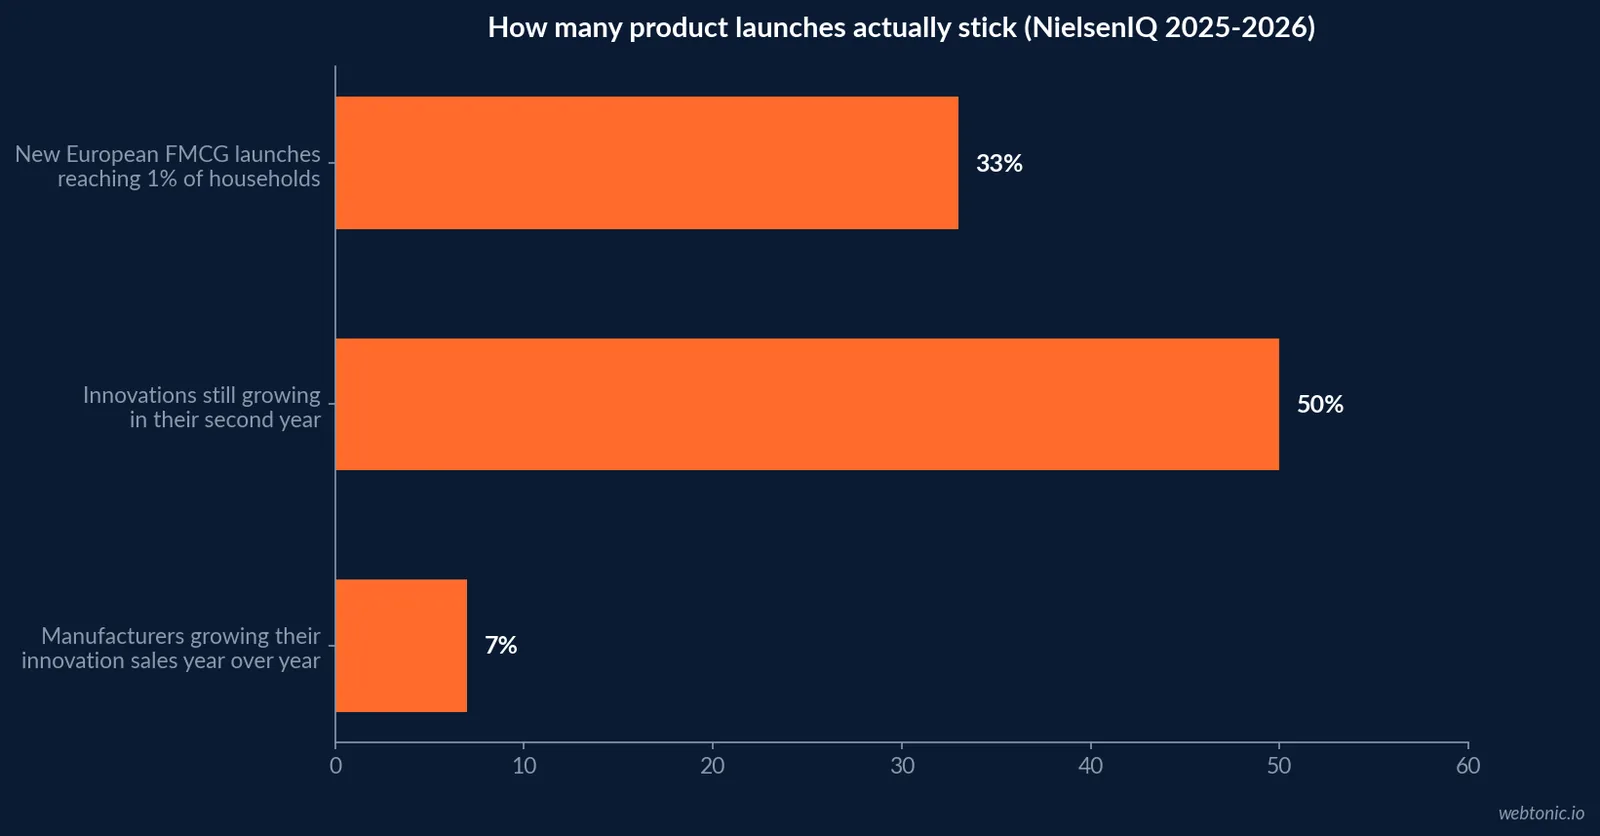
Zooming out from startup failure to product launches inside established companies, the pattern repeats. NielsenIQ's 2026 "Launch Fast, Learn Faster" analysis found more than 3,500 new brands and sub-brands launched across the UK, Germany, France, Italy and Spain in 2025, yet only about one third reached 1% of households. In France specifically, Food launches broke through at 37% against roughly 30% for the category overall, showing the bar moves by category, not just by company.
NielsenIQ's separate Beyond Vitality report adds the second-year test: across a year of reviewed launches, only 7% of companies grew their innovation sales, and just 50% of launched innovations were still growing by year two - meaning the other half were already headed for delisting. The upside for the companies that get it right is large: companies that grow their innovation sales are 2.03 times more likely to grow total sales overall, and innovations that grow both velocity and distribution in their first quarter are 1.6 times more likely to still be growing in year two - an early-warning signal most launch retrospectives look for a year too late.
| Launch milestone | Share that clears it | Source | Year |
|---|---|---|---|
| Reaches 1% household penetration, year one | ~33% | NielsenIQ, 5 European markets | 2025-2026 |
| Food category specifically, France | 37% | NielsenIQ | 2025-2026 |
| Still growing by year two | 50% | NielsenIQ Beyond Vitality | 2025 |
| Companies growing innovation sales in a year | 7% | NielsenIQ Beyond Vitality | 2025 |
| Likelihood of overall sales growth if innovation sales grow | 2.03x | NielsenIQ Beyond Vitality | 2025 |
The process gap between best performers and the rest
The clearest evidence that process, not talent or budget, separates winners from the rest comes from the Product Development and Management Association's Comparative Performance Assessment Study, published in the Journal of Product Innovation Management. Surveying 453 companies and comparing the "Best" firms against "the Rest," the study finds best-performing companies complete launches with a 76% average success rate against 51% for everyone else - a 25-point gap the researchers tie to defined, repeatable development and launch practices rather than company size or industry.
That structural finding is echoed in how product teams describe their own confidence. ProductPlan's 2026 State of Product Management report, surveying nearly 250 product professionals in Q4 2025 (56% individual contributors, 43% leaders), finds average alignment between product outcomes and company goals at only 3.5 out of 5, and confidence in measuring business impact at just 3 out of 5. Priorities shift with regularity even after agreement is reached, and leadership escalation is the most common reason cited for those shifts.
| Metric | Figure | Source | Sample |
|---|---|---|---|
| Launch success rate, best performers | 76% | PDMA / Journal of Product Innovation Management | 453 companies |
| Launch success rate, the rest | 51% | PDMA / Journal of Product Innovation Management | 453 companies |
| Alignment to company goals, self-rated | 3.5 / 5 | ProductPlan 2026 | ~250 product pros |
| Confidence measuring business impact | 3 / 5 | ProductPlan 2026 | ~250 product pros |
| Product managers who fear their product will fail | 84% | Atlassian State of Product 2026 | 1,000+ product pros |
Why product managers feel less confident than the data implies
Atlassian's 2026 State of Product report, surveying over 1,000 product professionals across the US and Europe, found 84% fear their own products will fail - a strikingly high number set against PDMA's structural evidence that process maturity, not individual skill, is the larger lever. The gap between that anxiety and the process data suggests many teams are absorbing organizational uncertainty (tighter timelines, AI reshaping workflows, shifting markets) as if it were personal risk, when the PDMA data says the fix is largely institutional: a defined go-to-market process, not a better instinct.
The Atlassian and ProductPlan surveys both describe product leadership taking on a more explicitly financial character in 2026 - roadmap decisions read as capital allocation, and product leaders are increasingly expected to show how initiatives move retention curves and margin, not just delivery cadence. That shift raises the stakes on the same process gap PDMA identified over a decade of studies: teams without a repeatable launch playbook are being asked to defend outcomes they were never structured to measure.
Where funding and product decisions actually diverge
CB Insights' sector breakdown of the 431 shutdowns adds a detail most summaries skip: the causes cluster differently by category. Bad timing and macro conditions concentrated disproportionately in climate and energy, food and agriculture, and blockchain - sectors that attracted heavy capital in 2021-2022 on trends that never fully materialized. Fintech ranked second by shutdown count at 13% of the dataset, but skewed early-stage, with a median equity funding of just USD 4 million against a dataset-wide median of USD 11 million, and 60% of those failures based outside the US, concentrated in emerging markets that saw a 2021-2022 funding boom followed by a unit-economics reckoning. The lesson for a product organization is that "bad timing" is rarely random noise - it is usually a sector-wide bet on a trend the market signal already contradicted before the capital ran out.
That is precisely the kind of signal a defined launch process is built to catch early. PDMA's 453-company comparison and NielsenIQ's first-quarter velocity test both point to the same operational answer: measure trial, repeat and distribution inside the first 90 days, and treat a weak signal there as a stop-and-diagnose trigger rather than something to revisit at the annual review.
What actually moves the failure rate
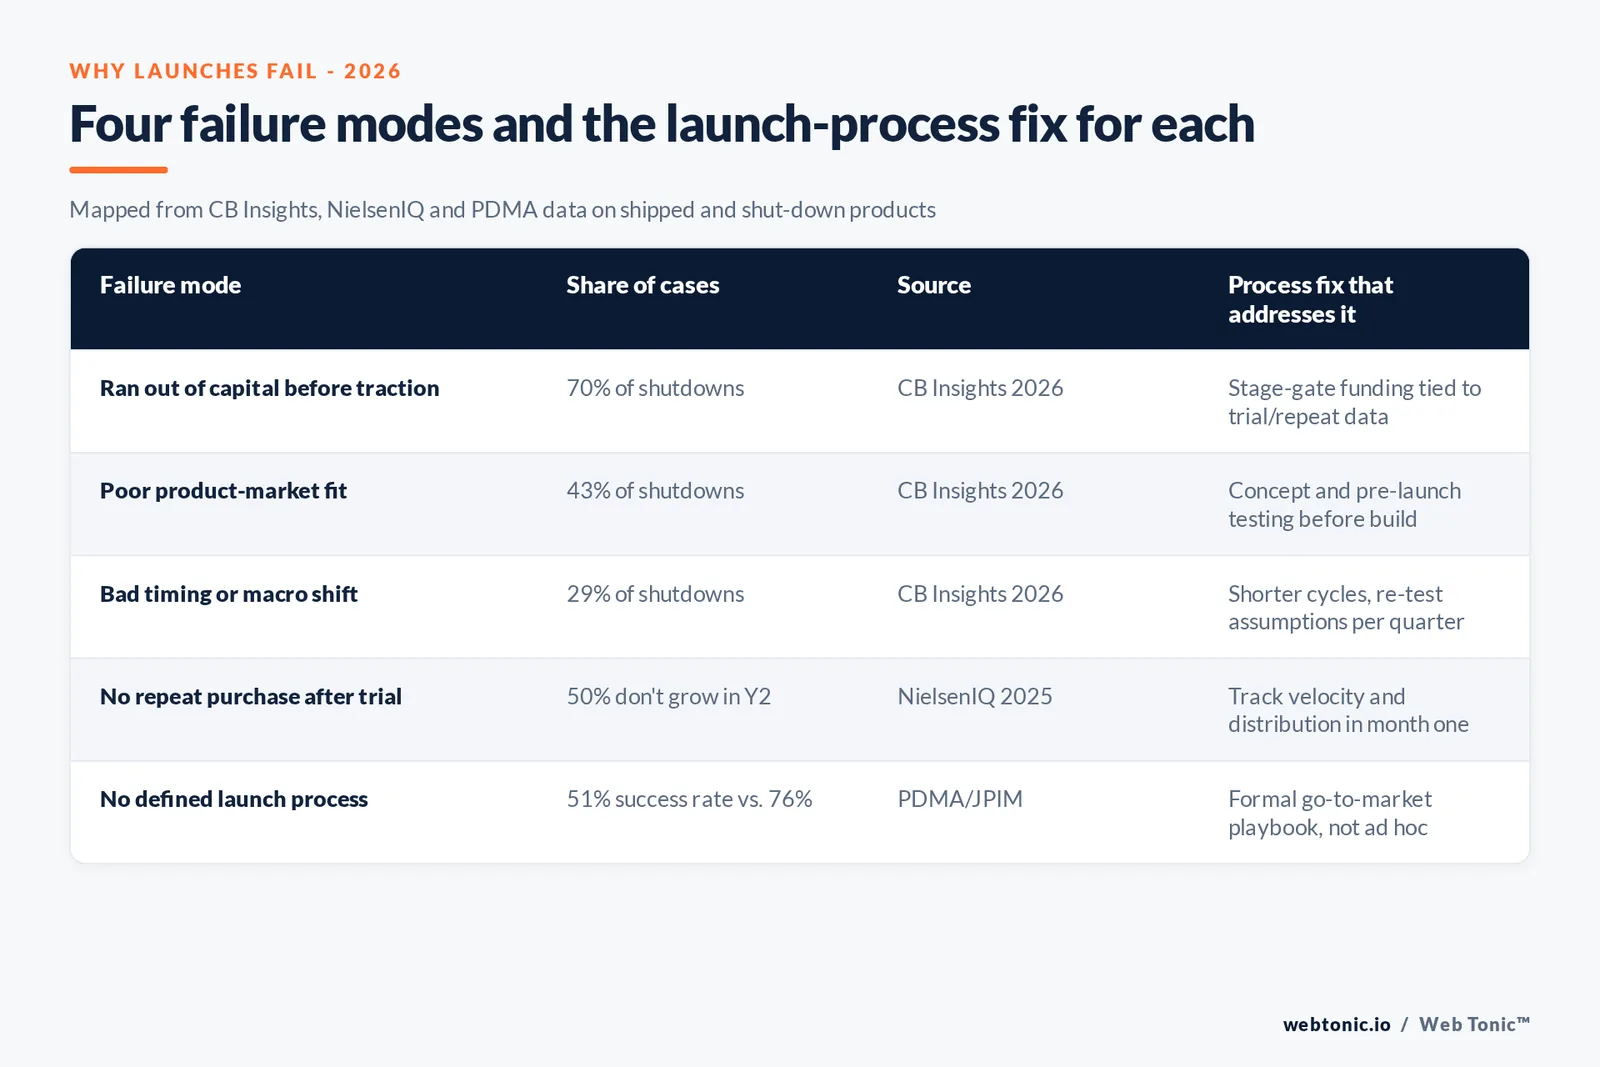
Across every source here, the fix that recurs is the same: catch the signal earlier. NielsenIQ's first-quarter velocity and distribution test, PDMA's defined-process gap, and CB Insights' finding that most product-market-fit failures were visible well before the capital ran out all point to the same structural change - build a stage-gate that checks trial and repeat data before the next funding or marketing commitment, rather than after.
Our data and analytics practice builds exactly that kind of early-warning instrumentation into a launch, and our growth marketing team can help translate what the first quarter of trial and repeat data is actually telling you before the twelve-month retrospective does. Talk to us if your next launch needs that instrumentation in place before day one.
Frequently Asked Questions
What percentage of product launches actually fail?
It depends on where you measure. NielsenIQ's 2025-2026 European FMCG data finds only about a third of new brands and sub-brands reach 1% of households in their first year, and its separate Beyond Vitality research finds just 50% of launched innovations are still growing by their second year. Among VC-backed companies that shut down since 2023, CB Insights attributes 43% of failures to poor product-market fit specifically - a launch problem, not a funding problem, even when funding is the final cause of death.
Is running out of money really the top reason products fail?
It's the most common final event, not the most common root cause. CB Insights' 2026 analysis of 431 VC-backed shutdowns puts "ran out of capital" at 70%, but its own framing is that capital running out is "almost always the final cause of death, not the root problem." The more diagnostic causes sit underneath it: poor product-market fit (43%), bad timing (29%) and unsustainable unit economics (19%).
Does having a formal launch process actually change the odds?
Yes, by a wide margin in the PDMA's Comparative Performance Assessment Study of 453 companies, published in the Journal of Product Innovation Management. Best-performing companies in that study average a 76% launch success rate against 51% for the rest of the sample - a 25-point gap tied directly to process maturity rather than budget or headcount.
Why do product managers feel less confident than the data suggests they should?
Confidence and alignment lag capability. ProductPlan's 2026 State of Product Management survey of roughly 250 product professionals finds average alignment to company goals at 3.5 out of 5 and confidence in measuring business impact at only 3 out of 5, while Atlassian's separate 2026 survey of over 1,000 product professionals finds 84% fear their own product will fail. The gap between what teams can measure and what they are asked to promise is itself a leading indicator worth tracking.
What is the single highest-leverage fix for a struggling launch pipeline?
Move the diagnosis earlier. NielsenIQ's research shows that innovations that grow both distribution and velocity in their first quarter are 1.6 times more likely to grow in year two, which means the earliest weeks of trial and repeat data - not the twelve-month retrospective - are where a launch's fate is already visible.
Sources
CB Insights - Why Startups Fail: Top 9 Reasons (2026)
NielsenIQ - Launch Fast, Learn Faster (2026)
NielsenIQ - Beyond Vitality: Redefining CPG Innovation for Incremental Growth
Journal of Product Innovation Management - PDMA's 2012 Comparative Performance Assessment Study
ProductPlan - State of Product Management 2026
Atlassian - State of Product 2026


