Table of contents
TikTok sells the cheapest clicks in social media and the highest engagement rate in the pool category - 4.2% versus 1.85% on Instagram - to an audience that is, on average, about a decade too young to finance a gunite build. The interesting question is not whether pool content performs on TikTok. It clearly does. It is whether paid distribution beats simply filming the job.
Key Takeaways
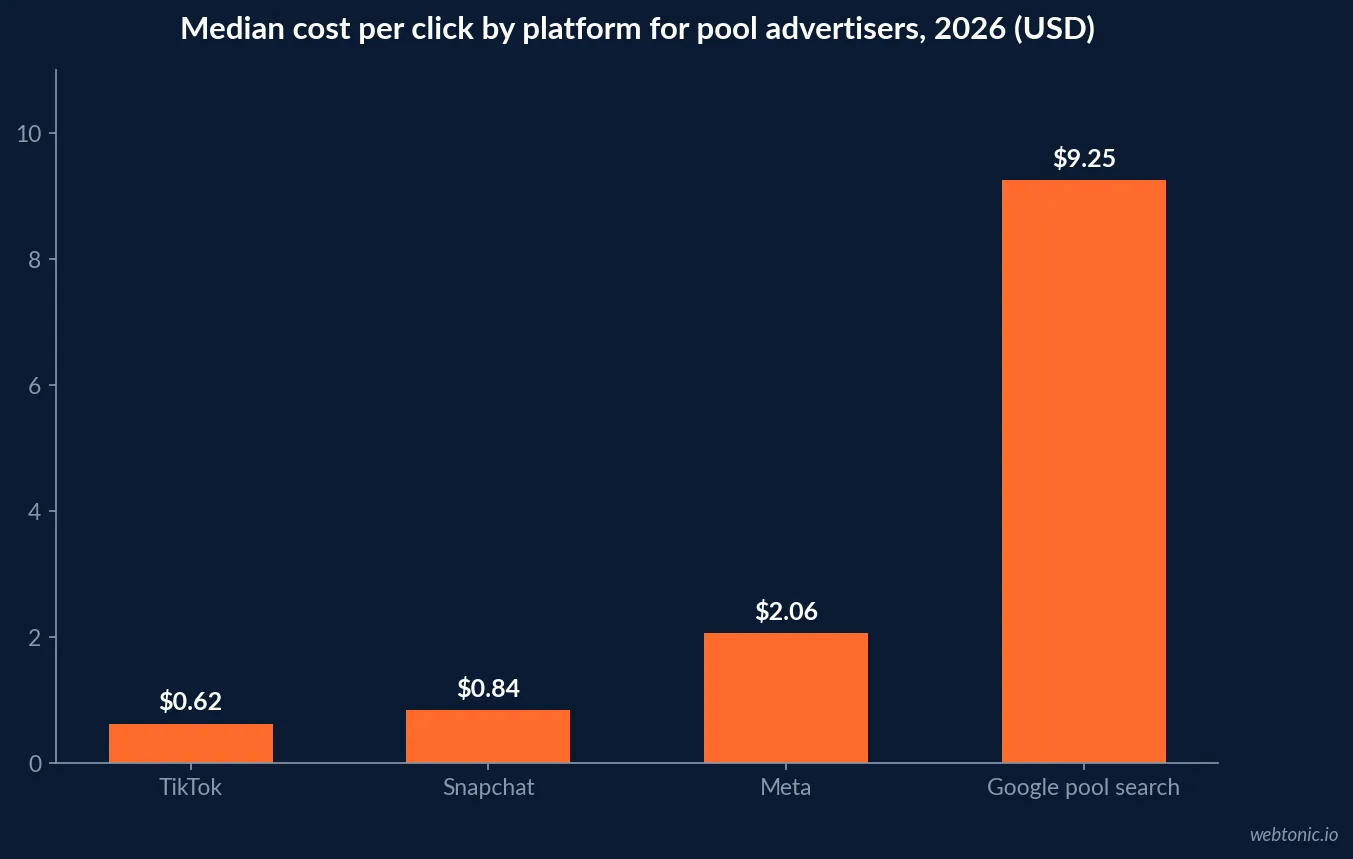
- Median TikTok CPC is $0.62 and average in-feed CPC $1.02 - against $7.50-$11.00 for pool construction clicks on Google Search.
- Median CPMs run $4.10 Reach, $6.80 Traffic, $16.20 Conversions, with in-feed averaging $9.16.
- Median CTR is 1.18%, roughly 38% above Meta, and in-feed conversion rate averages 1.8%.
- Spark Ads deliver 1.92x the CTR (1.62% vs 0.84%), a $0.47 CPC and 28.4% video completion versus 16.1% for standard in-feed.
- Median CPA climbs from $11.20 at 18-24 to $23.40 at 35-44, $36.10 at 45-54 and $58.40 at 55+ - the pool-buying brackets are the expensive ones.
- Pool content earns 4.2% engagement on TikTok versus 1.85% Instagram and 0.65% Facebook.
- Global TikTok ad spend hit $5.8 billion in Q1 2026, up 32% year over year - the cheap auction is being competed away slowly.
- 68% of campaigns at $20-$50/day never exit the learning phase in 14 days; $50-$100 is the working floor.
TikTok cost benchmarks at a glance
Objective sets the price, and the spread between reach and conversions is about four times.
| Objective | Median CPM | Approx. vs Meta | Pool-builder verdict |
|---|---|---|---|
| Reach | $4.10 | ~40% cheaper | Best value: build showcase and brand |
| Traffic | $6.80 | Materially cheaper | Send to a gallery, not a quote form |
| Video views / engagement | ~$6-$9 | Cheaper | Feeds retargeting pools cheaply |
| Catalog / Shop | $9.10 | Comparable | Only relevant to spa or supply retail |
| App Installs | $12.40 | Cheaper | Not applicable |
| Conversions | $16.20 | ~35% cheaper | Workable for service, weak for builds |
| TopView | $19.40 | Premium placement | Brand budgets only |

Clicks are the headline. A 3,127-campaign 2026 dataset puts median CPC at $0.62 across objectives, $0.51 on Traffic and $0.94 on Conversions, with a quartile range of $0.38-$1.04. Cross-industry in-feed averages land slightly higher at $1.02 CPC, $9.16 CPM, 1.0% CTR and 1.8% CVR - the gap is a median-versus-mean and objective-mix difference, so quote both when you set expectations.
The age curve that decides everything
This is the table pool builders should read before approving a budget.
| Audience age | Median CTR | Median CPA | Relevance to a pool purchase |
|---|---|---|---|
| 18-24 | 1.48% | $11.20 | Cheapest attention, almost no purchasing power |
| 25-34 | 1.18% | $14.80 | First-home buyers; occasional vinyl-liner budget |
| 35-44 | 0.84% | $23.40 | Core in-ground buyer with young children |
| 45-54 | 0.52% | $36.10 | Strong equity, remodel and resurfacing demand |
| 55+ | 0.34% | $58.40 | Real budget, worst platform economics |
Costs roughly triple across the brackets that matter. That does not disqualify TikTok - a $36 acquisition in the 45-54 bracket is still cheap next to $125-$180 Google Ads CPAs for new-construction pool leads reported in 2026 swimming pool benchmarks - but it destroys the "TikTok is 20 times cheaper" pitch. Weigh it against the fact that construction leads close at 8-12% while service leads close at 35-40%.
Spark Ads versus standard in-feed
One format decision moves performance more than bidding, targeting or budget.
| Metric | Spark Ads | Standard in-feed | Spark advantage |
|---|---|---|---|
| Median CTR | 1.62% | 0.84% | 1.92x |
| Median CPC | $0.47 | $0.78 | 1.66x cheaper |
| Median CPM | $6.20 | $7.40 | 1.19x cheaper |
| Median CPA (DTC benchmark) | $12.40 | $17.20 | 1.39x cheaper |
| Video completion rate | 28.4% | 16.1% | 1.76x higher |
| Share of campaigns in dataset | 47% | 53% | - |
Even after controlling for advertiser, Spark still beats standard in-feed by roughly 1.5x on CTR and 1.25x on CPA. The operational implication for a pool builder is a sequence, not a campaign: post process content organically, wait for one to over-perform, then put budget behind that exact post. Our performance creative process is built around that order of operations because it also removes the guesswork from creative selection.
Why pool content is unusually well suited to the format
Engagement data in this category is not marginal - it is the best in the industry's social mix.
| Platform | Pool industry engagement rate | Content that performs | Cost of distribution |
|---|---|---|---|
| TikTok | 4.2% | Excavation, gunite, tile, first fill, reveals | Organic free; $0.62 median CPC paid |
| 1.85% | Finished-build photography, Reels | Meta CPC $2.15-$3.50 for pools | |
| 0.65% | Local community posts, reviews | Meta CPM around $14.50 for pools | |
| 24.5% open rate | Seasonal service reminders | Near zero marginal cost |
Home-services contractors already document the pattern: short-form video generating local leads at around $1.02 per click, roughly a third of Google Search cost, against home-services search CPLs averaging $90.92. A pool build is a better story than a water heater swap - three weeks of visible transformation, a satisfying ending, and a product people fantasise about owning.
Budget and learning phase
The documented minimum and the useful minimum are different numbers.
| Daily budget | Median days to exit learning | Odds of stable CPA in 14 days | Monthly equivalent |
|---|---|---|---|
| $20 - $50 | 68% never exit inside 14 days | 14% | ~$600 - $1,500 |
| $50 - $100 | 6.4 days | 32% | ~$1,500 - $3,000 |
| $100 - $250 | 3.8 days | 58% | ~$3,000 - $7,500 |
| $250 - $500 | 2.6 days | 76% | ~$7,500 - $15,000 |
| $500+ | 1.8 days | 88% | $15,000+ |
Placement mix matters too: the For You feed carries 78% of impressions at a $6.80 CPM and 1.18% CTR, while the Pangle network is cheap at $3.20 CPM but converts materially worse (0.62% CTR). Exclude Pangle on a first test. And remember the auction is getting busier - $5.8 billion of Q1 2026 spend, up 32% year over year means the arbitrage narrows every quarter.
Seasonal content and spend calendar
Pool enquiries surge 300-400% from March through June, and TikTok content has a production lead time that has to be planned backwards from that.
| Period | Pool demand | Content to film | Paid weight |
|---|---|---|---|
| January - February | Research and planning begins | Design walkthroughs, cost explainers, last season's builds | 20% |
| March - April | Enquiry surge starts | Excavation and steel from the first builds of the season | 30% |
| May - June | Peak enquiry and booking | Gunite, tile, first fill and reveal videos | 25% |
| July - August | Backlog full, service peaks | Service plans, maintenance tips, crew recruiting | 10% |
| September - October | Off-season pricing window | Remodel, resurfacing and heater content | 10% |
| November - December | Most expensive auction of the year | Bank footage; recruiting only | 5% |
The practical trick is that peak-season job sites produce the footage that sells the next season. Film everything between March and August, publish year-round, and Spark the winners in January when the research phase begins and auction prices are at their lowest.
Where TikTok fits a pool builder's plan
Ranked by expected return rather than by novelty.
| Use case | Fit | Why |
|---|---|---|
| Organic build documentation, then Spark the winners | Strong | 4.2% engagement and 1.62% Spark CTR at near-zero content cost |
| Remarketing to gallery and pricing-page visitors | Strong | Cheap reminders across a 70-180 day decision |
| Recruiting installers and seasonal crew | Strong | The 18-34 core is the trade labour market |
| Service, maintenance and chemical plans | Moderate | Lower ticket suits cheap clicks and 35-40% close rates |
| Remodel and resurfacing offers to 45-54 | Moderate | $36.10 CPA still beats a $125-$180 search CPA |
| Cold conversion campaigns for six-figure builds | Weak | Wrong intent, and CPA triples with buyer age |
| Commercial or HOA pool contracts | Weak | Decision-makers are not sourcing vendors here |
Any of these only pays if you can attribute it. TikTok almost never takes last click on a purchase that takes months and usually ends in a phone call - the modelling problem covered in our pool building marketing attribution statistics analysis.
Creative rules with measured effects
- Under 12 seconds for Spark Ads: median CTR is 7.3x higher than repurposed landscape video.
- Never exceed 22 seconds on cold traffic - CPM rises and completion falls.
- Native vertical only; landscape repurposing carries a CPA more than 3x the best format.
- Hook on transformation, not on a logo - the empty yard is the hook.
- Show the crew and the mess; process content out-performs polished renders on this platform.
- Exclude Pangle placements on any first test.
- Refresh the creative set monthly; the auction rewards new completion signals.
What a pool builder must never do on TikTok
- Buy cold conversion traffic in the 18-24 bracket because the $11.20 CPA looked good.
- Run standard in-feed ads when Spark exists - you are paying 1.66x more per click for less credibility.
- Launch at $20 a day and conclude the platform failed when 68% of that band never exits learning.
- Send traffic to a desktop-first page: 68.5% of pool sessions are already mobile.
- Judge TikTok on last-click leads across a 70-180 day sales cycle.
- Spend on TikTok during the March-June enquiry surge at the expense of search and Local Services Ads.
- Hand the account to an agency that cannot show you organic content performing first.
A 90-day structured test
Organic first, paid second - the cheapest possible way to find out.
| Window | Work | Decision point |
|---|---|---|
| Week 1-3 | Post 3-4 organic process videos per week from live job sites | Any post above 4.2% engagement |
| Week 4-5 | Spark the two best organic posts at $50-$75/day | CTR above 1.6%, CPC under $0.60 |
| Week 6-7 | Add remarketing to gallery and pricing-page visitors | Cost per consultation booked |
| Week 8-9 | Age-gate a cold campaign to 35-54 homeowners | CPA against the $23-$36 benchmark band |
| Week 10-11 | Test a service-plan or resurfacing offer | Whether the lower ticket converts better |
| Week 12-13 | Compare cost per signed job with search and LSA | Keep, shrink to Spark-only, or kill |
Report the same numbers monthly: CTR against the 1.18% median, CPC against $0.62, video completion against 28.4% for Spark, cost per consultation booked, assisted conversions under a position-based model, and TikTok's share of blended spend. For the search side of the same plan, see our pool building SEO statistics breakdown, our paid social work, or get in touch.
Frequently Asked Questions
Do TikTok Ads work for pool builders?
As a cheap top-of-funnel and remarketing channel, yes; as a replacement for search, no. Median TikTok CPC is $0.62 across objectives and average in-feed CPC is $1.02, against $7.50-$11.00 for pool construction clicks on Google Search. The catch is intent and age: median cost per acquisition rises from $11.20 in the 18-24 bracket to $23.40 at 35-44 and $36.10 at 45-54 - and the 35-54 range is where in-ground pool buyers actually live.
What do TikTok Ads cost in 2026?
Median CPM is $4.10 for Reach, $6.80 for Traffic, $12.40 for App Installs and $16.20 for Conversions, with average in-feed CPM around $9.16. Median CPC is $0.62 across objectives and $0.51 on Traffic - the cheapest mainstream social clicks available. Median CTR is 1.18%, roughly 38% above equivalent Meta inventory, and average in-feed conversion rate sits near 1.8%.
Are Spark Ads worth using for a pool company?
They are the single biggest lever on the platform. Spark Ads - paid amplification of an organic post - deliver a 1.62% median CTR versus 0.84% for standard in-feed, a $0.47 CPC versus $0.78, and a 28.4% video completion rate versus 16.1%. Median CPA is about 1.39x cheaper. Even comparing accounts that run both formats in the same period, Spark still wins by roughly 1.5x on CTR. For a builder, the natural Spark candidate is an organic build time-lapse that already performed.
Is pool content actually good on TikTok?
It is the best-performing social format in the category. Pool industry benchmarks put TikTok engagement at 4.2%, versus 1.85% on Instagram and 0.65% on Facebook. Excavation, gunite spraying, tile work and the first fill are genuinely watchable process content, which is why organic reach in this niche outperforms the paid case - the content costs film time rather than media budget.
What budget does a TikTok test need?
TikTok's documented ad-set minimum is $20 a day, but 68% of campaigns in that band never exit the learning phase within 14 days. At $50-$100 a day the median exit is 6.4 days and 32% of campaigns find a stable CPA in two weeks; at $100-$250 it is 3.8 days and 58%. For a single-market pool builder, plan $1,500-$3,000 a month for a 90-day test, with the majority of that in Spark Ads and remarketing rather than cold conversion campaigns.
Sources
AdLiftr - TikTok Ads Cost Benchmarks 2026
Digital Applied - TikTok Ads Benchmarks 2026
Digital Applied - TikTok Statistics 2026
PipelineOn - Short-Form Video for Home Service Contractors
XYZ Lab - TikTok Ads Benchmarks
Hawky - TikTok Ads Benchmarks 2026
CUFinder - Swimming Pool Industry Benchmarks 2026
GetX Media - Pool Builder Marketing Benchmarks 2026
Elev8 Operations - Contractor TikTok Marketing 2026