Table of contents

Pool building is the hardest attribution problem in home services: a $65,000-plus purchase with a 70-to-180-day sales cycle, most conversions arriving by phone, and a spring lead surge that hides everything. Last-click reporting misallocates 40-60% of channel credit in contractor accounts. Here is what the 2026 data actually supports.
Key Takeaways
- New pool sales cycles run 70-180 days, and Texas builders report 6-12 month cycles on $50,000-$300,000 tickets.
- Last-click reporting misallocates 40-60% of channel credit; one audit found a cut channel was the first touch on 35% of the highest-value jobs.
- Phone leads convert at about 46% versus 1.7% for forms, yet 28% of business calls go unanswered.
- Only 1.3% of 1,222 audited US home-services Facebook advertisers run both the pixel and the Conversions API; pixel-only accounts lose 30-60% of iOS signal.
- Construction leads close at 8-12% versus 35-40% for service, so blended cost per lead is a meaningless number in this trade.
- Shared marketplace leads close at 8-14% versus 30-45% on Local Services Ads - a $65 paper lead can cost $650 per signed job.
- Only 52% of CRM users actually fill the lead-source field, which is where most contractor attribution quietly dies.
Pool attribution benchmarks at a glance
These are the numbers that decide whether a pool builder can trust its own dashboard. Each one is a measured benchmark rather than a modelled estimate.
| Metric | 2026 benchmark | Why it matters for attribution |
|---|---|---|
| New-build sales cycle | 70-180 days (up to 12 months) | Longer than most attribution lookback windows |
| Average in-ground project | $65,909 | One misattributed channel cut costs six figures |
| Share of conversions by phone | 60-70% | Invisible without call tracking |
| Phone vs form conversion | 46% vs 1.7% | Form-only tracking under-reports the real funnel |
| Unanswered business calls | 28% | Lost demand looks like weak channel performance |
| Channel credit misallocated by last click | 40-60% | The core reporting error in the trade |
| Pixel signal lost on iOS without CAPI | 30-60% | Meta cannot optimise on data it never receives |
| Pixel + CAPI adoption in home services | 1.3% of 1,222 advertisers | Almost nobody is measuring properly |
| Spring lead surge (March-June) | +300-400% | Seasonality masks channel-level change |
Two of those numbers do most of the damage together: the majority of pool enquiries arrive as calls, and roughly a quarter of business calls are never answered. A channel judged on tracked form fills alone is being graded on a minority of its output.
The sales cycle is the whole problem
A pool is not an emergency purchase. Homeowners browse galleries through winter, request two or three design consultations in spring, and sign months later. Industry reporting puts the average new-build cycle near 70 days, while Texas builders describe 6-to-12-month cycles on $50,000-$300,000 tickets. Builders who track conversion honestly close 30-40% of leads who complete a full design consultation, and only around 8% of raw, unqualified leads.
That gap is why cost per lead is the wrong headline metric. Qualification alone can move a sales team from an 8% to a 25% close rate on identical ad spend - a change no channel report will ever show you, because the channel did not change.
Cost per lead by intent, not by channel
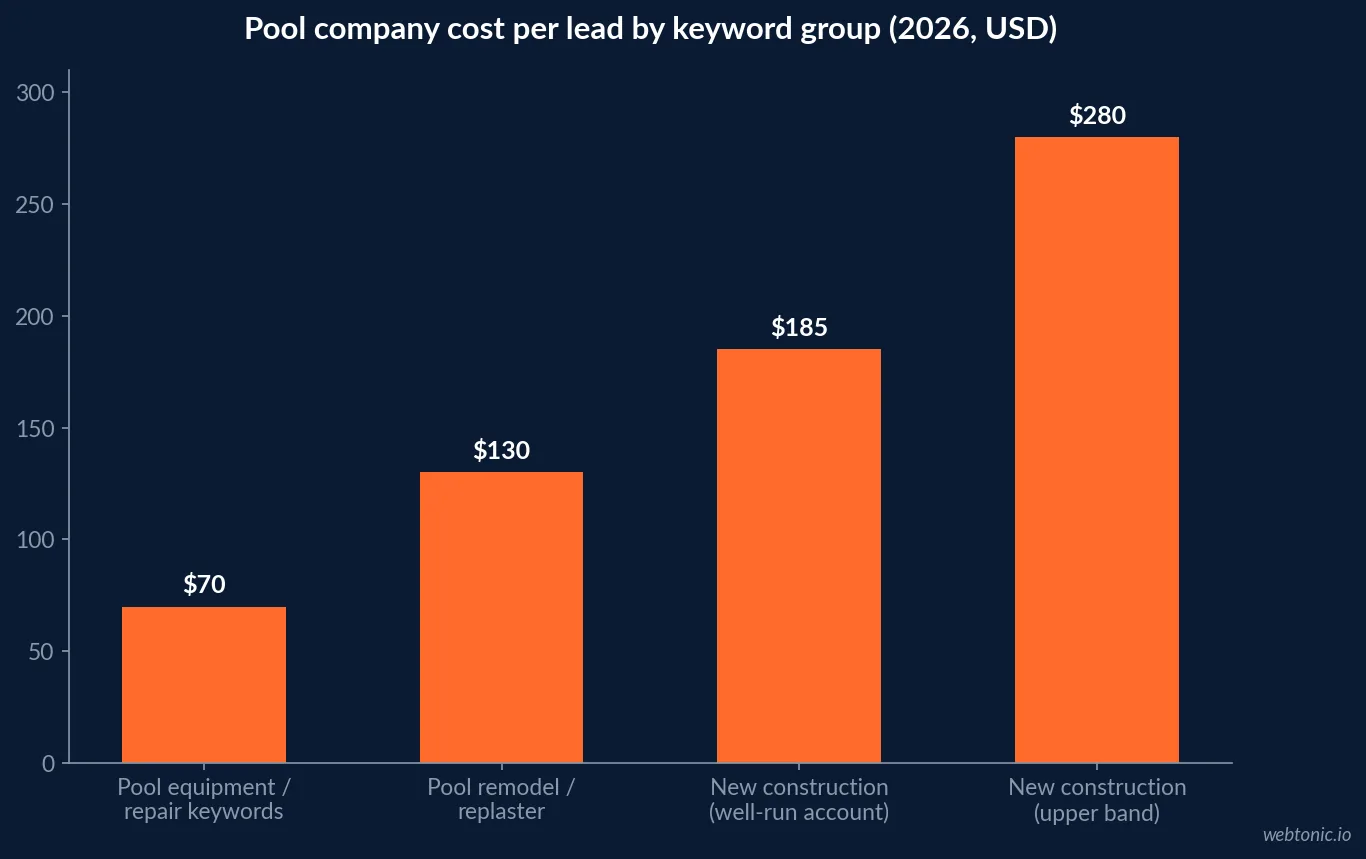
Attribution in pool building only becomes useful once leads are separated by job type. A repair enquiry and a gunite build enquiry are different businesses sharing a phone number.
| Lead type | Cost per lead (2026) | Close rate | Effective cost per signed job |
|---|---|---|---|
| New construction keywords | $120-$280 | 8-12% | $1,000-$3,500 |
| Well-run construction account | $150-$220 | up to 25% qualified | $900-$1,500 |
| Remodel / replaster | $80-$180 | 15-25% | $400-$1,200 |
| Equipment / repair | $45-$95 | 30-40% | $120-$320 |
| Local Services Ads | $80-$300 | 30-45% | $200-$900 |
| Shared marketplace leads | $45-$95 | 8-14% | ~$650 on a $65 paper lead |
| Organic / referral (year 2) | $5-$75 | 35-50% | $15-$210 |
| Branded search | $8-$25 | high, but demand already existed | misleadingly low |
The last row is the trap. Branded search looks like the best channel in every last-click report because it is the final step of a journey some other channel started. Our data intelligence team treats branded search as a demand thermometer, not a demand source.
What last-click actually does to a pool budget
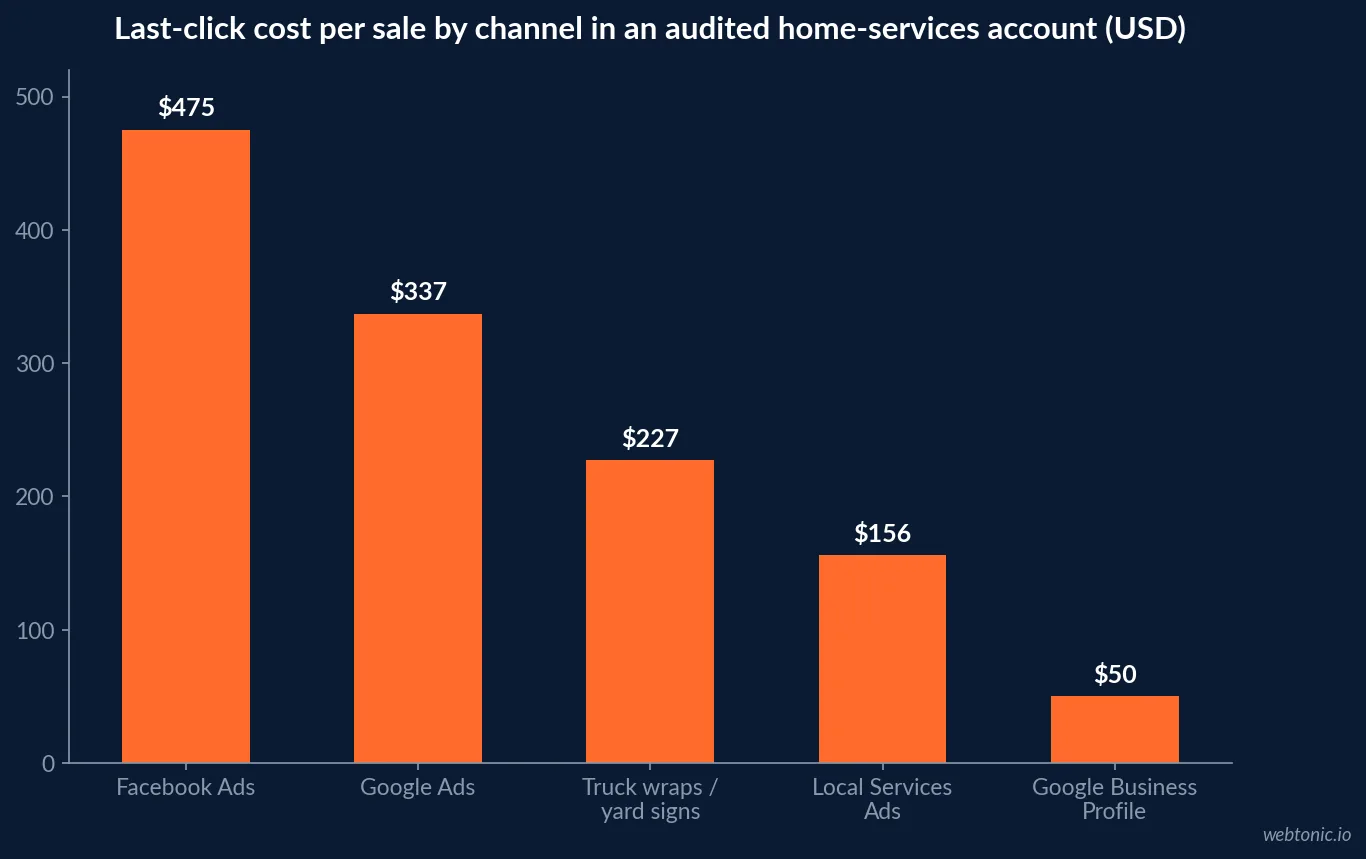
An audited home-services account shows the mechanism cleanly. At $14,200 a month across six channels, last click produced wildly different cost-per-sale figures - and the cheapest looking channels were the ones with no tracking at all.
| Channel | Monthly spend | Closed jobs | Last-click cost per sale |
|---|---|---|---|
| Google Ads | $6,400 | 19 | $337 |
| Local Services Ads | $2,800 | 18 | $156 |
| Facebook Ads | $1,900 | 4 | $475 |
| Google Business Profile management | $600 | 12 | $50 |
| Truck wraps + yard signs (amortised) | $2,500 | 11 | $227 |
| Blended total | $14,200 | 64 | $221 |
After the owner cut Facebook from $1,900 to $400 and moved the money into profile photography and wrap maintenance, the account produced 71 closed jobs and $189,000 of revenue at a $200 blended cost per sale. The lesson is not that Facebook is bad; it is that a channel with no measured assist looks free and a channel with a measured assist looks expensive.
The measurement stack pool builders actually need
Enterprise attribution platforms are built for accounts spending over $10M. A pool builder gets most of the available accuracy from four cheap components, installed in this order.
| Layer | Typical cost | Setup effort | What it recovers |
|---|---|---|---|
| Call tracking with dynamic number insertion | $45-$100/month | 30-60 minutes | The 60-70% of conversions that arrive by phone |
| CRM lead-source discipline | included | process, not software | Only 52% of users fill this field today |
| Server-side conversions (CAPI / enhanced conversions) | 1-3 hours of dev time | one-time | 20-40% CPL improvement within 90 days |
| Post-sale 'how did you hear about us' survey | $0 | 30 minutes | Reveals 20-40% more assisted credit |
| Geo or spend holdout test | 25-40% of one week's revenue | 2-4 weeks | True incrementality, not platform self-reporting |
PipelineOn's audit of 1,222 US home-services Facebook advertisers found only 16 (1.3%) running both the pixel and the Conversions API, with HVAC and garage doors at 0.0%. Together the two layers reportedly attribute 85-95% of events, versus 70-80% for pixel-only accounts. For a builder whose average ticket is a five-figure backyard, that gap is the difference between scaling and guessing.
Attribution model choices, ranked by usefulness
No pool builder needs a data-science team, but the model choice changes the budget decision. These are the four in practical use.
| Model | How credit is split | Fit for pool building |
|---|---|---|
| Last click | 100% to the final touch | Poor - overstates branded search and Google Ads by 40-60% |
| First click | 100% to the discovery touch | Useful as a counterweight, not as a truth |
| Linear | Equal share to every touch (20% each across 5 touches) | Fair, but flattens genuinely decisive touches |
| Position-based (40/20/40) | 40% first, 40% last, 20% to the middle | Best default for a 70-180 day considered purchase |
Run the same month through two models before changing a budget. If a channel survives both last click and position-based, it is real. If it only exists in one, you have found a reporting artefact rather than a performance problem - the same discipline we apply in our Google Ads strategy playbook.
Seasonality distorts every channel comparison
Pool demand is violently seasonal. Enquiries spike 300-400% from March through June as winter browsers finally act, and 78% of leads go to the first responder. A channel tested in February and a channel tested in May are not comparable, and neither is a year-over-year comparison that straddles a price change.
Cost of marketing percentage suffers the same distortion in reverse. The accrual method is the fix: $15,000 of spend generating 40 qualified leads at a 30% historical close rate and an $85,000 average project value represents roughly $1.02M of accrued revenue, even though most of those contracts are unsigned on the reporting date. Compare spend to accrued revenue, never to same-period signings.
What pool attribution must never do
- Never judge a channel on tracked form fills when 60-70% of conversions are calls.
- Never blend construction and service leads into one cost-per-lead number - they close at 8-12% and 35-40%.
- Never trust platform-reported ROAS unchallenged; Meta typically over-credits itself by 15-30% while GA4 under-credits it by 20-40%.
- Never discard "I do not remember" survey answers - modelling them proportionally recovers 15-25% of assisted credit.
- Never cut a brand or offline channel on a single month of last-click data during the spring surge.
- Never scale Meta past roughly $3,000 a month before call tracking and server-side events exist.
- Never buy an enterprise attribution platform for a shop under $10M in spend; the cheap stack captures most of the value.
A 90-day attribution build for a pool company
Sequenced so each step makes the next one measurable.
| Window | Work | Expected effect |
|---|---|---|
| Week 1 | Call tracking with DNI on every landing page and profile | Phone conversions become visible |
| Week 2 | One required CRM lead-source field, enforced at intake | Closes the 52% completion gap |
| Week 3-4 | Server-side conversions on Meta and Google | Recovers 15-25% of lost conversions |
| Week 4-5 | Split pipelines for construction, remodel and service | Ends blended-CPL decision making |
| Week 6-8 | Position-based model rebuilt alongside last click | Reveals the assisting channels |
| Week 8-10 | Post-sale source survey on every signed contract | Human check on platform reporting |
| Week 10-13 | One geo or spend holdout test on the largest channel | Incrementality instead of self-report |
The search-side companion to this work is our pool building SEO statistics breakdown, and the brand-side counterpart is pool building branding statistics.
Metrics to report every month
- Answered-call rate against the 28% unanswered benchmark.
- Cost per qualified lead, split construction / remodel / service.
- Lead-to-consultation and consultation-to-sale rates, tracked against the 30-40% consult close rate.
- Cost per signed job by channel under two attribution models.
- CRM lead-source completion rate - the single best proxy for data trustworthiness.
- Delta between platform-reported leads and CRM-received leads (under 15% is healthy).
- Accrued cost of marketing percentage, benchmarked at 2-5% to maintain and 5-7% to grow.
If you want that reporting built once and maintained monthly, get in touch.
Frequently Asked Questions
Why does last-click attribution fail for pool builders?
Because the purchase takes months. New pool sales cycles run roughly 70 to 180 days, and Texas builders report 6-to-12-month cycles on $50,000-$300,000 tickets. Over that window a buyer touches organic search, a gallery, Meta retargeting, a truck in the neighbourhood, a referral and finally a branded search - and last click hands 100% of the credit to that final branded search. Contractor audits put the resulting distortion at 40-60% of channel credit misallocated, and one roofing analysis found the channel it had cut was actually the first touchpoint for 35% of its highest-value jobs.
What should a pool builder track first?
Phone calls. Home-services phone leads convert at about 46% versus 1.7% for web forms, roughly 60-70% of conversions arrive by phone, and about 28% of business calls go unanswered. Dynamic number insertion through a call-tracking tool costs roughly $45-$100 a month and takes 30-60 minutes to install, which makes it the cheapest attribution upgrade available to a builder spending $5,000 or more a month on media.
How much conversion data are pool builders losing?
More than most realise. Meta's browser pixel loses an estimated 30-60% of signal on iOS traffic, iOS is roughly 55% of US smartphone traffic, and an audit of 1,222 US home-services Facebook advertisers found only 1.3% running both the pixel and the Conversions API. Advertisers who add server-side tracking on top of an existing pixel typically report a 20-40% cost-per-lead improvement within 90 days because the algorithm finally sees the conversions.
What is a realistic cost per pool lead and cost per signed job?
New-construction keyword leads run roughly $120-$280, remodel and replaster $80-$180, and equipment or repair $45-$95. A well-run account for a $5M builder averages $150-$220 per qualified construction lead. Shared marketplace leads look cheaper at $45-$95 but close at only 8-14% versus 30-45% on Local Services Ads, so a $65 paper lead can cost roughly $650 per signed job.
Does the pool sales cycle distort marketing ROI reporting?
Yes, and the fix is accrual. If you compare marketing spent in a quarter against contracts signed in that same quarter, your cost of marketing percentage looks inflated, because the last three months of spend has not returned yet. The industry practice is to credit projected revenue - qualified leads multiplied by historical close rate multiplied by average project value - so $15,000 of spend against 40 leads at a 30% close rate and an $85,000 average project reads as roughly $1.02M of accrued revenue rather than zero.
Sources
PipelineOn - Channel Attribution Insights for Home Service Contractors
PipelineOn - Marketing Attribution for Home Service Businesses
PipelineOn - Meta Pixel vs CAPI for Contractors (1,222-advertiser audit)
DG Agency - Pool Builder Marketing Cost 2026
M.Wolf Media - Google Ads for Pool Builders 2026
Elev8 Operations - How to Get More Pool Leads in 2026
PointWake - The 9-Month Sale: Pool Builder Follow-Up
RockItGo Digital - Pool Builder Spring Lead Management
LeadNurturer - The 70-Day Pool Sales Cycle
Aquathority - COM%: The #1 Marketing Metric for Pool Builders
CUFinder - Swimming Pool Industry Benchmarks 2026