



Table of contents

Key Takeaways
- Organic search drives 42–48% of all pool builder website traffic, making SEO the single largest acquisition channel ahead of paid search (16–24%) and direct visits (CuFinder).
- 50% of pool builders rank for 22 keywords or fewer in Google, revealing a massive competitive gap for firms willing to invest in search optimization (Patrick Herbert).
- "Pool builders near me" generates 27,100 monthly searches nationally, making local intent keywords the primary battleground for lead generation (PushLeads).
- SEO-generated leads cost $25–$45 each after 12 months, compared to $91 on average from lead platforms — a 50–72% reduction in cost per lead (PipelineOn).
- Every $1 invested in SEO returns $19.90 for home-service contractors, far exceeding paid advertising ROI (Watson Co.).
- Businesses that respond to Google reviews within 24 hours see 18% higher conversion rates from Google Business Profile views (FlashCrafter).
- Pool builder websites should target a 3–5% visitor-to-lead conversion rate, with top performers reaching 7–10% through optimized landing pages (PushLeads).
Search engine optimization remains the highest-leverage digital marketing channel for swimming pool contractors in 2026. With organic search delivering 42–48% of all website traffic to pool industry sites and the average pool construction project worth $65,909, ranking on page one for local intent keywords translates directly into signed contracts. Below, we break down the latest SEO benchmarks, local search performance data, and ROI statistics that matter most for pool building businesses.
Pool Building SEO Benchmarks at a Glance
| Metric | Pool Building Benchmark | Home-Service Average |
|---|---|---|
| Organic traffic share | 42–48% | 45–60% |
| Monthly searches — "pool builders near me" | 27,100 | Varies |
| Average website visits (FL pool builders) | 215/month | 350–600/month |
| Website conversion rate | 3.2% avg / 7–10% top | 2–3% |
| SEO cost per lead (12+ months) | $25–$45 | $25–$45 |
| Google Ads CPC (for comparison) | $7.50–$11.00 | $5–$15 |
| SEO ROI per $1 spent | $19.90 | $14–$22 |
| Keywords ranked (median pool builder) | ≤22 | 50–120 |
Organic Traffic and Channel Distribution
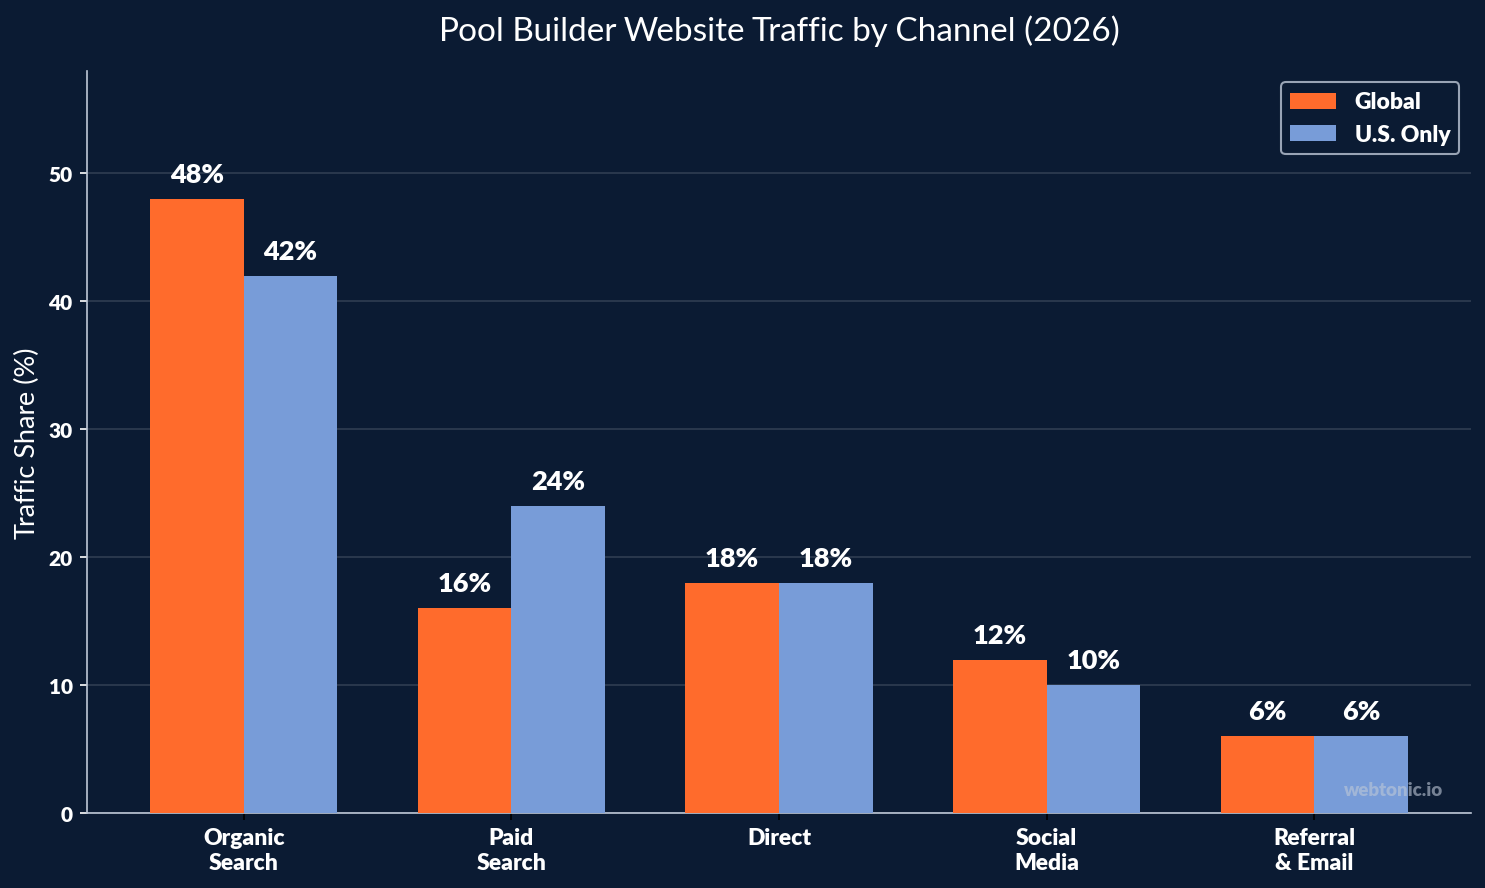
Pool industry websites rely heavily on search engines for visitor acquisition. According to CuFinder's 2026 Swimming Pool Industry Benchmarks, the global traffic distribution for swimming pool companies breaks down as follows:
- Organic search: 48% globally (42% for U.S.-only traffic)
- Direct traffic: 18%
- Paid search: 16% (24% in the U.S., reflecting higher Google Ads adoption)
- Social media: 12%
- Referral and email: 6%
The U.S. market shows a notably higher paid-search share (24% vs. 16% global), which indicates that American pool builders face stiffer auction competition — and that organic SEO offers a cost-efficient alternative to increasingly expensive Google Ads campaigns. Despite the dominance of organic search, 50% of pool builders rank for just 22 keywords or fewer (Patrick Herbert), revealing a wide competitive gap.
A case study from SEO Guru Atlanta documented a pool contractor achieving 166% organic traffic growth and a 36% increase in conversions over three months of strategic optimization, generating 167,000 impressions and 56 organic phone calls (SEO Guru Atlanta).
Local Search and Google Business Profile Performance
Local SEO is the single most important ranking factor for pool builders targeting homeowners in their service area. The keyword "pool builders near me" drives 27,100 monthly searches nationally (PushLeads), making it the primary battleground for lead acquisition in the swimming pool construction market.
| Local SEO Metric | Pool Builder Data |
|---|---|
| Monthly searches — "pool builders near me" | 27,100 |
| Map Pack improvement timeline (after GBP optimization) | 4–8 weeks |
| Review threshold for Map Pack competitiveness | 15+ reviews |
| Conversion lift from 24-hour review response | +18% |
| Local search query growth (construction services, YoY) | +30–45% |
| Organic lead share for established operators | 50–65% of inbound inquiries |
Google Business Profile optimization remains the foundation of local visibility. After fixing GBP categories and running a review campaign, most pool builders see Map Pack improvement within 4–8 weeks (Foxxr). The review threshold for Map Pack competitiveness in most metros sits at 15+ reviews with ongoing monthly acquisition (Authority Specialist).
Businesses that respond to reviews within 24 hours see 18% higher conversion rates from Google Business Profile views (FlashCrafter), and localized search queries for construction services have increased by 30–45% year over year (Authority Specialist).
SEO ROI and Cost-Per-Lead Economics
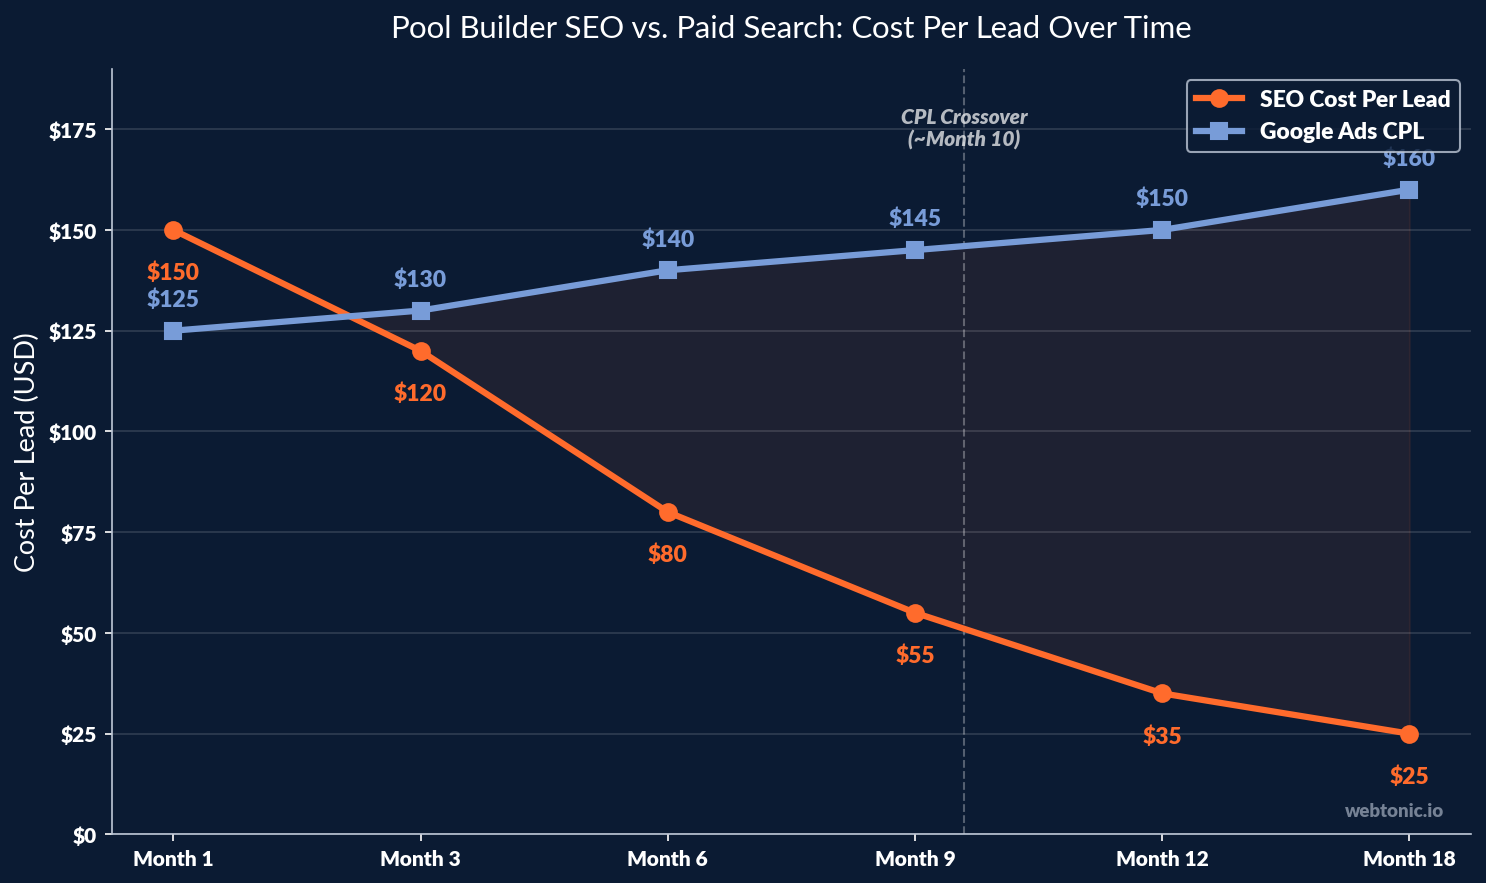
The financial case for pool builder SEO strengthens over time. While paid channels deliver immediate traffic, organic search becomes the most cost-efficient lead source once authority builds — typically within 9–15 months of consistent effort (Authority Specialist).
- Every $1 invested in SEO returns $19.90 for home-service contractors (Watson Co.)
- SEO-generated leads cost $25–$45 each at 12+ months of consistent work (PipelineOn)
- Lead platform average: $91 per lead — making organic search 50–72% cheaper (PipelineOn)
- Organic vs. paid cost-per-lead crossover typically occurs at 9–15 months into a sustained campaign (Authority Specialist)
- Rankings begin moving in months 4–6, with organic leads appearing consistently by month 6 (Authority Specialist)
Given that the average inground pool construction project costs $65,909 and pool companies maintain a 78% service-contract retention rate with a 3-year customer lifetime value of $2,400, even a modest SEO investment can generate outsized returns through high-ticket project acquisition and long-term maintenance contracts.
Website Conversion Rate Benchmarks for Pool Builders
Pool builder websites should target a 3–5% visitor-to-lead conversion rate, with top performers reaching 7–10% through optimized landing pages, compelling calls to action, and reduced friction (PushLeads). The home-service industry average conversion rate sits at 2–3%, meaning well-optimized pool builder sites can significantly outperform the baseline.
| Conversion Metric | Benchmark |
|---|---|
| Average website conversion rate | 3.2% |
| Top-performer conversion rate | 7–10% |
| Home-service industry average | 2–3% |
| Mobile traffic share | 68.5% |
| Average bounce rate (swimming pool sites) | 52.4% |
| Average session duration | 2 min 45 sec |
| Average lead conversion (home services, 2026) | 7.8% of leads → paying customers |
Seasonal search patterns strongly influence conversions: peak query volume occurs in spring (March–May) as homeowners prepare for summer, making Q1 and Q2 the critical window for SEO-driven lead capture (Authority Specialist). Pool builders who align their content calendar with these seasonal trends — publishing cost guides, design inspiration articles, and FAQ pages in late winter — capture early-funnel researchers who convert to leads as temperatures rise. Ensuring Core Web Vitals compliance and fast mobile page load times is equally critical, given that 68.5% of pool builder website traffic originates from mobile devices.
Pool Builder SEO vs. Paid Search: A Data Comparison
While Google Ads delivers immediate visibility, the long-term economics of SEO are compelling for pool construction companies. Here is how the two channels compare on key performance indicators:
| Metric | SEO (Organic) | Google Ads (Paid) |
|---|---|---|
| Cost per lead | $25–$45 (at 12+ mo.) | $125–$180 (construction) |
| Cost per click | $0 (organic) | $7.50–$11.00 |
| Traffic share | 42–48% | 16–24% |
| ROI per $1 spent | $19.90 | $2–$8 (varies) |
| Time to first results | 4–6 months | Immediate |
| Sustainability | Compounds over time | Stops when budget stops |
The optimal strategy for most pool builders combines both channels: paid search for immediate lead flow while organic SEO builds compounding authority. As the organic channel matures, pool companies can strategically reduce paid spend on keywords where they already rank on page one.
SEO Best Practices for Pool Building Companies
- Optimize Google Business Profile first — fix categories, add 50+ photos, and launch a review campaign targeting 15+ reviews. Most pool builders see Map Pack improvement within 4–8 weeks of GBP optimization.
- Target high-intent local keywords — "pool builders near me" (27,100 searches/mo.), "pool construction [city]," and "inground pool cost [area]" drive the highest-converting traffic.
- Build location-specific landing pages — create dedicated service-area pages with unique content, project photos, and local testimonials. Cox Pools achieved page-one rankings in Birmingham and Nashville using this approach (PoolMarketing.com).
- Publish answer-first blog content — articles like "How Much Does a Custom Pool Cost?" and "Top Pool Features in [City]" boost organic impressions and support long-tail SEO efforts.
- Respond to every Google review within 24 hours — this single habit yields an 18% conversion-rate lift from GBP views.
- Monitor seasonal search trends — ramp up content production in Q4–Q1 to capture peak spring search volume (March–May) when homeowners begin pool research.
- Track organic lead costs separately — the organic vs. paid cost-per-lead crossover typically occurs at 9–15 months; knowing when you pass that threshold justifies continued investment.
Swimming Pool Industry Market Context
Understanding the pool construction market size frames why SEO investment matters for this industry:
- $23.37 billion global pool and spa market in 2026, growing at a 6.3% CAGR (The Business Research Company)
- 14 million+ residential pools and spas in the United States
- 60,000 new inground pools installed annually across the U.S.
- 125,000 pool-related businesses competing for local search visibility
- $65,909 average pool construction cost, making every organic lead a high-value opportunity
- 64% of industry revenue comes from maintenance and service contracts, creating long-term customer value
With 125,000 businesses competing for local search visibility and only 50% ranking for more than 22 keywords, the SEO opportunity in pool building remains substantial for firms willing to invest in content, local optimization, and technical foundations.
Pool Builder SEO Case Studies and Real-World Results
Documented case studies from pool construction companies illustrate the tangible impact of strategic search engine optimization investments:
- SEO Guru Atlanta — Pool Contractor: Achieved 166% organic traffic growth, 36% more conversions, and 56 organic phone calls within three months. The campaign generated 167,000 total impressions through targeted on-page optimization and content strategy (SEO Guru Atlanta).
- Cox Pools — Birmingham & Nashville: PoolMarketing.com helped this builder achieve page-one rankings for local intent keywords in two competitive metro areas simultaneously by engineering location-specific landing pages with differentiated content to avoid duplicate-content penalties (PoolMarketing.com).
- Foxxr — GBP Optimization: After fixing Google Business Profile categories and running a structured review-acquisition campaign, the pool builders in this study saw Map Pack visibility improvements within 4–8 weeks and sustained ranking gains through consistent review volume and photo updates (Foxxr).
These results confirm that pool builder SEO is not theoretical — contractors who commit to a 6–12 month optimization timeline consistently achieve measurable gains in traffic, lead volume, and cost efficiency compared to paid-only strategies.
FAQ: Frequently Asked Questions
How long does SEO take to generate leads for a pool building company?
Rankings typically begin moving within 4–6 months of consistent optimization, with organic leads appearing regularly by month 6. The cost-per-lead crossover versus paid channels usually occurs between 9 and 15 months of sustained effort. Pool builders who invest in Google Business Profile optimization often see local Map Pack improvements within 4–8 weeks.
What is the average conversion rate for pool builder websites?
The average pool builder website converts at 3.2% of visitors to leads. Top-performing sites with optimized landing pages, clear calls to action, and fast load times reach 7–10%. The home-service industry average sits at 2–3%, so well-optimized pool company websites significantly outperform baseline benchmarks.
Is SEO worth the investment for pool contractors compared to Google Ads?
Yes. While Google Ads delivers immediate leads at $7.50–$11.00 per click, organic SEO produces leads at $25–$45 each once established — compared to $91 on lead generation platforms. Every $1 invested in SEO returns $19.90 for home-service contractors, and organic traffic compounds over time rather than stopping when the ad budget runs out. Given that the average inground pool project costs over $65,000, even one additional organic lead per month can cover a full year of SEO investment.
How many Google reviews do pool builders need to rank in the Map Pack?
The competitive threshold for Google Maps visibility in most metropolitan areas is 15+ reviews with consistent monthly acquisition. Pool builders should also respond to every review within 24 hours, as this single practice yields an 18% conversion-rate increase from Google Business Profile views.
What percentage of pool builder traffic comes from organic search?
Organic search drives 42–48% of total website traffic to swimming pool industry sites, making it the largest single traffic source. In the U.S. market, paid search accounts for 24% (higher than the 16% global average), reflecting the competitive CPC environment for pool-related keywords. Social media contributes roughly 12%, while referral and email traffic round out the remaining 6%. For established pool companies with optimized local profiles, 50–65% of all inbound service inquiries originate from organic search channels.
Sources
CuFinder — Swimming Pool Industry Marketing Benchmarks 2026
PushLeads — Pool Builder SEO: The Complete Guide
Patrick Herbert — Pool Builder Statistics
Authority Specialist — Construction SEO Benchmarks 2026
PipelineOn — Local SEO for Home Service Businesses
Watson Co. — Why SEO Matters for Home Services Companies
FlashCrafter — State of Local Search 2026
SEO Guru Atlanta — Pool Contractor SEO Case Study
Authority Specialist — Contractor SEO ROI
Foxxr — Why Pool Builders Don't Rank on Google


