Table of contents
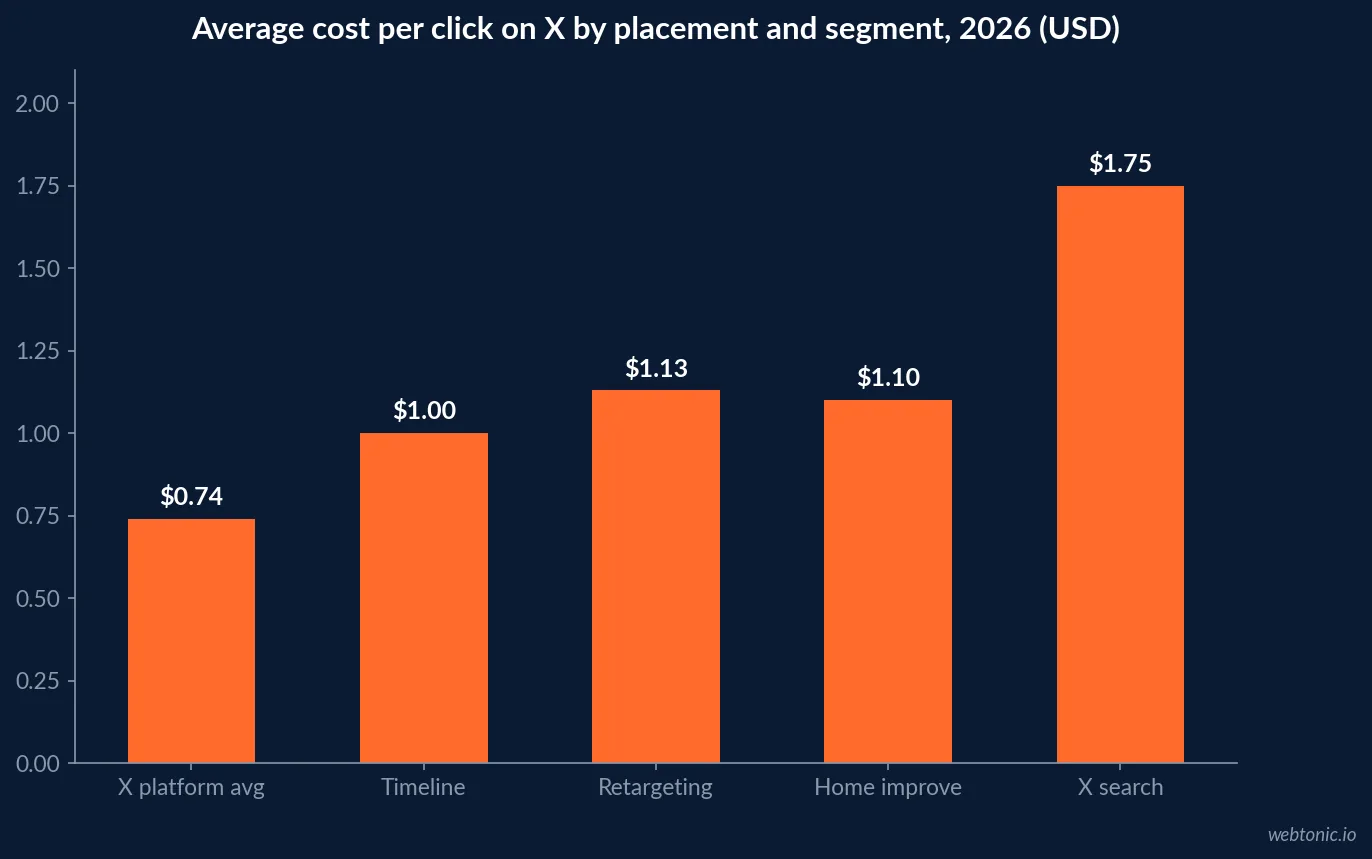
X is the cheapest click in paid social and, for most pool builders, the wrong buyer at the other end of it. With an average CPC of $0.74 against $1.41 on Meta and a 0.69% visitor-to-lead conversion rate, the channel is a test line item, not a lead engine - unless you use it for the three jobs below.
Key Takeaways
- X averages a $0.74 CPC and a $6.46 CPM, versus $1.41 CPC and $7.19 CPM on Facebook.
- Home-improvement benchmarks on X sit near $1.10 CPC, $8.20 CPM and 2.4% CTR.
- The platform reports roughly 611 million monthly active users and an advertising reach of about 544.5 million, with 63.7% male and 70.6% under 35.
- X holds only 0.2% of global digital ad spend, which is exactly why auction prices are low.
- Visitor-to-lead conversion has been measured at 0.69% on X versus 2.74% on LinkedIn.
- Average pool construction sale is about $65,909 with a lead-to-sale rate of 8% to 12% - so cheap clicks still need roughly 100 leads per 10 builds.
- Native video earns up to 10x the engagement of link-out posts; 80% of video views happen with sound off.
- 52% of advertisers cut X budgets over brand safety and reply engagement dropped 19% year over year on bot activity.
- Takeover formats start near $25,000 per day and reach $200,000-plus - out of scope for regional builders.
X advertising costs versus the platforms pool builders already use
The case for X begins and ends with unit costs, so put them beside the channels that already carry your pipeline.
| Platform | Typical CPC | Typical CPM | Typical CTR | Role for a pool builder |
|---|---|---|---|---|
| X (Twitter) | $0.74 average ($0.20-$2.00) | $6.46 ($2-$6 low end) | 0.86% - 3% | Cheap reach and recruiting; weak on local intent |
| Meta (Facebook / Instagram) | $1.41 ($2.15-$3.50 pool niche) | $7.19 ($14.50 pool niche) | 0.9% - 1.2% | Primary visual demand generation |
| Google Search | $7.50 - $11.00 construction terms | n/a | 5.2% | Primary bottom-funnel channel, 4.8% CVR |
| $5.26 - $8.50 | $42.29 median | 0.44% | Commercial, HOA and developer prospecting | |
| TikTok | $0.62 all objectives | $4.10 - $16.20 | 1.18% | Organic-first build content, young audience |
Platform-level costs come from 2026 X versus Meta benchmark comparisons and pool-specific figures from swimming pool industry benchmarks. X wins every cost column and loses the only column that pays - conversion rate.
The audience mismatch, in numbers
A pool is bought by a homeowner with equity, usually 35 to 65, usually with a partner in the decision. X's audience is younger, more male and more news-driven.
| Audience metric | X (2026) | Implication for pool marketing |
|---|---|---|
| Monthly active users | ~611 million (+4.3% YoY) | Large globally, thin in any single metro |
| Advertising reach | ~544.5 million | Reach estimates overstate niche segments by 10-15% |
| US ad audience | ~99 million | Roughly a third of Meta's US reach |
| Gender split | 63.7% male / 36.3% female | Skews away from joint household purchases |
| Share under 35 | 70.6% | Below the peak pool-buying age band |
| Time on platform | ~32 minutes per day | Short sessions, news-led attention |
| Share of global ad spend | 0.2% | Low competition, low auction prices |
| Mobile share of usage | Over 80% | Vertical, caption-first creative only |
User and reach figures are drawn from 2026 X platform statistics and cross-checked against the first management-disclosed user count since 2022, which reports 550 million monthly actives across X and Grok. Treat any single number as a range, and treat local reach estimates with real suspicion.
What a cheap click is worth against a $65,900 build
Pool economics forgive expensive traffic and punish unqualified traffic. That is the wrong way round for X.
| Step | Benchmark | X scenario at $0.74 CPC | Google Search scenario at $9.00 CPC |
|---|---|---|---|
| Clicks bought with $2,000 | - | ~2,700 clicks | ~222 clicks |
| Landing-page conversion | 3.2% pool site average | ~86 form or call leads | ~11 leads (4.8% paid CVR) |
| Lead quality | Intent-driven vs interest-driven | Low - browsing, often out of area | High - active search |
| Lead-to-sale, construction | 8% - 12% | Realistically well under 8% | 8% - 12% |
| Expected builds | - | 0 - 2, mostly unqualified | ~1 at high confidence |
| Average sale value | ~$65,909 | Same | Same |
The arithmetic is not an argument against X so much as an argument against expecting it to behave like search. Pool builders working from 2026 pool builder marketing benchmarks should already know their cost per booked consultation; use that number, not CPC, to grade any X test. Our breakdown of pool building SEO statistics covers the channel that supplies roughly 48% of pool website traffic for comparison.
Format and placement pricing
Every X ad unit is fundamentally a promoted post; the price changes with what is inside it and where it sits.
| Format or placement | 2026 pricing signal | Fit for a pool builder |
|---|---|---|
| Promoted post, engagement objective | $0.50 - $2.00 per action | Good for testing hooks cheaply |
| Native video, views objective | Under $0.10 per view | Best value - build timelapses and reveals |
| Timeline placement | $0.50 - $1.50 CPC | Highest volume, lowest intent |
| Search results placement | $1.00 - $2.50 CPC | Highest intent available on X |
| Amplify pre-roll | From ~$5.80 CPM | Brand-adjacent video, weak for leads |
| Timeline / Trend Takeover | $25,000 to $200,000+ per day | Not viable below national brand scale |
| Retargeting site visitors | $0.75 - $1.50 CPC | The one reliably efficient use case |
Format economics and takeover pricing are documented in 2026 X advertising cost guidance, and a review of 111,000 X ads confirms how little structural variation exists between units. Native video earns up to 10x the engagement of link-out posts, and video now accounts for over 80% of X user sessions.
The three jobs X can actually do for a pool company
Ranked by expected return rather than by novelty.
| Use case | Why X fits | Expected outcome | Fit |
|---|---|---|---|
| Recruiting crew, foremen and service techs | Keyword targeting on trade conversations; cheap reach in a labour-tight market | Applications at a fraction of job-board cost | Best fit |
| Retargeting site visitors and gallery viewers | $0.75-$1.50 CPC on warm traffic already in your funnel | Incremental consultations at low cost | Strong |
| Supplier, dealer and commercial B2B visibility | Decision-maker audience, real-time industry conversation | Relationships and inbound partner interest | Strong |
| Real-time moments (heatwaves, local events, openings) | Cheap incremental reach at $6.46 CPM | Brand recall in-market at low cost | Situational |
| Cold residential lead generation | 0.69% visitor-to-lead rate, weak local targeting | High cost per qualified lead | Poor - use Meta or search |
| Ecommerce-style DPA for parts and chemicals | 10-20% lower conversion than Meta DPA, 20-30% lower CPC | Marginal | Only with existing retargeting pools |
Creative rules that move X performance
The measured effects on X are unusually specific, which makes creative decisions easy.
- Upload video natively. Native video earns up to 10x the engagement of a link to an external player.
- Caption everything: 80% of X video views happen with sound off.
- Keep video to 30-60 seconds; six-second bumpers complete at higher rates than 15-second cuts.
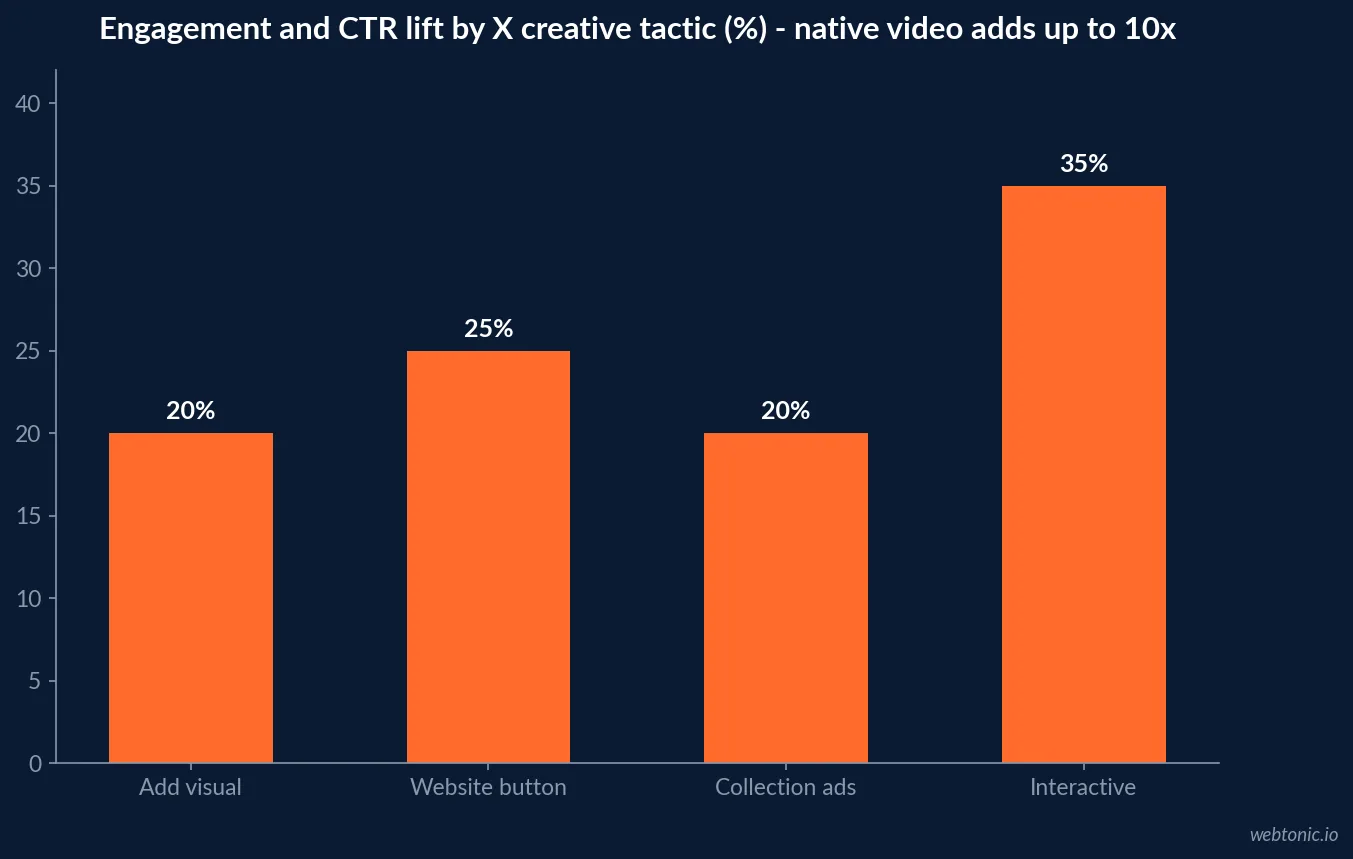
- Add a visual to text posts - high-contrast imagery lifts CTR by 15% to 25%.
- Use interactive elements. Polls and conversation prompts raise engagement by about 35%.
- Refresh creative every seven days in small local audiences; CTR can fall from 3-5% to under 1% within 7 to 14 days at frequency above 7.
- Frequency-cap at three impressions per user per day for local campaigns.
Budget, learning phase and seasonality
Pool demand is violently seasonal, and X spend has to respect both the algorithm's learning needs and the sales calendar.
| Daily budget | What it buys on X | Recommended use | Pool season timing |
|---|---|---|---|
| Under $20/day | Rarely exits learning phase | Avoid | n/a |
| $20 - $50/day | Awareness and recruiting tests | Crew hiring, brand reach | Feb - Aug hiring push |
| $50 - $100/day | Conversion testing with usable data | Retargeting, consultation offers | Mar - Jun demand peak |
| $100 - $250/day | Meaningful local frequency | Only if search and Meta are already maxed | Apr - Jul |
| $1,000 - $2,000 per test | 7-14 days per audience | Minimum honest test | Before peak, not during |
Two budget realities: the first $2,000 of any new campaign carries a 20% to 30% learning tax, and Q4 CPCs inflate 30% to 50% on retail competition - which is also when pool demand collapses in most of North America. There is no reason for a builder to buy X inventory in December.
Measurement, brand safety and the honest risk list
X's reporting flatters itself in specific, documented ways.
| Risk | Documented signal | Mitigation |
|---|---|---|
| Bot-inflated engagement | Reply engagement down ~19% YoY on bot activity | Report on clicks, calls and CRM bookings only |
| Attribution loss | 15-25% of conversions undercounted without a conversion API | Server-side conversion API plus call tracking |
| Over-forecast reach | Campaign Planner over-estimates niche audiences 10-15% | Discount local reach estimates before budgeting |
| Brand adjacency | 52% of advertisers reduced budgets citing safety | Placement exclusions, keyword blocklists, monitored comments |
| Volume ceiling | Campaigns stall at 20-30% impression share in narrow geos | Broaden keyword match types or accept low spend |
| Advertiser flight | Ad revenue fell from $4.4B (2022) to roughly $1.8B | Treat X as a test channel with a fixed cap |
Revenue and advertiser-sentiment context comes from 2026 advertiser analysis and engagement benchmarks from X advertising statistics. If you cannot connect an X click to a booked consultation, you do not have a channel - you have a traffic bill. Our pool building attribution benchmarks cover the tracking layer that makes this judgement possible.
A 90-day X test plan for a pool builder
Structured so a negative result is cheap and a positive one is scalable.
- Days 1-7: install the X pixel and a server-side conversion API, and define one conversion that matters - booked consultation, not form view.
- Days 8-30: run a single retargeting campaign at $50/day against site and gallery visitors. This is the highest-probability win.
- Days 15-45: launch a recruiting campaign at $30/day using keyword targeting on trade and jobs conversations in your metro.
- Days 30-60: test one native video build-reveal at $50/day optimised for video views, then retarget viewers.
- Days 60-90: compare cost per booked consultation with Meta and Google. Kill anything above 1.5x your blended benchmark.
- Ongoing: hold total X spend under 10% of paid budget until it beats Meta on cost per booked build twice in a row.
Home-services cost-per-lead context for that comparison is available in 2026 home service marketing benchmarks, where Google Ads averages $90.92 per lead across trades. If X cannot beat that on qualified leads, it stays a recruiting and retargeting tool - which is a perfectly respectable job. Need help sizing the test? Talk to our team.
What X should never be asked to do
- Carry peak-season lead volume in place of Google Search or Meta.
- Be judged on likes, replies or impressions rather than booked consultations.
- Run without a conversion API, given the 15-25% attribution shortfall.
- Buy takeover inventory at $25,000-plus per day on a regional budget.
- Target audiences under 50,000 users, where frequency spikes and creative burns out in a week.
- Absorb Q4 budget when CPCs rise 30-50% and pool intent is at its annual low.
Frequently Asked Questions
Are X (Twitter) Ads worth it for a pool builder in 2026?
Rarely as a primary lead channel, occasionally as a cheap secondary one. X delivers an average CPC around $0.74 against $1.41 on Meta and a CPM near $6.46 versus $7.19 on Facebook, so traffic is genuinely cheap. But X captures only about 0.2% of global digital ad spend, its visitor-to-lead conversion rate has been measured at 0.69% against LinkedIn's 2.74%, and local-service geo-targeting is less precise than Google or Meta. For pool builders it is a test budget, not a census-filling channel.
What do X Ads cost in the home-improvement category?
Published 2026 ranges put home-improvement CPC around $1.10 with a CPM near $8.20 and CTR about 2.4%, above the platform-wide averages of roughly $0.74 CPC and 0.86% to 1.0% CTR. Engagement-optimised promoted posts run $0.50 to $2.00 per action, video views can be bought under $0.10, and premium Timeline or Trend Takeovers start at $25,000 and reach $200,000-plus per day - irrelevant for a regional builder.
Which pool-building objectives suit X best?
Three: recruiting crew and superintendents, supplier and dealer-side B2B visibility, and cheap incremental reach around real-time moments such as heatwaves and local events. All three exploit X's keyword targeting, which matches live intent signals from posts and searches rather than demographic guesses. Direct residential lead generation is where the channel underperforms Google Search and Meta.
How much should a pool company budget to test X Ads?
Plan on $20 to $50 a day for awareness tests and $50 to $100 a day for conversion tests, with $1,000 to $2,000 spent over 7 to 14 days per audience before judging results. Campaigns under $500 a month rarely exit the learning phase, and the first $2,000 typically carries a 20% to 30% learning tax through inflated CPAs.
What is the biggest risk of advertising on X as a local builder?
Brand adjacency and measurement noise. Roughly 52% of advertisers cut X budgets citing brand-safety concerns, reply engagement fell about 19% year over year because of bot activity, and post-iOS attribution undercounts conversions by an estimated 15% to 25% without a server-side conversion API. Judge X on booked consultations in your CRM, never on likes and replies.
Sources
X Ads platform cost comparison 2026
X (Twitter) advertising cost and format guide 2026
X (Twitter) statistics 2026
X platform statistics from audited filings
X advertising engagement statistics 2026
Analysis of 111,000 X ad creatives
Advertiser sentiment and X ad revenue 2026
Swimming pool industry marketing benchmarks 2026
Pool builder marketing benchmarks 2026
Home service marketing benchmarks 2026