



Table of contents
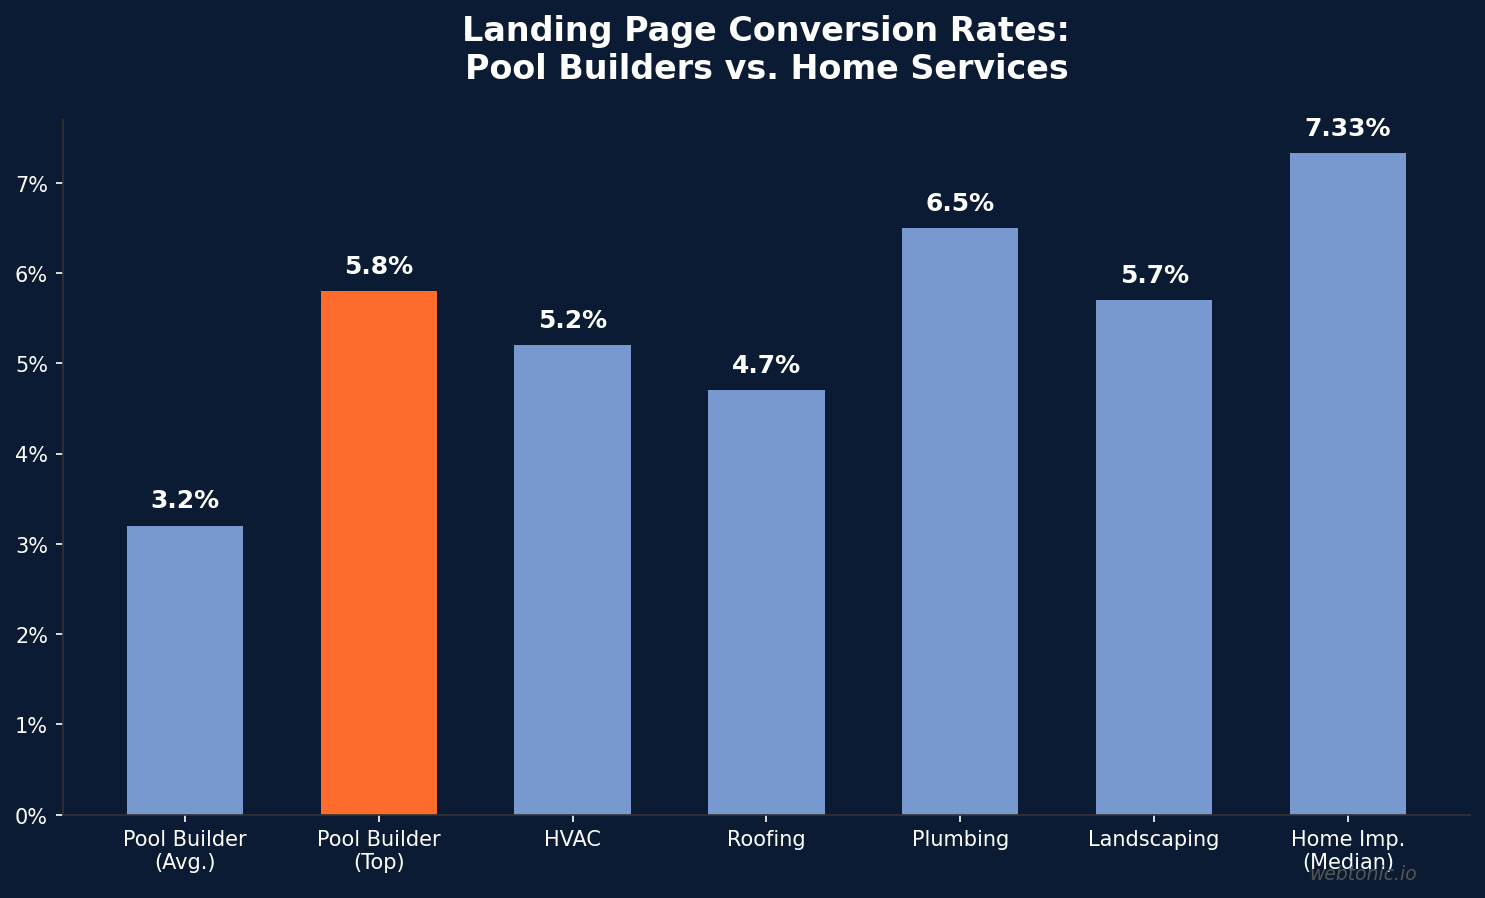
Pool builders spend thousands each month driving traffic to their websites, yet most lose the vast majority of visitors before a single form gets submitted. The average pool builder website converts just 3.2% of its visitors into leads — meaning roughly 97 out of every 100 paid clicks produce zero return.
Key Takeaways
- Pool builder websites average a 3.2% conversion rate, while top-performing dedicated landing pages reach 5.8% or higher (CuFinder).
- 68.5% of pool company website traffic comes from mobile devices, yet 96% of pool builder sites score poorly on mobile page speed tests (Patrick Herbert).
- Home improvement landing pages convert at a 7.33% median across sub-verticals, outpacing pool builders significantly (WordStream).
- Reducing form fields from 7+ to 3–5 boosts conversions by 30–50% according to 2026 form benchmarks (Digital Applied).
- Blue Haven Pools achieved a 14% conversion rate using a dedicated lead capture tool and optimized page design (Canibuild).
- Pages loading in under 2.5 seconds convert at 6.8% — nearly double the rate of slower pages (Onwardcraft).
- Tested landing pages outperform untested pages by 25–40% on CPL, proving the value of systematic optimization.
- Pool builder cost per lead ranges from $55 to $140 by region, with California the most expensive market (DG Agency).
The swimming pool construction market is valued at $24.8 billion in the United States, with a 3.0% compound annual growth rate driving steady demand across residential pools and commercial pools alike (Reports and Data). With over 14 million swimming pools nationwide — including both in-ground pools and above-ground pools — and approximately 60,000 new in-ground pool installations each year, the pool construction market offers substantial opportunity for builders who can convert online interest into qualified consultations. States like California, Florida, Texas, and Arizona account for the largest share of new pool ownership, making these markets both the most competitive and the most lucrative for landing page optimization.
Pool Building Landing Page Benchmarks at a Glance
Below is a snapshot of the most critical landing page metrics pool builders should track. These swimming pool statistics and benchmarks are compiled from industry surveys and platform data covering home services and the broader swimming pool construction sector.
| Metric | Pool Builder Avg. | Top Performers | Industry Median |
|---|---|---|---|
| Website Conversion Rate | 3.2% | 5.8%+ | 6.6% (all industries) |
| Home Improvement LP CVR | 3.71% (search ads) | 10%+ | 7.33% (WordStream) |
| Mobile Traffic Share | 68.5% | — | 71–76% (contractors) |
| Mobile PageSpeed Pass Rate | 4% | — | — |
| Avg. Page Load Time | 4.2s | Under 2.5s | 3.0s |
| Lead-to-Sale (Construction) | 8–12% | 14% (Blue Haven) | — |
| Lead-to-Sale (Service) | 35–40% | — | — |
| CPL (Google Ads) | $55–$140 | $35–$55 (service) | — |
Conversion Rate Breakdown by Page Type
Not all pages convert equally. Pool builders running dedicated landing pages with a single call-to-action consistently outperform generic multi-purpose homepages. The median conversion rate for home services landing pages sits at 6.7%, with the top 25% of performers exceeding 17.6% (Barham Marketing). The gap between top and bottom performers is enormous, and the primary differentiator is page focus.
For swimming pool building companies specifically, the pool construction data reveals a clear hierarchy of page types ranked by lead generation effectiveness:
| Page Type | Median CVR | Top 25% | Notes |
|---|---|---|---|
| Homepage (multi-purpose) | 1.8–2.5% | 4.2% | Too many navigation choices dilute focus |
| Service page (pool construction) | 2.8–3.5% | 5.1% | Better than homepage, still broad |
| Dedicated landing page | 5.8–6.7% | 17.6% | Single CTA, social proof, minimal nav |
| Quote request funnel | 7.5–9.2% | 14%+ | Multi-step forms outperform single-step |
| Free consultation page | 8.1–10.3% | 15.2% | High-value offer drives completions |
Pool companies using dedicated landing pages generate 2–3× more leads per advertising dollar than those relying on homepage traffic. The critical difference is focus: a dedicated landing page removes navigation menus, limits choices to a single action, and reinforces the visitor's original search intent with headlines that match the ad copy. According to Unbounce, message match between ad and landing page headline alone can boost conversions by 25–35%.
Mobile Optimization: The Biggest Conversion Leak
Mobile traffic dominates the pool building industry, and the performance gap between mobile-optimized and non-optimized pages is widening every year. 68.5% of all pool builder website visits come from smartphones, and for swimming pool maintenance, pool cleaning, and emergency pool service searches that figure climbs past 80% (CuFinder). Despite this reality, the industry's mobile readiness remains alarmingly poor:
- 96% of pool builder websites are considered slow on mobile — scoring below acceptable thresholds on Google's PageSpeed Insights (Patrick Herbert).
- 72% of pool company sites receive a speed performance score of C or lower, indicating systemic performance issues across the industry that go well beyond individual optimization mistakes.
- A 1-second delay in page load time can reduce conversions by up to 20% and increase bounce rates by 32%, compounding the loss with every additional tenth of a second (Onwardcraft).
- Pages loading in under 2.5 seconds convert at 6.8%, nearly double the 3.5% rate observed for sites taking 4+ seconds to render.
- 60% of mobile searchers call a business directly from search results, making click-to-call functionality essential on pool builder mobile pages.
For pool builders investing $5,000–$15,000 per month in paid advertising, a slow mobile page effectively burns 30–50% of that ad budget on visitors who leave before the page finishes loading. Fixing mobile load times is often the single highest-ROI improvement a swimming pool company can make before touching ad copy, targeting settings, or bid strategies.
Form Design and Lead Capture Optimization
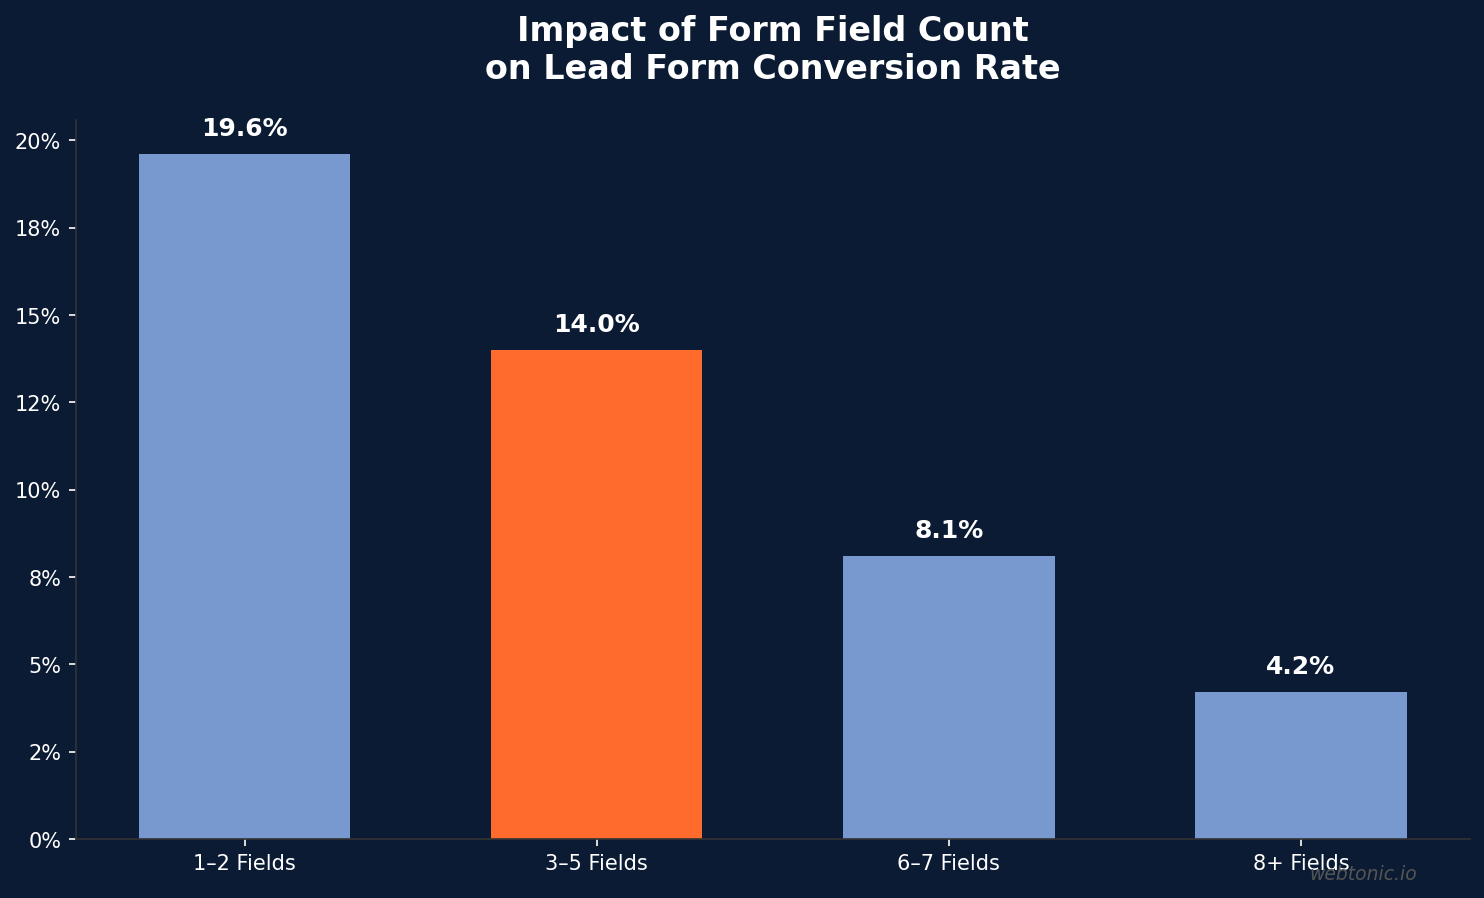
The number of fields on a lead capture form directly impacts how many visitors complete it. Research from Digital Applied based on over 100 data points shows that forms with 3–5 fields deliver the best conversion rates for home improvement leads, balancing volume with lead quality effectively.
| Field Count | Median CVR | Lead Quality | Best For |
|---|---|---|---|
| 1–2 fields | 19.6% | Low (name/email only) | Newsletter signups, top-of-funnel offers |
| 3–5 fields | 13.2–14.8% | Medium-High | Quote requests, pool consultations |
| 6–7 fields | 8.1% | High | Detailed project scoping for custom builds |
| 8+ fields | 4.2% | Very High but low volume | Custom builder pre-qualification |
Multi-step forms outperform single-step forms by 14% on average. By breaking a 6-field form into two screens — basic contact information first, then project details on the second step — pool builders reduce perceived friction while still collecting the data their sales teams need to qualify leads and prioritize follow-up. For swimming pool construction inquiries, adding a progress bar showing "Step 1 of 2" further increases completion rates by setting clear expectations for the visitor.
Social Proof and Trust Signals That Convert
Pool construction is a high-consideration purchase with average project costs exceeding $65,909 nationally (PHTA). Homeowners need substantial reassurance before committing even to a free consultation. The data clearly shows that trust elements significantly move conversion metrics:
- Pages with customer reviews positioned near the form convert 15–35% higher than those without any visible social proof elements.
- Before-and-after project galleries increase click-through rates by up to 42% when positioned above the fold on pool builder landing pages (CuFinder).
- Trust badges (BBB accreditation, licensed/insured seals, warranty icons) placed near CTAs boost conversions by 12–18% across home services verticals.
- Video testimonials embedded on landing pages increase time on page by 88% and form completion rates by 21% compared to text-only pages.
- Displaying a specific project count (e.g., "1,200+ pools built since 2005") performs 23% better than generic claims like "trusted pool builder."
For pool builders, the combination of visual project proof and written customer testimonials is more effective than either element alone. Companies displaying 10+ completed project photos alongside 4.5+ star ratings see the highest engagement and lowest bounce rates in the swimming pool construction vertical.
Pool Building vs. Other Home Services: Landing Page Comparison
How do pool builder landing pages stack up against other residential service industries? The comparison reveals both the challenge and the opportunity for swimming pool companies looking to improve their digital conversion funnel.
| Industry | Median LP CVR | Avg. CPL | Mobile Traffic % |
|---|---|---|---|
| Pool Building (Construction) | 3.2–5.8% | $55–$140 | 68.5% |
| HVAC | 4.1–6.2% | $40–$85 | 74% |
| Roofing | 3.8–5.5% | $45–$95 | 72% |
| Plumbing | 5.2–7.8% | $30–$65 | 78% |
| Landscaping | 4.5–6.9% | $35–$70 | 65% |
| Home Improvement (all) | 7.33% | $45–$90 | 71–76% |
Swimming pool builders trail behind most home services verticals in raw landing page conversion rate, largely due to the higher consideration threshold and significantly longer sales cycle. The average swimming pool construction sales cycle runs 60–90 days from first inquiry to signed contract, compared to 1–7 days for emergency HVAC or plumbing repairs (DG Agency). This makes follow-up email sequences and retargeting pixels especially critical for pool company landing pages — a first visit that does not convert immediately is not necessarily a lost lead if proper nurturing systems are in place. The long-term nature of pool construction decisions means that retargeting visitors across the swimming pool research journey is critical for capturing demand.
Swimming Pool Market and Ownership Trends
Understanding the broader swimming pool market provides critical context for landing page strategy. Pool ownership in the United States has reached 14.4 million residential pools and over 309,000 public and commercial pools, creating a massive addressable market for pool construction and pool service companies. Key swimming pool statistics that shape landing page demand include:
- The global swimming pool market is projected to reach $34.8 billion by 2030, driven by demand for residential pools in North America, Europe, and the Asia Pacific region.
- Approximately 60,000 new in-ground pools are installed annually in the United States, with above-ground pool sales adding another 200,000+ units per year.
- The average cost of an in-ground pool ranges from $35,000 to $100,000+, making swimming pool construction one of the highest-value residential purchases homeowners research online.
- 64% of swimming pool industry revenue comes from maintenance rather than new construction, meaning pool service landing pages serve a larger addressable market than construction pages alone.
- Pool ownership is concentrated in Sun Belt states — California, Florida, Texas, and Arizona account for the majority of both new pool construction demand and pool maintenance searches.
These swimming pool ownership trends directly impact landing page strategy. Pool builders in high-demand markets face more competition for ad clicks, making conversion rate optimization essential for controlling cost per lead. The high average project value for swimming pool construction means that even small conversion rate improvements translate into significant revenue gains.
CRO Best Practices Supported by Pool Industry Data
The highest-converting pool builder landing pages share common structural elements. Based on case studies and benchmark data from across the swimming pool industry, here are the optimizations with the largest measured impact on conversion rates:
- Message match between ad headline and landing page headline — Pages with direct keyword-to-headline alignment convert 25–35% higher than generic pages receiving the same traffic (COREPPC).
- Single, clear call-to-action per page — Removing navigation menus and secondary links from the landing page increases conversions by 20–30% on average across home services verticals.
- Sub-3-second mobile load time — Fast-loading pages convert at 6.8% vs. 3.2% for slower alternatives, a difference that compounds with every dollar spent on traffic acquisition.
- Social proof above the fold — Placing star ratings, review count, and one testimonial visible without scrolling lifts form completions by 15–22%.
- Click-to-call button on mobile layouts — 60% of mobile searchers in home services call a business directly from the search results page; making the phone number tappable captures leads that online forms miss entirely.
- Multi-step form with progress indicator — Breaks perceived friction while maintaining lead quality, delivering a 14% conversion lift over single-step forms of equivalent length.
Blue Haven Pools applied several of these principles and boosted its overall conversion rate from under 3% to 14% — a 4.7× improvement — by deploying a purpose-built lead capture tool with dynamic pool project visualization (Canibuild). The case study demonstrates that even modest CRO investments can dramatically transform lead economics for pool building companies.
Cost Per Lead and ROI by Region
Landing page performance varies significantly by geographic market. Pool builders in competitive Sun Belt states face higher costs per lead but also higher average project values, creating strong ROI even in expensive markets:
| Region | CPL Range (Google Ads) | Avg. Project Value | Implied ROI per Lead |
|---|---|---|---|
| California (LA, OC, SD) | $65–$120 | $72,000–$95,000 | 600–1,460× |
| Florida (Tampa, Orlando, Miami) | $70–$140 | $55,000–$80,000 | 390–1,140× |
| Texas (DFW, Houston, Austin) | $55–$110 | $50,000–$75,000 | 450–1,360× |
| Arizona (Phoenix, Tucson) | $55–$95 | $48,000–$68,000 | 505–1,236× |
| Southeast (GA, NC, SC) | $40–$75 | $45,000–$65,000 | 600–1,625× |
Even at the highest cost per lead, pool builder landing page ROI remains exceptionally strong because the average project value dwarfs acquisition costs. A pool company converting 10% of its $100 leads at a $65,000 average project value generates $6,500 in revenue per marketing dollar spent — before factoring in lifetime service contract revenue averaging $2,400 over three years (World Metrics). Investing in landing page optimization amplifies this return by increasing conversion rates without increasing traffic spend. As pool ownership continues growing across the United States — particularly in high-demand states like Florida, California, and Texas — the long-term value of optimized landing pages compounds with market expansion.
Related reading
- Personal Injury Law Landing Pages & CRO Trends: Data-Driven Insights for 2026
- Pest Control Landing Page Statistics: Conversion Benchmarks & Data (2026)
- 60+ Statistics Shaping Landing Pages & CRO in the Phone & Tech Retail Industry (2026)
- Landing Page Design services at Web Tonic
FAQ: Frequently Asked Questions
What is the average landing page conversion rate for pool builders?
The average pool builder website converts at roughly 3.2%, while top-performing dedicated landing pages reach 5.8% or higher. Home improvement landing pages across all verticals convert at a median of 6.7%, suggesting room for pool companies to close the gap with focused CRO efforts.
How does mobile speed affect pool builder landing page conversions?
A 1-second delay in mobile load time can reduce conversions by up to 20%. With 68.5% of pool builder traffic coming from mobile devices and 96% of pool company websites scoring poorly on mobile speed tests, optimizing load times is one of the highest-ROI improvements a pool builder can make.
How many form fields should a pool builder landing page have?
Landing pages with 3 to 5 form fields deliver the best balance of lead quality and volume for pool builders. Forms with more than 7 fields see conversion rates drop by 30 to 50 percent, while single-field forms generate lower-quality leads that rarely convert to consultations.
Does adding social proof increase pool builder landing page conversions?
Yes. Adding customer reviews, project photos, and trust badges near the form can increase landing page conversions by 15 to 35 percent. Pool companies that display before-and-after galleries alongside testimonials see the highest engagement, with click-through rates rising by up to 42%.
What is the cost per lead from pool builder landing pages?
Swimming pool builder cost per lead varies by region and channel across the pool construction market. Google Ads landing pages produce leads at $55 to $140 depending on market. Optimized landing pages with systematic testing typically reduce CPL by 25 to 40 percent compared to sending paid traffic to a generic homepage.
For pool builders looking to improve their digital marketing strategy beyond landing page optimization, explore our guides on growth marketing services, Google Ads pricing, and performance creative. See also our data intelligence capabilities for conversion tracking and analytics setup.
Sources
https://cufinder.io/blog/benchmarks/swimming-pool/
https://canibuild.com/en-au/resources/insights/blue-haven-pools-leadconverter-case-study/
https://barhammarketing.com/27-home-services-conversion-rate-statistics-for-2026/
https://unbounce.com/conversion-benchmark-report/
https://www.wordstream.com/blog/conversion-rate-benchmarks
https://www.digitalapplied.com/blog/form-conversion-rate-benchmarks-2026-data-points
https://onwardcraft.com/blog/contractor-website-study/
https://dgagency.co/blog/pool-builder-marketing-cost-2026
https://phta.org/about/
https://worldmetrics.org/swimming-pool-statistics/


