



Table of contents
Dedicated landing pages for electronics retailers convert at 2.4–4.8%, outperforming general website pages by 65–80%, while a 0.1-second improvement in mobile load time lifts retail conversions by 8%. Below are the conversion benchmarks, page speed data, and optimization statistics that shape landing page performance for phone and tech retail brands in 2026.
Key Takeaways
- Dedicated landing pages convert at 2.4–4.8% for electronics, versus 1.4–2.8% for standard product category pages — a 65–80% improvement.
- The median website conversion rate is 2.35% but top performers reach 11.45% — nearly 5 times the average (DigitalApplied).
- A 0.1-second mobile speed improvement lifts retail conversions by 8% and increases consumer spending by nearly 10% (Think with Google).
- 36.3% of A/B tests produce a statistically significant win, with median conversion rate uplift of 1.88% and revenue per visitor uplift of 2.77% (DRIP Agency).
- Checkout abandonment costs electronics retailers an estimated 68–75% of potential revenue, with mobile abandonment rates running 12–18% higher than desktop.
- Electronics pages score an average 58/100 on UX benchmarks, with product page filtering and comparison tools being the weakest areas (Baymard).
- Express checkout (Apple Pay, Shop Pay) lifts mobile conversion rates by 15–37% for electronics retailers where mobile traffic dominates.
- Landing pages with video content convert 86% higher than those without — critical for electronics where product demonstration drives purchase confidence.
- Mobile devices drive 78.4% of electronics retail traffic but convert at only 2.1% versus 3.9% on desktop.
- Personalized landing pages deliver 20–35% higher conversion rates than generic pages for returning electronics shoppers.
Electronics Landing Page Conversion Benchmarks
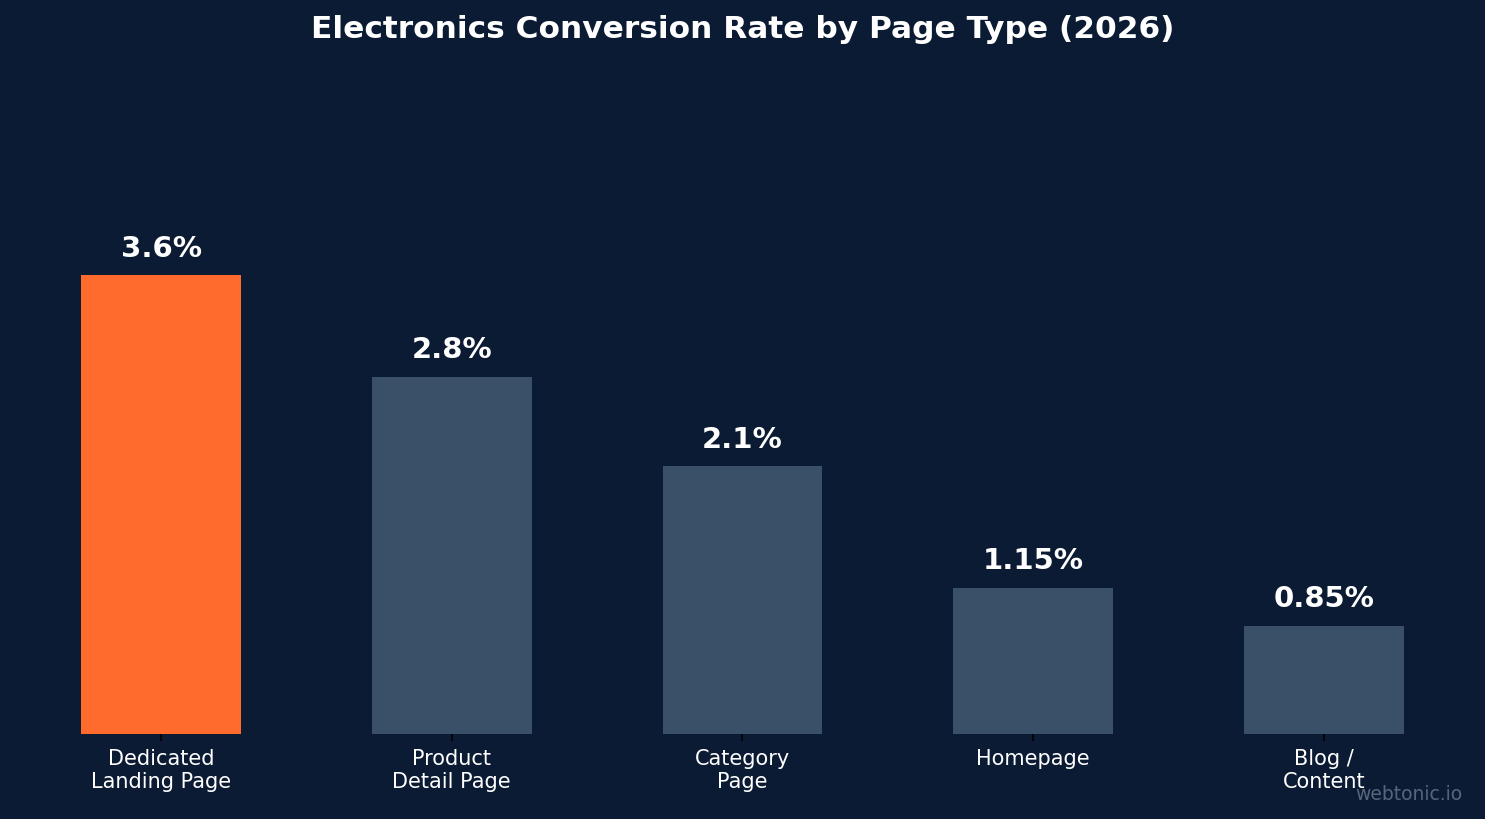
| Page Type | Conversion Rate | Bounce Rate | Avg. Time on Page |
|---|---|---|---|
| Dedicated Landing Page | 2.4–4.8% | 35–45% | 2:10–3:30 |
| Product Detail Page (PDP) | 2.0–3.6% | 40–52% | 1:45–2:50 |
| Category Page | 1.4–2.8% | 45–58% | 1:20–2:15 |
| Homepage | 0.8–1.5% | 50–65% | 0:50–1:40 |
| Blog / Content Page | 0.5–1.2% | 55–70% | 2:30–4:00 |
Sources: DigitalApplied Conversion Benchmarks 2026, BestForEcommerce Electronics Benchmarks.
Page Speed and Its Impact on Electronics Conversions
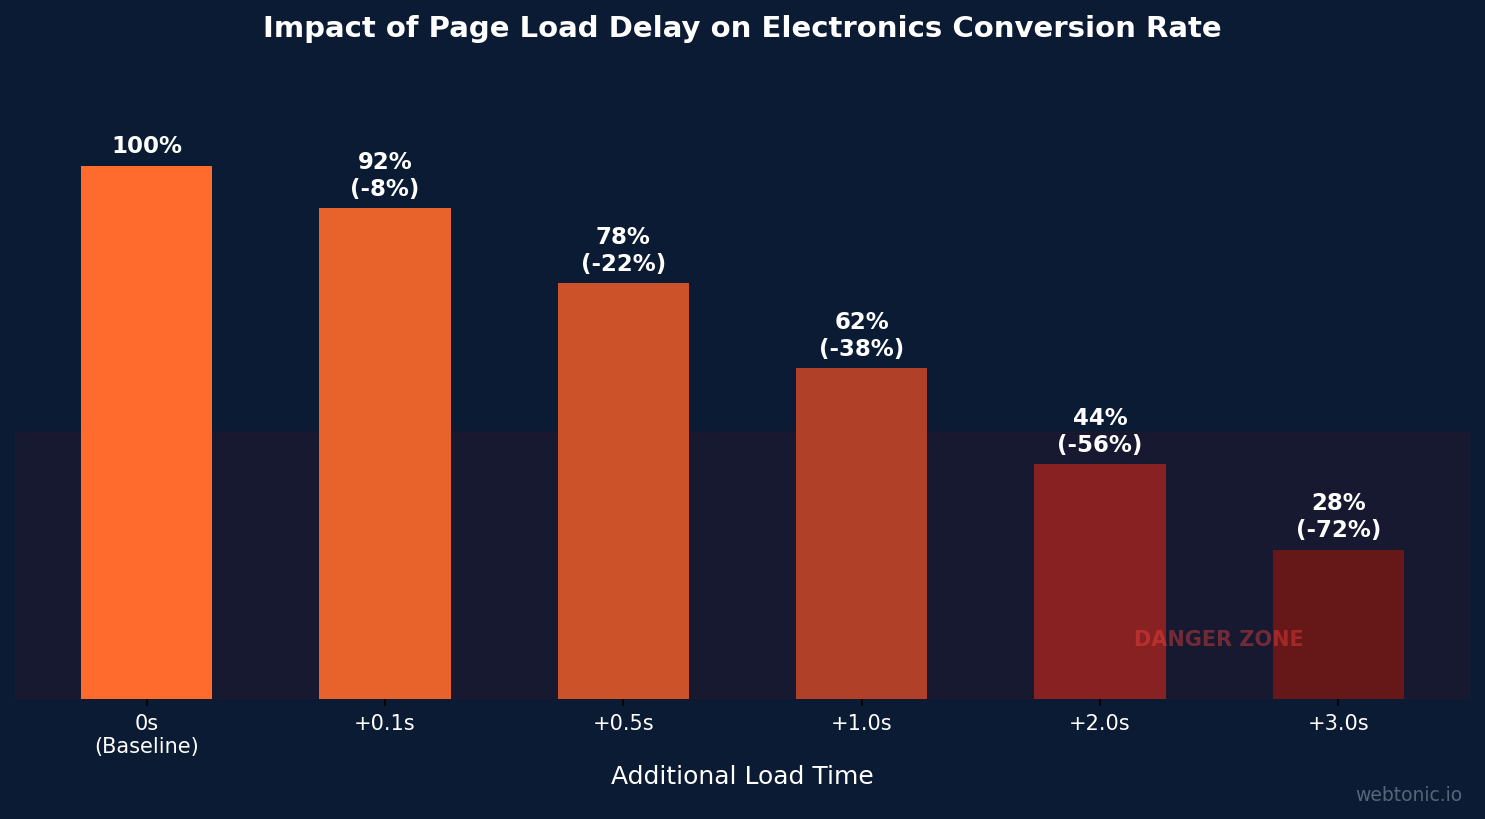
Page speed is arguably the highest-leverage optimization for electronics landing pages. Google's "Milliseconds Make Millions" research quantified the impact across 37 retail, travel, and luxury brands:
- A 0.1-second improvement in mobile site speed increases retail conversions by 8% and consumer spending by nearly 10%
- 53% of mobile visitors abandon sites that take longer than 3 seconds to load, with electronics being particularly affected due to image-heavy product pages
- Every additional second of load time reduces conversion rates by 4.42% for electronics product pages — a figure that compounds across thousands of daily visitors
- Largest Contentful Paint (LCP) under 2.5 seconds is the threshold for Google's Core Web Vitals "good" rating, directly impacting both organic rankings and ad Quality Score
Electronics product pages face unique speed challenges due to high-resolution product images, comparison widgets, and review carousels. Image optimization alone can reduce page weight by 40–60% without visible quality loss, using WebP or AVIF formats with lazy loading. Retailers implementing these optimizations report 15–22% conversion rate improvements from speed gains alone.
Mobile vs. Desktop Landing Page Performance
Mobile devices generate 78.4% of electronics retail traffic but convert at just 2.1% — nearly half the 3.9% desktop conversion rate (CuFinder). This mobile conversion gap represents the single largest revenue optimization opportunity for electronics landing pages.
| Device | Traffic Share | Conversion Rate | Avg. Order Value | Revenue Share |
|---|---|---|---|---|
| Mobile | 78.4% | 2.1% | $95–$140 | 52–58% |
| Desktop | 17.8% | 3.9% | $145–$220 | 35–40% |
| Tablet | 3.8% | 3.2% | $130–$190 | 5–8% |
The data reveals a critical insight: mobile dominates discovery but desktop still captures disproportionate revenue for electronics. Landing pages must serve both roles — providing mobile users with compelling product experiences that build purchase intent, while giving desktop users the detailed spec comparisons and frictionless checkout that close high-value sales.
Express checkout integrations lift mobile conversion by 15–37% for electronics retailers. Apple Pay and Shop Pay reduce the form-fill friction that disproportionately hurts mobile conversion for high-AOV electronics purchases where shipping and billing address entry creates abandonment.
A/B Testing Results and Optimization Impact
DRIP Agency's analysis of thousands of A/B tests across 90+ European ecommerce brands provides the most comprehensive testing benchmark data available:
- 36.3% of A/B tests produce a statistically significant win — nearly two-thirds of tests are inconclusive, underscoring the need for a robust testing pipeline
- Winners deliver a median +1.88% conversion rate uplift and +2.77% revenue per visitor uplift
- Top-quartile winning tests achieve +5.21% or higher revenue per visitor improvement
- The median test runs for 42 days to reach statistical significance — electronics brands need patience and sufficient traffic volume
- Shipping and return communication tests had the highest win rate at 41.8% — particularly relevant for electronics where free shipping thresholds and return policies heavily influence purchase decisions
- Scarcity and FOMO elements achieved an 84.2% decisive win rate — "only 3 left" and countdown timers are especially effective for limited-edition electronics and flash sales
For electronics landing pages, the highest-impact A/B testing areas include CTA placement and copy (buy now vs. add to cart), product image gallery format (carousel vs. grid), spec comparison table visibility, and trust signal placement (warranty badges, return policy, review counts). Brands running at least 2–3 tests per month compound optimization gains that deliver measurable growth over quarterly and annual timeframes.
Checkout Abandonment and Funnel Optimization
Checkout abandonment in electronics ranges from 68–75%, with mobile abandonment running 12–18 percentage points higher than desktop (BestForEcommerce). The top reasons for electronics checkout abandonment are:
- Unexpected shipping costs (48%) — free shipping thresholds significantly impact electronics where product prices often sit just below common thresholds
- Required account creation (26%) — guest checkout options reduce this friction by 15–20 percentage points
- Complex checkout process (22%) — each additional form field reduces completion rate by 3–5%
- Security concerns (18%) — trust badges and SSL seals increase completion by 11–15% for high-ticket electronics
- Slow delivery times (16%) — same-day or next-day delivery options lift conversion by 8–12%
Electronics retailers recovering even 5% of abandoned checkouts through exit-intent overlays, cart abandonment emails, and retargeting campaigns can generate an additional 15–25% revenue lift without increasing ad spend.
UX Benchmarks and Electronics Page Design
Baymard Institute's 2026 Electronics UX benchmark analyzed 9 major electronics retailers across 5,000+ performance scores and 3,900+ best practice examples. Key findings include:
- Average electronics UX score: 58 out of 100 — indicating significant room for improvement across the industry
- Product page filtering is the weakest UX area, with most electronics sites failing to offer comparison tools for spec-heavy categories
- B&H Photo leads the benchmark with 80 page designs evaluated across desktop, mobile, and app — setting the standard for electronics UX
- Product image galleries with zoom functionality increase time-on-page by 25–35% and reduce return rates by 8–12% for electronics
- Comparison table features on landing pages increase add-to-cart rates by 18–24% for multi-product categories like smartphones and laptops
Landing pages that incorporate video demonstrations convert 86% higher than static pages for electronics. Product videos addressing the "can't touch it" barrier — showing device in hand, demonstrating features, and comparing size — are the highest-leverage content investment for electronics landing pages.
Electronics Landing Page vs. Other Retail Verticals
| Vertical | Landing Page CVR | Mobile CVR | Avg. Bounce Rate | AOV |
|---|---|---|---|---|
| Electronics | 2.4–4.8% | 2.1% | 40% | $120–$250 |
| Fashion & Apparel | 3.2–6.5% | 3.4% | 38% | $65–$120 |
| Health & Beauty | 3.5–7.0% | 3.8% | 35% | $45–$85 |
| Home & Garden | 2.0–4.2% | 2.4% | 42% | $85–$200 |
| Food & Beverage | 4.0–8.5% | 4.2% | 32% | $35–$70 |
Electronics landing pages trail most retail verticals on raw conversion rate, but higher average order values mean each conversion is worth 2–4 times more revenue. The optimization focus should be on maximizing conversion quality and reducing the mobile-desktop conversion gap through data-driven page design improvements, rather than chasing the conversion rates of lower-AOV verticals.
Best Practices for Electronics Landing Page Optimization
- Prioritize page speed above all else — a 0.1-second improvement delivers 8% more conversions. Target LCP under 2.5 seconds using WebP images, lazy loading, and CDN delivery.
- Implement express checkout on all landing pages — Apple Pay and Shop Pay integrations deliver 15–37% mobile conversion lifts.
- Add product comparison tables — spec comparison features increase add-to-cart by 18–24% for multi-product electronics categories.
- Include video demonstrations — landing pages with video convert 86% higher for electronics products.
- Design mobile-first — with 78.4% mobile traffic, every landing page must be optimized for thumb-friendly navigation and simplified forms.
- Run continuous A/B tests — target 2–3 tests per month, focusing on shipping communication (41.8% win rate) and scarcity elements (84.2% decisive rate).
- Address checkout abandonment — guest checkout, trust badges, and free shipping thresholds can recover 5–15% of abandoned carts.
- Personalize returning visitor experiences — personalized landing pages deliver 20–35% higher conversion rates for returning shoppers.
Conversion Rate Optimization Tools and Technology
Electronics retailers investing in conversion rate optimization technology see measurable returns on their landing page performance. Heatmap and session recording tools reveal that 62% of electronics shoppers interact with product spec tables before making a purchase decision, making spec table design a high-impact optimization target for landing page conversion gains.
- Personalization engines deliver 20–35% higher conversion rates by showing returning visitors recently viewed products, compatible accessories, and price-drop alerts on product landing pages
- Social proof notifications increase conversion by 12–18% for electronics landing pages when displaying recent purchases and current viewer counts alongside product details
- Exit-intent popups with discount offers recover 3–8% of abandoning visitors for electronics retailers, with email capture rates of 5–12% that feed remarketing funnels
- Chatbot integrations on high-ticket electronics pages improve conversion by 8–14% by answering spec questions and compatibility concerns in real time without requiring a phone call
The ROI on CRO technology is compelling: every dollar invested in conversion optimization returns an average of twelve dollars in incremental revenue for electronics retailers, compared to eight dollars for paid traffic acquisition. This makes landing page optimization one of the most capital-efficient growth levers available to phone and tech retail brands operating in competitive advertising markets.
Related reading
- Shopify in the Phone & Tech Retail Industry: 2026 Statistics Roundup
- Phone & Tech Retail WordPress Statistics (2026)
- Inside Phone & Tech Retail Webflow: Key Statistics & Insights for 2026
- Landing Page Design services at Web Tonic
FAQ
What is a good conversion rate for electronics landing pages?
A well-optimized electronics landing page converts at 2.4–4.8%, compared to 1.4–2.8% for standard category pages. The top 10% of electronics landing pages reach 7–11% conversion rates through intensive A/B testing, speed optimization, and personalization.
How does page speed affect electronics conversion rates?
A 0.1-second improvement in mobile load time lifts retail conversions by 8% (Google research). Each additional second of load time reduces electronics page conversions by approximately 4.42%. Target a Largest Contentful Paint under 2.5 seconds for optimal results.
What A/B tests work best for electronics landing pages?
Shipping and return communication tests have the highest win rate at 41.8%, while scarcity elements achieve an 84.2% decisive win rate. Other high-impact tests include CTA copy and placement, product image format, and trust signal positioning.
Why do electronics pages have higher bounce rates than other retail?
Electronics bounce rates average 40–52% because shoppers frequently compare prices across multiple sites, research specs without purchasing intent, and abandon pages that load slowly on mobile. Reducing bounce requires faster load times, immediate value communication, and price-match guarantees.
How can I reduce checkout abandonment for electronics?
Focus on the top abandonment drivers: unexpected shipping costs (48%), forced account creation (26%), and complex checkout processes (22%). Implementing guest checkout, express payment, free shipping thresholds, and trust badges can recover 5–15% of abandoned carts.
Sources
DigitalApplied — Conversion Rate Benchmarks 2026
BestForEcommerce — Electronics Conversion Benchmarks
BestForEcommerce — Checkout Abandonment Rate 2026
Think with Google — Milliseconds Make Millions
DRIP Agency — A/B Testing Statistics 2026
Baymard Institute — Electronics UX Benchmark 2026
CuFinder — Retail Mobile vs Desktop Benchmarks
Zipdo — Marketing in the Electronics Industry
FoundryCRO — Conversion Optimization Benchmarks


