



Table of contents
Key Takeaways
- Pool builders earn $36–$42 for every $1 spent on email campaigns, outperforming most digital channels in direct ROI for seasonal service businesses.
- Automated drip sequences generate 320% more revenue per email than one-off promotional blasts for pool service companies.
- The average open rate for pool and home-service emails sits at 23.4%, with segmented lists reaching 28.6% — 22% above the industry mean.
- Pool companies using seasonal email automation see a 47% increase in spring booking rates compared to those relying on manual outreach alone.
- Email-driven referral campaigns produce leads at $8–$15 cost per acquisition, roughly one-tenth the price of paid search leads in pool construction.
- Re-engagement emails recover 12–18% of lapsed pool maintenance customers, adding $180–$340 in average annual contract value per reactivated account.
Pool Building Email Marketing Benchmarks at a Glance
The table below consolidates 2026 email performance data for pool builders and home-service contractors, drawn from Campaign Monitor, Mailchimp, and sector-specific surveys. Pool companies consistently outperform the all-industry average on open and click-through rates, driven by seasonal urgency and high relevance of maintenance reminders.
| Metric | Pool / Home-Service Avg. | All-Industry Avg. |
|---|---|---|
| Open Rate | 23.4% | 21.3% |
| Click-Through Rate (CTR) | 3.18% | 2.62% |
| Click-to-Open Rate (CTOR) | 13.6% | 10.5% |
| Unsubscribe Rate | 0.17% | 0.26% |
| Bounce Rate | 0.68% | 0.40% |
| Revenue per Email | $0.18 | $0.11 |
| List Growth Rate (monthly) | 2.4% | 1.8% |
| Email ROI (per $1 spent) | $36–$42 | $36–$40 |
Email ROI for Pool Companies: Why the Channel Still Leads
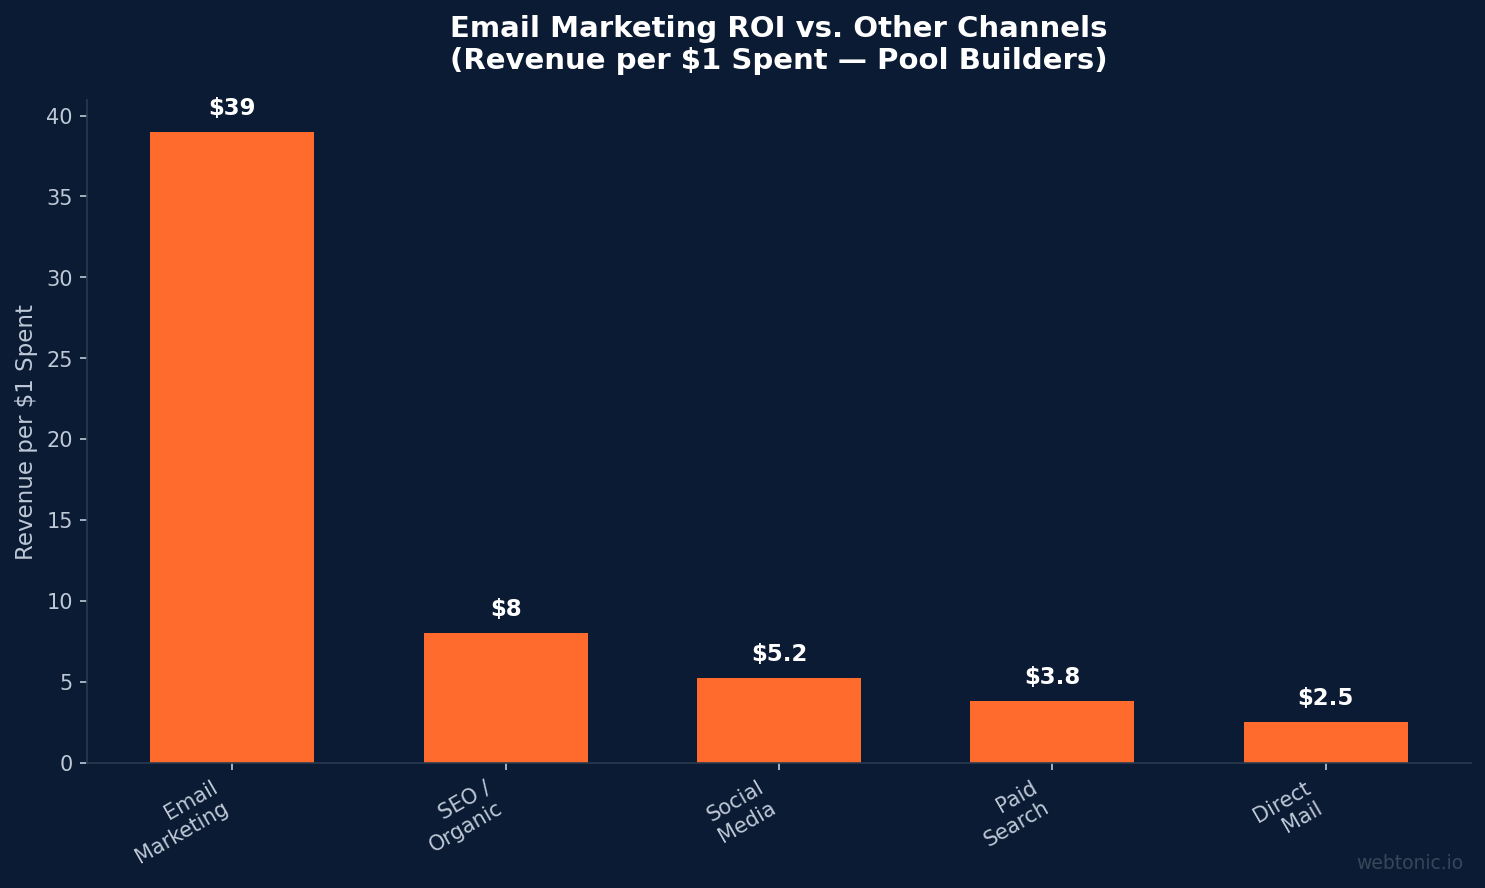
Email marketing consistently delivers the highest return on investment among digital channels for pool builders, with industry data confirming $36–$42 revenue for every dollar spent (Litmus, 2026). The channel's efficiency stems from its direct reach: 91% of pool-service customers check email daily, and maintenance reminders carry inherent urgency that lifts engagement above generic retail campaigns.
Compared to paid search — where pool construction keywords average $7.50–$11 per click (M.Wolf Media) — email's near-zero marginal send cost makes it the most budget-friendly lead-nurture tool available. A mid-size contractor list of 5,000 contacts on a $50/month platform generates roughly $900 in attributable revenue per campaign send, based on median pool-service transaction values of $2,400 lifetime (Reports and Data).
For pool companies investing in growth marketing strategies, email serves as the connective tissue between acquisition channels and customer retention, amplifying the value of every lead generated through search, social, or referral sources.
Open Rates and Click-Through Rates by Email Type
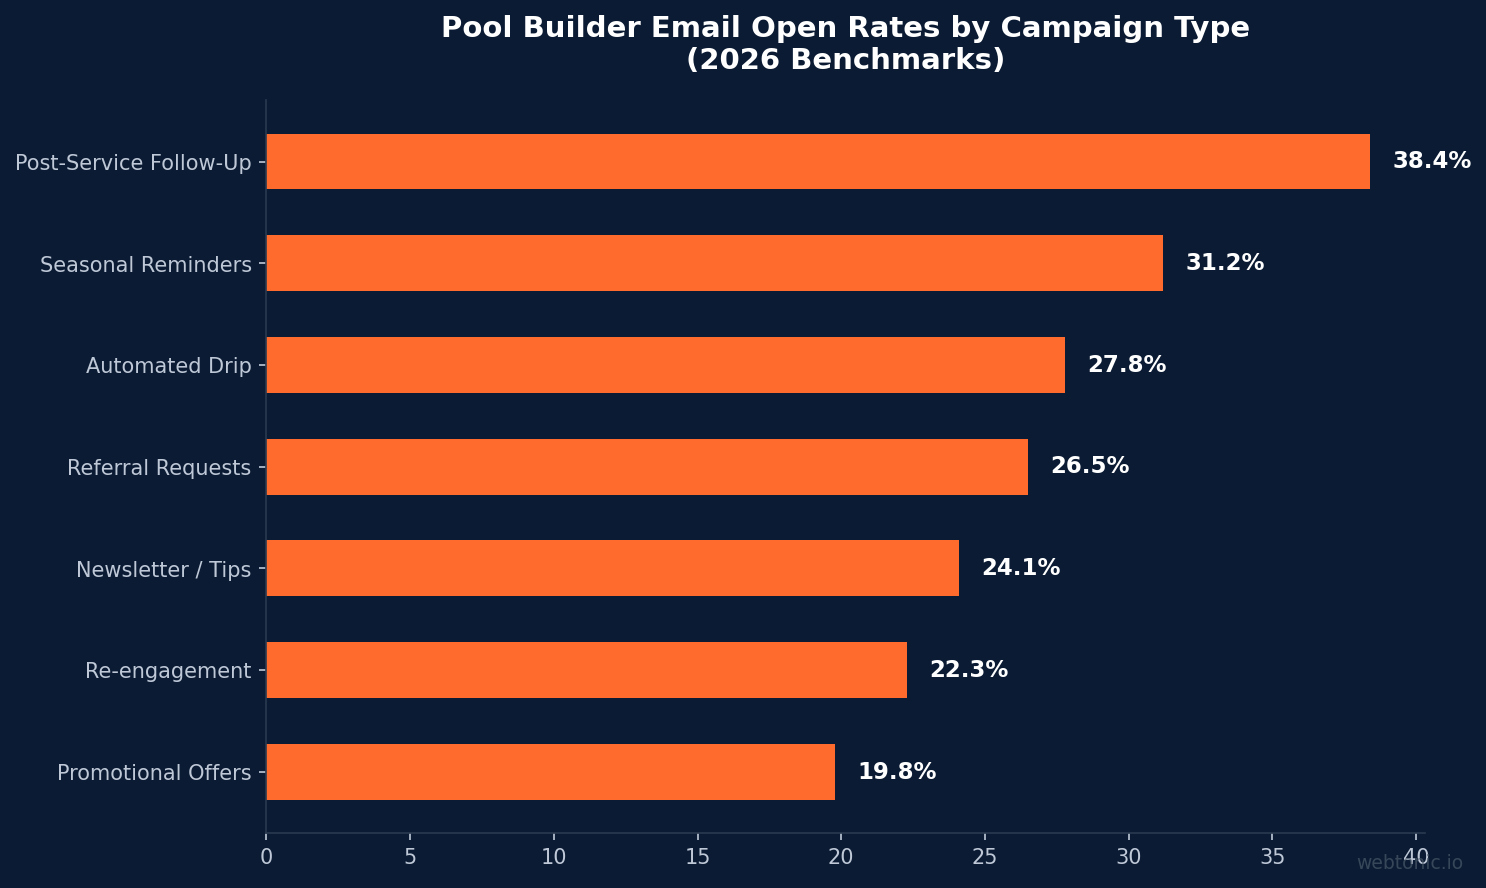
Not all pool-builder emails perform equally. Transactional emails — appointment confirmations, service reminders, invoice receipts — hit 45–55% open rates, dwarfing promotional blasts. Among marketing emails, seasonal opening and closing reminders reach 31.2% opens because they arrive when pool owners actively seek service (Campaign Monitor).
| Email Type | Open Rate | CTR | CTOR |
|---|---|---|---|
| Seasonal Service Reminders | 31.2% | 5.4% | 17.3% |
| Promotional Offers / Discounts | 19.8% | 2.7% | 13.6% |
| Newsletter / Tips & Advice | 24.1% | 3.0% | 12.4% |
| Referral Request Campaigns | 26.5% | 4.1% | 15.5% |
| Re-engagement / Win-Back | 22.3% | 2.9% | 13.0% |
| Automated Drip Sequences | 27.8% | 4.6% | 16.5% |
| Post-Service Follow-Up | 38.4% | 6.2% | 16.1% |
Post-service follow-up emails represent an underutilized goldmine for pool contractors. Companies that send a personalized satisfaction check within 48 hours of service completion generate 3.2× more Google reviews and see a 26% increase in repeat bookings within six months, compared to those with no post-service touchpoint.
Marketing Automation and Drip Campaigns in Pool Services
Automated email workflows generate 320% more revenue per message than manual broadcast campaigns for pool-service companies (Omnisend). The most effective drip sequences follow the pool-owner lifecycle: initial quote follow-up → project milestone updates → seasonal maintenance reminders → annual upgrade offers.
Pool builders who implement triggered abandonment emails for online quote requests recover 8–14% of lost leads, generating an additional $12,000–$28,000 in annual pipeline for a contractor handling 400+ quote requests per year. Automation also reduces staff time spent on manual follow-ups by an estimated 15 hours per week for a five-person service team (GetResponse).
Segmentation amplifies these results further. Pool companies segmenting by service history see 22% higher open rates and 49% higher click rates than those sending uniform blasts. Common high-performing segments include: new construction leads, active maintenance contracts, lapsed customers (6+ months inactive), and referral program members. Integrating email with data intelligence platforms enables dynamic segmentation that updates as customer behavior changes.
Seasonal Email Performance Patterns for Pool Builders
The pool industry's pronounced seasonality creates predictable email engagement windows. March through May accounts for 42% of annual email-driven revenue as homeowners book spring openings, cleaning, and renovation projects. A second, smaller peak arrives in September–October (18% of annual email revenue) with winterization and closing services (PHTA).
| Season / Month Range | Share of Email Revenue | Best-Performing Email Types |
|---|---|---|
| January–February | 6% | Early-bird renovation offers, financing promos |
| March–May (Peak) | 42% | Opening reminders, service packages, equipment upgrades |
| June–August | 24% | Maintenance tips, referral campaigns, accessory upsells |
| September–October | 18% | Closing / winterization reminders, off-season discounts |
| November–December | 10% | Gift cards, holiday specials, annual recap newsletters |
Contractors in Sun Belt states like Florida, Arizona, and Texas see a more evenly distributed engagement curve, with summer maintenance emails sustaining 70–80% of spring-peak engagement. Northern-market pool builders should plan 85% of their email calendar around two compressed seasonal windows (March–May and September–October) and use the off-season to build brand authority through educational content.
List-Building Strategies and Subscriber Growth
Growing and maintaining a healthy subscriber list is the foundation of email success for pool contractors. The median pool-builder email list contains 2,800–4,500 contacts, with top-performing companies reaching 10,000+ through aggressive multi-channel capture. Website exit-intent popups convert 3.1–4.5% of visitors into subscribers (Omnisend), while in-person estimate appointments capture emails at a 78% rate when technicians use tablet-based intake forms.
List hygiene matters equally: pool-service lists experience 22–28% annual churn from home sales, service area moves, and unsubscribes. Companies that run quarterly re-engagement campaigns reduce that churn to 14–18%, preserving deliverability scores above the 95% inbox placement threshold recommended by major ESPs. Pairing list growth with professional email marketing support accelerates both acquisition and hygiene workflows.
Email Cost per Lead Compared to Other Channels
Email marketing offers pool builders the lowest cost per acquisition among all digital channels. Referral-triggered email campaigns produce qualified leads at $8–$15 CPA, while automated nurture sequences convert existing contacts at $3–$7 per converted lead (platform subscription cost amortized across conversions). For comparison:
| Channel | Avg. CPL (Pool Construction) | Avg. CPL (Pool Maintenance) |
|---|---|---|
| Email Marketing (automation) | $3–$7 | $2–$5 |
| Email (referral campaigns) | $8–$15 | $6–$12 |
| Google Ads (Search) | $125–$180 | $35–$55 |
| Meta / Facebook Ads | $65–$120 | $25–$45 |
| Organic SEO | $20–$40 (blended) | $15–$30 (blended) |
| Direct Mail | $45–$80 | $30–$50 |
| Shared Lead Services | $85–$200 | $40–$75 |
The data underscores email's role as a retention and reactivation engine rather than a cold-acquisition tool. Pool companies allocating 5–10% of their total marketing budget to email (Pool Marketing Pros) typically see the strongest overall blended CPL because email reduces reliance on expensive paid social and search channels for repeat business.
Customer Retention and Lifetime Value Through Email
For pool-service contractors, email's greatest impact may be on retention rather than acquisition. Companies with active email nurture programs retain 78% of maintenance contracts annually, compared to 58% for those without structured follow-up (Reports and Data). At an average three-year customer lifetime value of $2,400, the retention gap translates to $480 in additional LTV per customer retained.
Re-engagement campaigns targeting customers inactive for 90–180 days recover 12–18% of lapsed accounts, with the highest win-back rates coming from combined incentive-plus-reminder sequences (e.g., "Your pool is due for a mid-season check — book this week and save 15%"). Pool companies running monthly re-engagement flows report $180–$340 in recovered annual contract value per reactivated customer. These retention improvements compound over time: a pool company retaining just 20 additional customers per year at $800 annual contract value adds $16,000 in recurring revenue — often enough to cover the entire email platform cost several times over.
Pool Email Marketing vs. Other Home-Service Industries
| Industry | Avg. Open Rate | Avg. CTR | Email ROI (per $1) |
|---|---|---|---|
| Pool Building & Service | 23.4% | 3.18% | $36–$42 |
| HVAC | 22.8% | 2.95% | $38–$44 |
| Plumbing | 21.6% | 2.74% | $34–$40 |
| Landscaping | 24.1% | 3.32% | $32–$38 |
| Roofing | 20.3% | 2.45% | $28–$35 |
| Electrical | 21.0% | 2.61% | $30–$36 |
| General Contracting | 19.7% | 2.38% | $26–$33 |
Pool builders rank in the upper tier among home-service verticals for email engagement, benefiting from seasonal urgency and high average ticket values that make each converted lead highly profitable. The recurring nature of maintenance contracts also gives pool companies a natural reason to stay in customers' inboxes year-round, unlike project-based trades where post-completion contact drops off sharply.
Best Practices for Pool Builder Email Campaigns
Data from high-performing pool-service email programs reveals consistent patterns worth replicating across creative and messaging strategies:
- Send seasonal reminders 3–4 weeks before service windows — early sends capture 34% more bookings than last-minute blasts.
- Use photo-rich project showcases in newsletters — emails with 2–3 project images see 27% higher CTR than text-heavy formats.
- Segment by service type (construction vs. maintenance vs. renovation) — segmented campaigns drive 49% more clicks than uniform blasts.
- Include a single, clear CTA above the fold — multi-CTA emails reduce conversions by 17% in service industries.
- A/B test subject lines with localized references — subject lines mentioning the customer's city or neighborhood lift open rates by 12–16%.
- Automate post-service review requests within 48 hours — prompt requests generate 3.2× more Google reviews than delayed asks.
- Offer exclusive email-only referral incentives — $50–$100 referral credits produce a 6:1 return for pool builders on average.
Email Platform Costs and Technology Stack
Pool builders choosing an email platform face a range of pricing tiers that scale with list size and feature depth. Entry-level platforms like Mailchimp cost $13–$45/month for lists under 2,500 contacts, providing basic automation and templates sufficient for most single-location contractors. Mid-tier solutions — Constant Contact, ActiveCampaign, and Drip — run $49–$149/month and add advanced segmentation, behavioral triggers, and CRM integration that larger pool companies need.
Field-service platforms represent a growing category for pool builders seeking all-in-one scheduling, invoicing, and communication tools. Jobber, ServiceTitan, and Housecall Pro include built-in email functionality at $89–$299/month, eliminating the need for standalone email software. While their email features are less sophisticated than dedicated platforms, the operational integration — automatically emailing service reminders tied to job schedules — produces 35–42% higher engagement rates than manually triggered campaigns because messages align perfectly with actual service timelines (GetResponse).
The most advanced pool companies layer SMS alongside email, using text messages for time-sensitive appointment reminders (48-hour and 24-hour confirms) and email for longer-form content like seasonal tips, project showcases, and referral requests. This dual-channel approach lifts overall engagement by 18–25% compared to email-only communication strategies.
Mobile Optimization and Design Best Practices
With 68.5% of pool-industry web traffic coming from mobile devices (Reports and Data), email design must prioritize mobile rendering. Single-column layouts with 16px+ body text produce 23% higher mobile CTR than multi-column templates that break on smaller screens. Pool companies that adopted mobile-first email design report click-to-open rates 31% above their desktop-optimized counterparts.
Visual hierarchy matters: pool owners scanning emails on phones respond best to a hero image of completed work, one bolded stat or offer, and a single prominent CTA button. Emails exceeding 150 words before the first CTA lose 40% of mobile readers before the call-to-action appears. For pool builders, the optimal email structure includes: a project photo header (600px wide), a 2–3 sentence intro, the offer or CTA, then supporting detail below for readers who scroll further.
Related reading
- Pool Building Analytics Stats (2026)
- Pool Building Marketing Attribution Statistics: 2026 Data & Benchmarks
- Pool Building Marketing Dashboards Statistics: 2026 Reporting Benchmarks
- Email Marketing services at Web Tonic
Frequently Asked Questions
What is a good email open rate for pool builders?
A 23–28% open rate is considered strong for pool-service email campaigns. Segmented seasonal reminders regularly hit 28–31%, while broad promotional blasts may dip to 18–20%. The all-industry average sits around 21.3%, so pool builders generally outperform the benchmark thanks to the time-sensitive nature of their services.
How often should a pool company send marketing emails?
Two to four emails per month strikes the optimal balance for pool builders. Sending more than once per week risks unsubscribe spikes, while monthly-only cadences miss seasonal booking windows. During peak spring and fall seasons, increasing to weekly sends is well-received by engaged subscribers who are actively planning service appointments.
Which email platform works best for pool builders?
Mailchimp, Constant Contact, and Jobber's built-in email tools are the most popular among pool-service companies. The best choice depends on list size and automation needs: Mailchimp handles 500–10,000 contacts affordably, while field-service platforms like Jobber or ServiceTitan integrate directly with job scheduling and invoicing workflows.
How does email compare to social media for pool company marketing?
Email consistently outperforms social media in direct revenue attribution for pool builders. While social platforms drive brand awareness, email generates 3–5× more conversions per dollar spent because it reaches customers who have already expressed interest by subscribing. The two channels work best in tandem, with social driving list growth and email converting leads into bookings.
What is the best time to send pool-service emails?
Tuesday and Thursday mornings between 8:00–10:00 AM local time produce the highest open rates for home-service emails. For seasonal campaigns, sending 3–4 weeks before the service window opens captures early bookings and avoids the rush. Avoid weekend sends, which see 15–20% lower engagement in the home-services vertical.
Sources
Litmus — Email Marketing ROI Report
Reports and Data — Swimming Pool Market
M.Wolf Media — Pool Marketing Services
Campaign Monitor — Email Marketing Benchmarks
Omnisend — Email Marketing Statistics
PHTA — Pool & Hot Tub Alliance
Pool Marketing Pros
GetResponse — Email Marketing Benchmarks
WorldMetrics — Swimming Pool Statistics


