Table of contents
Most pool builders do not have a reporting problem - they have a timing problem. Spend lands in February and contracts sign in July, so a normal marketing dashboard makes a profitable season look like a disaster. Below are the 2026 benchmarks, the KPI set that survives a six-month sales cycle, and the data gaps that make contractor dashboards untrustworthy.
Key Takeaways
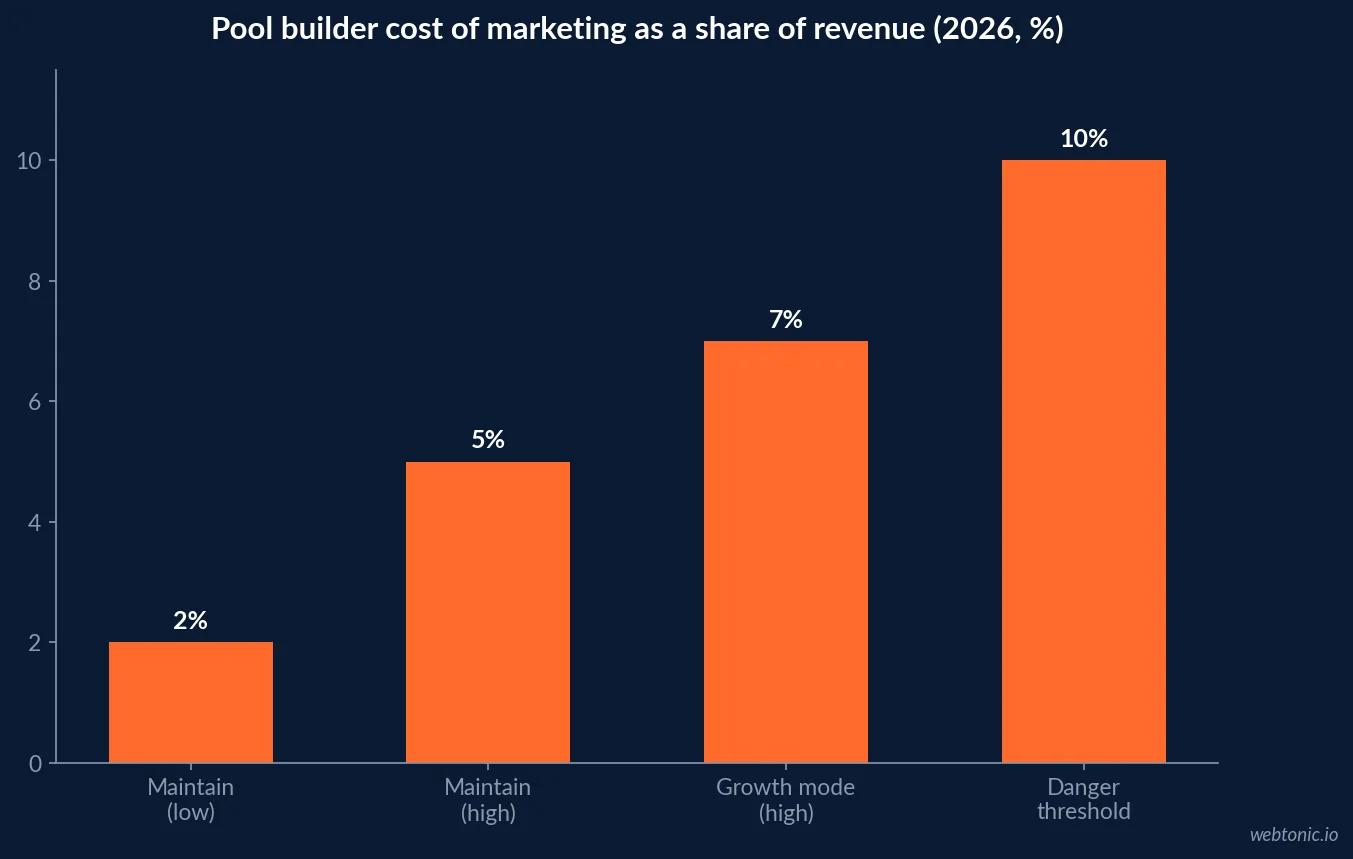
- Pool builders should run 2-5% cost of marketing to maintain and 5-7% to grow, against 15-25% profit margins; above 10% the build stops paying.
- 73% of CMOs report centralised dashboards improved decision speed and quality; automated reporting saves roughly 5-15 hours per week.
- 41% of marketers cannot measure effectively across channels and 38% lack tools to integrate their data.
- 56% say they lack time to analyse data versus only 14% lacking expertise - a four-to-one gap.
- 63% rank ROI as their top metric, yet returned data rows grew 230% between 2020 and 2024 without a matching gain in usable insight.
- Pool industry mix is maintenance ~64%, renovation ~22%, new construction ~14% - a lead-volume-only dashboard hides that.
- 44% of pool construction firms reported new-build revenue growth last year while 37% reported a decline, so peer averages are close to useless without your own baseline.
Reporting benchmarks at a glance
The numbers below set expectations for what a dashboard programme should deliver and what it will not fix.
| Metric | 2026 benchmark | Source type |
|---|---|---|
| CMOs reporting better decisions from centralised dashboards | 73% | Cross-industry survey |
| Weekly hours saved by automated reporting | 5-15 hours | Vendor / agency reporting |
| Marketers unable to measure across channels | 41% | Marketing data survey |
| Marketers lacking data-integration tools | 38% | Marketing data survey |
| Marketers short of analysis time | 56% | Marketing data survey |
| Marketers short of data expertise | 14% | Marketing data survey |
| Marketers ranking ROI as the top metric | 63% | Marketing data survey |
| Growth in returned data rows, 2020-2024 | +230% | Platform data |
| Marketers naming ROI measurement their biggest challenge | 33% | State of Marketing survey |
| Average data sources per marketing team | ~12 | Dashboard vendor data |
The pattern is consistent across every survey: data volume has grown far faster than analysis capacity. Adding another data source to a pool builder's reporting stack usually lowers decision quality unless something is removed at the same time.
Cost of marketing is the pool dashboard's headline number
Cost of marketing percentage - marketing spend divided by the revenue it produced - is the one figure that survives a long sales cycle, provided it is calculated on accrued revenue. The pool-specific guidance is unusually concrete.
| Scenario | Cost of marketing | What it implies |
|---|---|---|
| Maintaining current volume | 2-5% of revenue | Healthy; leaner than the 7.7% cross-industry average |
| Actively growing / new markets | 5-7% of revenue | Acceptable if backlog is growing |
| Aggressive expansion phase | 7-10% of revenue | Only with 25%+ margins and tracked pipeline |
| Above 10% | danger zone | Marketing is eating the profit on every build |
| $2M builder at 5% | $100,000/year | Roughly $8,300 per month, all-in |
| $3M builder at 5% | $150,000/year (~$12,500/month) | Typical agency-recommended tier |
| $3M builder at 7% | $210,000/year (~$17,500/month) | Growth mode; $5,000/month is the whole difference |
The trap is the denominator. Compare a quarter's spend to that quarter's signings and cost of marketing looks inflated, because the last three months of spend has not returned yet. Credit projected revenue instead - qualified leads times historical close rate times average project value - so $15,000 of spend, 40 leads, a 30% close rate and an $85,000 average project reads as roughly $1.02M accrued. Our data intelligence team builds the accrual view first and the channel view second.
The KPI set that fits a six-month sale
Nine numbers, each with a benchmark a builder can argue with. Anything beyond these belongs on the operational dashboard, not the owner's.
| KPI | 2026 target / benchmark | Why it earns dashboard space |
|---|---|---|
| Accrued cost of marketing | 2-5% maintain, 5-7% grow | The profitability guardrail |
| Qualified leads per month | 20-35 at $2M, 40-70 at $5M | Volume, after qualification |
| Cost per qualified construction lead | $150-$220 in a well-run account | Media efficiency |
| Consultation-to-sale close rate | 30-40% after a full consult | The real sales metric |
| Unqualified close rate | ~8% | Shows the cost of skipping qualification |
| Average project value | ~$65,909 in-ground | Denominator for every ROI claim |
| Answered-call rate | target 95%+ (28% of calls go unanswered) | Largest silent leak in the trade |
| Service-plan attach rate | retention benchmark 78% | Bridges into the 64% maintenance segment |
| Signed backlog in weeks | 80% of service firms report being fully booked | Tells you when to cut spend, not raise it |
The backlog row is the one most builders omit and the one that prevents the classic mistake: scaling media in May when the crews are already booked into September. Jobber's trends data shows 80% of service businesses fully booked or close to it, with 75% expecting revenue growth and 91% having raised prices - in that environment, price and capacity are stronger levers than lead volume.
Why the data behind the dashboard is the real project
Dashboards fail on inputs, not visuals. The reported barriers are consistent and none of them are solved by a prettier chart.

| Barrier | Share of marketers | Pool-building consequence |
|---|---|---|
| Not enough time to analyse data | 56% | Reports get built and never read during the spring surge |
| Cannot measure across channels | 41% | Offline and referral credit disappears |
| No tools to integrate data | 38% | CRM, call tracking and ad platforms never reconcile |
| Not enough data to decide | 26% | Low monthly job counts make small samples noisy |
| Lack of data expertise | 14% | Rarely the actual constraint |
Two pool-specific inputs decide whether any of this works: call tracking, because 60-70% of conversions arrive by phone, and a mandatory CRM lead-source field, because only 52% of users fill it in. Without those, a dashboard reports a partial funnel very precisely. The full diagnosis is in our HVAC marketing attribution statistics breakdown.
Executive versus operational: two dashboards, not one
Segmenting by audience is where the 73% decision-quality gain comes from. Each view needs its own refresh rate and its own owner.
| View | Audience | Refresh | Contents |
|---|---|---|---|
| Season scoreboard | Owner | Monthly | Accrued cost of marketing, signed revenue, backlog weeks, margin |
| Pipeline board | Sales lead | Weekly | Leads by job type, consult rate, close rate, follow-up ageing |
| Media board | Marketing / agency | Weekly | Spend, cost per qualified lead, cost per signed job by channel |
| Front-office board | Office manager | Daily in season | Answered-call rate, response time, booked consults |
| Aftermarket board | Service manager | Monthly | Attach rate, retention, churn, service revenue share |
Set every metric as a three-tier band rather than a single target - minimum, target, stretch. A cost per lead of $180 means nothing alone; $180 against a $220 minimum and a $150 stretch is a decision.
Tooling: what a pool builder actually needs
Cost scales with team size, not ambition. Most builders under $5M are over-tooled and under-instrumented.
| Layer | Typical cost | Notes |
|---|---|---|
| Free BI (Looker Studio) | $0 | Enough for a builder with 3-6 data sources |
| Paid dashboard tooling | $25-$70/month | Buys scheduling, templates and AI summaries |
| Call tracking | $45-$100/month | Non-negotiable in a phone-led trade |
| Field service / CRM reporting | included in most suites | Where backlog and job mix live |
| Enterprise attribution platforms | built for $10M+ spend | Wrong tier for nearly every pool builder |
Automation is worth more than sophistication here: replacing manual exports is what produces the 5-15 hours a week saving, and it is the reason a monthly report still exists in August.
What a pool dashboard must never do
- Never compare a quarter's spend to that quarter's signings - accrue, or the report lies.
- Never report a blended cost per lead across construction and service; they close at 8-12% and 35-40%.
- Never show one dashboard to owner, sales and agency.
- Never track lead volume without backlog - 80% of firms are already near capacity.
- Never benchmark against peer averages alone when 44% grew and 37% declined in the same year.
- Never add a thirteenth data source before the twelfth is reconciled.
- Never let the dashboard become the deliverable; the decision is the deliverable.
A 60-day dashboard build
Short on purpose. A pool builder's reporting has to be live before spring, not perfected after it.
| Window | Work | Outcome |
|---|---|---|
| Week 1 | Agree the nine owner KPIs and their three-tier bands | A definition of good |
| Week 2 | Wire call tracking and enforce the CRM lead-source field | Trustworthy inputs |
| Week 3 | Split pipelines by job type: build, remodel, service | Ends blended reporting |
| Week 4-5 | Build the season scoreboard with accrued revenue | Owner view that survives the cycle |
| Week 5-6 | Add media and pipeline boards on a weekly refresh | Operator views |
| Week 7 | Automate delivery and kill every manual export | Recovers 5-15 hours per week |
| Week 8 | Set the monthly review agenda: three decisions, no recaps | Reporting becomes a decision ritual |
For the demand side of the same scoreboard, see our pool building SEO statistics and pool building branding statistics analyses.
Metrics to review every month
- Accrued cost of marketing against the 2-5% / 5-7% bands.
- Qualified leads and cost per qualified lead by job type.
- Consultation rate and consultation-to-sale close rate.
- Answered-call rate and average first-response time.
- Signed backlog in weeks, per crew.
- Revenue mix versus the industry 64 / 22 / 14 maintenance, renovation, construction split.
- Data health: lead-source completion rate and platform-to-CRM lead delta.
If you would rather have that scoreboard built once and reported monthly, get in touch.
Frequently Asked Questions
What is the single most important metric on a pool builder's dashboard?
Cost of marketing as a percentage of revenue, calculated on accrued rather than same-period revenue. Pool builders typically work on 15-25% profit margins, so the industry guidance is 2-5% cost of marketing to maintain volume and 5-7% when pushing into new markets. Above 10% a build stops being profitable. For context, Gartner's CMO spend survey puts cross-industry marketing budgets around 7.7% of revenue, so a disciplined pool builder runs leaner than the average company.
How many KPIs should a pool builder's dashboard show?
Split by audience rather than by count. An owner dashboard needs seven to nine numbers - cost of marketing, qualified leads, consultation rate, close rate, average project value, backlog weeks and service attach rate. The operational dashboard a marketing manager uses can carry twenty. Building one dashboard for everyone is the most common design failure, and roughly 73% of CMOs report that centralised dashboards improved decision speed and quality once they were segmented properly.
Do dashboards actually save contractors time?
Yes, and the saving is measurable. Teams replacing spreadsheet exports with automated dashboards and scheduled delivery report saving roughly 5-15 hours a week. That matters more in pool building than in most trades because the reporting burden peaks in March through June, exactly when enquiries surge 300-400% and the owner is already on jobsites.
Why do pool builders distrust their own marketing reports?
Because the underlying data is incomplete. Surveys show 41% of marketers cannot measure effectively across channels, 38% lack tools to integrate their data, and 56% say they do not have enough time to analyse what they already have - a shortage of time four times more common than a shortage of expertise. In a trade where 60-70% of conversions arrive by phone and only 52% of CRM users fill the lead-source field, the dashboard is usually reporting a partial funnel accurately rather than a full funnel badly.
What should a pool dashboard track that a generic marketing dashboard does not?
Backlog and job mix. New in-ground starts have roughly halved from about 120,000 at the 2021 peak to just under 60,000 in 2025, while maintenance is about 64% of industry distributor sales and renovation about 22%. A dashboard that only reports lead volume will miss a builder drifting out of the segment that pays the bills, so track revenue mix, service-plan attach rate and signed backlog in weeks alongside the media metrics.
Sources
Aquathority - COM%: The #1 Marketing Metric for Pool Builders
Pool Biz - Why Pool Construction Companies Need KPIs
Konabayev - Marketing Analytics Statistics 2026
Supermetrics - Marketing Data Report 2026
1ClickReport - Marketing KPI Dashboard Guide 2026
Reporting Ninja - Automated Marketing Reports
HubSpot - State of Marketing Report 2026
Jobber - Home Service Economic Report 2026
Pool Magazine - Understanding the US Pool Market in 2026
CUFinder - Swimming Pool Industry Benchmarks 2026