



Table of contents
The average pool builder in Florida receives just 214 website visits per month, with 75% of businesses logging fewer than 50 monthly sessions. Those numbers expose a measurement problem as much as a traffic problem: most pool construction companies lack the analytics infrastructure to know what is working, what is leaking, and where growth is hiding. Here are the tracking and analytics benchmarks shaping the pool building industry in 2026.
Key Takeaways
- 68.5% of pool company website traffic comes from mobile devices, yet 96% of pool builder sites score as slow on mobile performance tests.
- The average website conversion rate for pool businesses is 3.2%, while top-performing landing pages reach 5.8%.
- 42% of U.S. pool company traffic comes from organic search, making SEO the single largest acquisition channel.
- Lead-to-sale conversion runs 8–12% for new pool construction and 35–40% for maintenance and service inquiries.
- 75% of pool builders in Florida get fewer than 50 website visits per month, based on a 300-site study.
- 52.4% average bounce rate across pool industry websites — above the healthy threshold for service businesses.
- The U.S. pool construction market is valued at $24.8 billion, growing at a 3.0% CAGR through 2026.
- 14+ million pools, spas, and hot tubs exist in the United States, with 60,000 new in-ground pools built annually.
- 78% of pool service customers renew annual contracts, making lifetime value tracking essential for accurate ROI measurement.
- Blue Haven Pools boosted conversion from 2–3% to 14% after implementing lead conversion tracking and automated follow-up.
Pool Building Analytics Benchmarks at a Glance
| Metric | Benchmark (2026) | Source |
|---|---|---|
| Mobile Traffic Share | 68.5% | CUFinder |
| Desktop Traffic Share | 27.0% | CUFinder |
| Avg. Bounce Rate | 52.4% | CUFinder |
| Avg. Session Duration | 2 min 45 sec | CUFinder |
| Pages Per Session | 3.8 | CUFinder |
| Website Conversion Rate (Avg.) | 3.2% | CUFinder |
| Landing Page CVR (Top) | 5.8% | CUFinder |
| New vs. Returning Visitors | 72% / 28% | CUFinder |
| Monthly Visits (SMB Avg.) | 4,500–7,000 | CUFinder |
| FL Pool Builder Avg. Visits | 214/month | Patrick Herbert |
Website Traffic Patterns in the Pool Construction Sector
Pool company websites are overwhelmingly mobile-first. 68.5% of all sessions come from mobile devices, with desktop accounting for 27% and tablets at 4.5%, according to CUFinder benchmarks. The pattern reflects how pool buyers research: they scroll inspiration content on their phones, then return on desktop to fill out financing forms or request consultations.
Yet 96% of pool builder sites are classified as slow on mobile — receiving a performance score of C or lower in Patrick Herbert's 300-site study. That mismatch between where traffic arrives and how sites perform is the single largest analytics red flag in the sector.
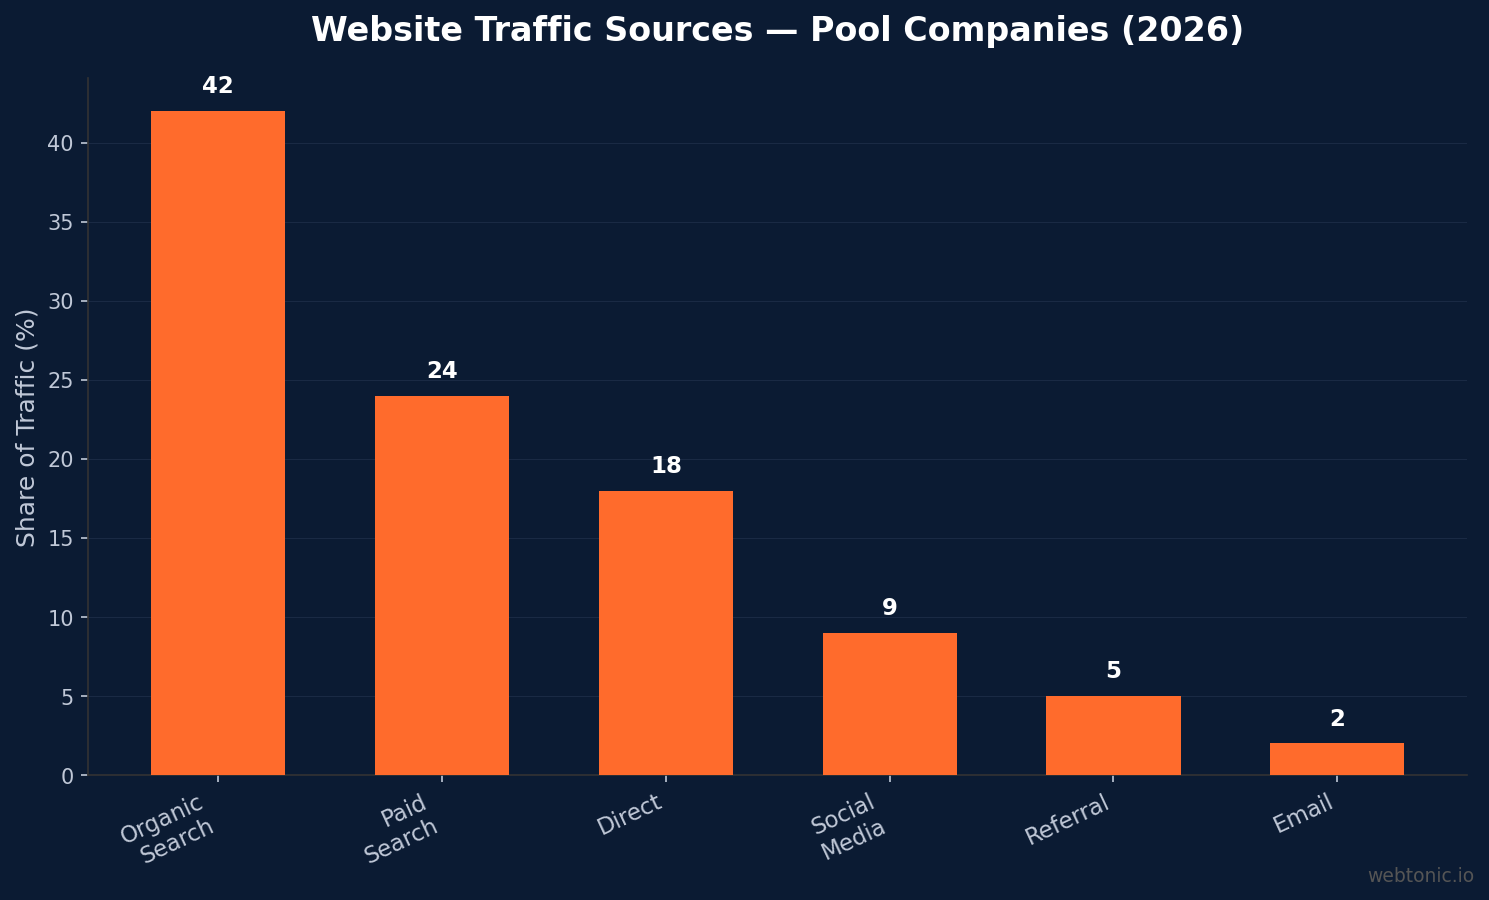
Traffic sources split across six channels for U.S. pool businesses. Organic search drives 42% of all visits, making it the dominant acquisition channel. Paid search accounts for 24%, direct traffic 18%, social media 9%, referrals 5%, and email 2%. Globally, organic's share climbs to 48% as international markets have less paid competition.
Conversion Rate Data Across the Pool Buyer Funnel
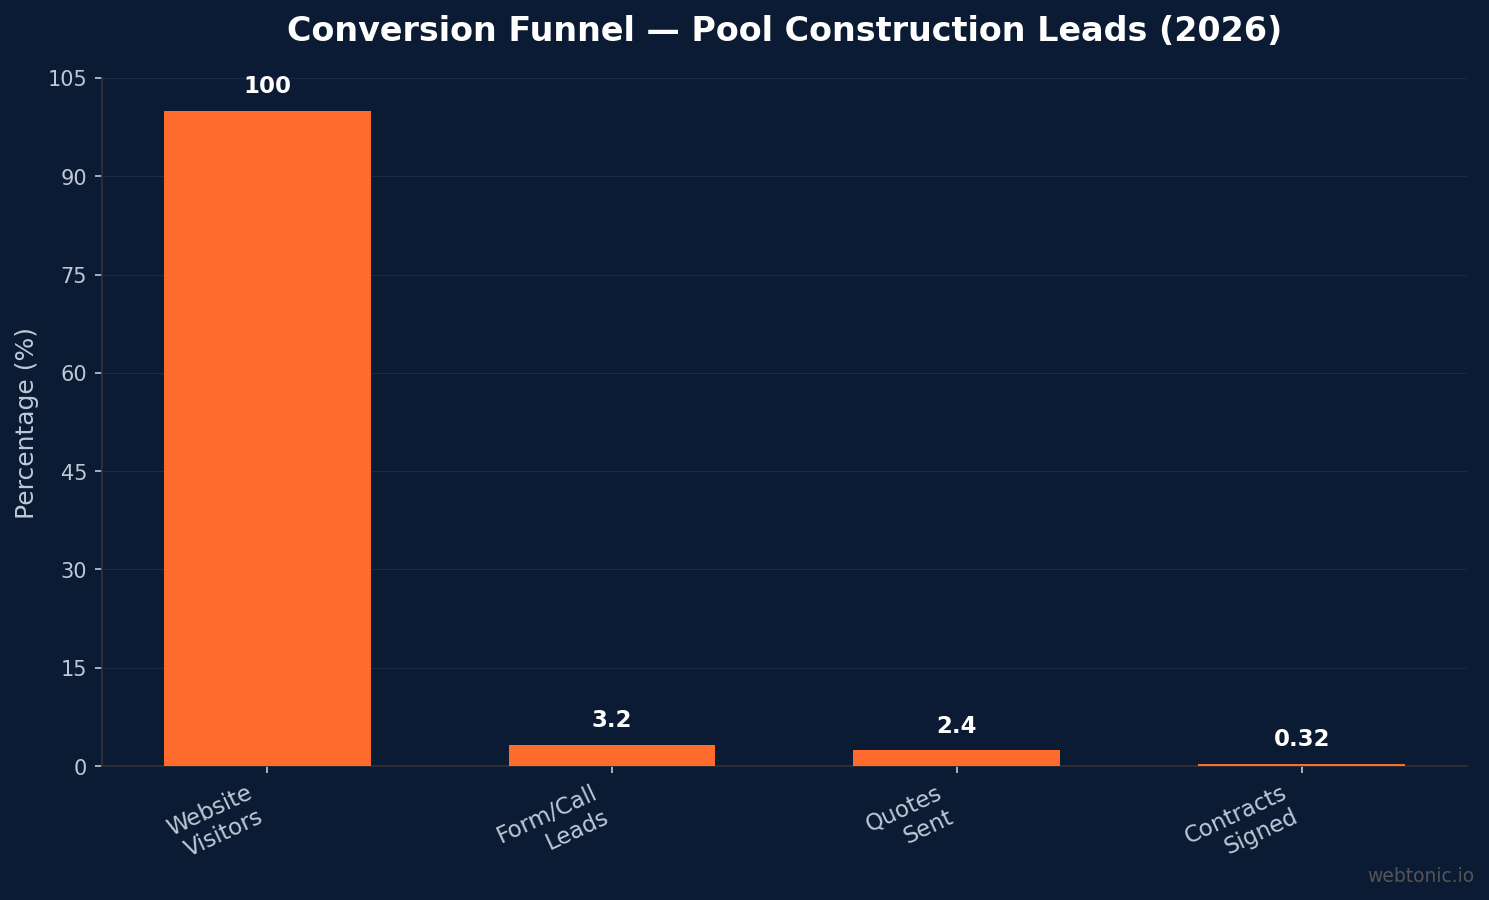
The average pool company website converts 3.2% of visitors into leads (form submissions or phone calls), while top-performing landing pages reach 5.8%. The gap between average and top quartile represents a significant revenue opportunity: for a builder receiving 5,000 monthly visits, moving from 3.2% to 5.8% means 130 additional leads per month.
| Funnel Stage | Conversion Rate | Context |
|---|---|---|
| Website Visitor → Lead | 3.2% (avg) / 5.8% (top) | Form + phone combined |
| Lead → Quote (Construction) | 65–76% | ROI.LIVE case data |
| Quote → Signed Contract | 8–12% | Industry average |
| Lead → Sale (Service) | 35–40% | Maintenance/repair |
| Google Ads CVR | 4.8% | Search campaigns |
| Home Services CVR | ~7.8% | All home services avg. |
Blue Haven Pools demonstrated what proper tracking can unlock — their website lead conversion jumped from the industry average of 2–3% to a remarkable 14% after implementing automated lead capture and follow-up tracking through LeadConverter. The improvement came from data intelligence — tracking which pages produced leads and optimizing the response sequence.
Pool Construction Market Size and Growth Data
Pool building analytics exist within a large and stable market. The U.S. swimming pool construction market is valued at $24.8 billion in 2026, growing at a 3.0% CAGR over the past five years, according to Pool Magazine citing IBISWorld data. The broader pool, hot tub, and spa industry reaches $62 billion when including equipment, chemicals, and services.
Key market datapoints that shape analytics decisions:
- 14+ million pools, spas, and hot tubs in the U.S., with approximately 8.8 million residential pools.
- 60,000 new in-ground pools built annually in 2025, down roughly 50% from the 2021 pandemic peak.
- 125,000 pool service and retail businesses operating across the country.
- 64% of all industry revenue is maintenance-driven — recession-resistant spending on chemicals, equipment, and service.
- The global swimming pool construction market is projected to reach $45.2 billion by 2034 at a 6.1% CAGR according to Reports and Data.
CRM and Technology Adoption Across Pool Companies
Technology adoption in pool construction lags behind other home service verticals. 60% of U.S. pool service companies use digital marketing tools, while 80% use email marketing for customer retention according to WorldMetrics. However, deeper analytics capabilities remain sparse:
- 83% of pool builder sites do not have a Facebook pixel installed — or equivalent tracking tag — limiting retargeting and attribution.
- 72% of pool builder websites lack local business schema markup, reducing visibility in Google's structured results.
- 40% do not have a Google Business Profile linked to their website, missing local pack attribution data.
- 50% of pool builders rank for 22 keywords or fewer in Google, reflecting minimal SEO tracking investment.
- Pool-specific CRM platforms (Poologics, Builder Prime, Eano) are gaining traction but market penetration remains low compared to general-purpose tools like HubSpot or Zoho.
The State of Pool Service 2026 survey of 1,600+ professionals reveals that 65% of pool companies rely on referrals as their primary lead source, and 51% say referrals deliver the best leads. The standout shift is SEO adoption jumping 7 percentage points year-over-year according to PoolDial — pool professionals are investing more in appearing when homeowners search "pool service near me."
Best Practices for Pool Building Analytics
- Fix mobile speed first. With 68.5% mobile traffic and 96% of sites scoring slow, page speed is the highest-ROI analytics investment.
- Install conversion tracking on every lead path. Phone calls, forms, chat, and scheduling widgets all need attribution — 83% of pool builders are flying blind without pixel tracking.
- Track lead-to-revenue, not just lead count. A $200 lead that closes into an $87,000 pool deal has a 435× return — but only if the CRM connects ad spend to signed contracts.
- Segment construction leads from service leads. Construction converts at 8–12%; service at 35–40%. Blending them produces misleading cost-per-acquisition figures.
- Monitor the 90–180 day sales cycle. Attribution windows must cover the full consideration period; last-click models undercount brand and awareness campaigns.
- Benchmark against the industry, not just your own history. If your site converts at 3.2%, you are average. If top performers hit 5.8%, there is room to grow.
- Add local schema and link Google Business Profile. The 40% of builders without GBP linked are invisible in local analytics attribution.
Industry Comparison: Pool Builders vs. Other Home Services
Pool companies underperform several comparable home service verticals on key analytics metrics. The home services average conversion rate is approximately 7.8% according to Get X Media benchmarks, more than double the 3.2% average for pool builder websites. The gap reflects both longer consideration cycles and weaker site optimization.
| Metric | Pool Builders | Home Services Avg. | Gap |
|---|---|---|---|
| Website CVR | 3.2% | 7.8% | −4.6 pts |
| Google Ads CPL | $61.86 CAD | $85+ CAD | Lowest in category |
| Mobile Speed Score | 4% pass | ~30% pass | −26 pts |
| Schema Adoption | 28% | ~45% | −17 pts |
| Avg. Session Duration | 2 min 45 sec | 2 min 10 sec | +35 sec |
The silver lining: pool builder sites hold visitors 35 seconds longer per session than the home services average, likely because pool projects are high-consideration purchases where prospects browse portfolios, galleries, and financing pages. That extra dwell time represents an untapped conversion opportunity — if the site experience matches the buyer intent.
Retention and Lifetime Value Tracking
Analytics for pool companies must extend well beyond the initial lead. 78% of pool service customers renew their annual maintenance contracts, generating $2,400 in lifetime value over three years from service alone. Add equipment upgrades, chemical purchases, and remodeling referrals, and the true LTV of a pool owner is substantially higher.
Key retention metrics that pool builders should track:
- Service contract renewal rate: 78% — among the highest in home services.
- Repeat purchase rate: 45% within 90 days — driven by chemicals, accessories, and seasonal maintenance.
- Annual churn rate: just 12% — pool owners cannot defer maintenance on an existing pool.
- Customer lifetime value (service only): $2,400 over a three-year contract cycle.
- 68% of pool owners renew annual contracts according to WorldMetrics, with satisfaction driving the bulk of renewals.
For pool builders who both construct and service pools, tracking the full customer journey from ad click through installation to multi-year service revenue is the most important analytics capability. A single $65,909 pool installation that converts into a $200/month maintenance contract generates $72,309+ in total customer value — but only if the CRM connects the original acquisition channel to the ongoing revenue stream.
Related reading
- Pool Building Email Marketing Statistics
- Pool Building Marketing Attribution Statistics: 2026 Data & Benchmarks
- Pool Building Marketing Dashboards Statistics: 2026 Reporting Benchmarks
- Marketing Analytics services at Web Tonic
Frequently Asked Questions
What is the average website conversion rate for pool builders?
The average pool company website converts 3.2% of visitors into leads through forms and phone calls. Top-performing landing pages reach 5.8%. The home services industry average is approximately 7.8%, meaning most pool builders still have significant room for improvement.
How much website traffic do pool builders typically get?
The average pool builder in Florida receives 214 monthly visits, with 75% of businesses getting fewer than 50 visits per month. Nationally, SMB pool companies in the CUFinder benchmark dataset receive 4,500–7,000 monthly visits. The wide gap reflects concentration — the top 25% of pool builders capture the vast majority of organic traffic.
What percentage of pool company traffic comes from mobile?
Mobile devices account for 68.5% of all pool company website sessions, with desktop at 27% and tablets at 4.5%. Despite this mobile dominance, 96% of pool builder sites score as slow on mobile performance tests, creating a major conversion bottleneck.
How do pool builders track marketing ROI?
Effective pool builder analytics requires CRM integration that connects ad spend to signed contracts across a 90–180 day sales cycle. Phone call tracking, form attribution, and pipeline-stage reporting are essential. Only 17% of pool builder sites have proper Facebook pixel tracking installed, and 60% lack structured schema markup.
What is the pool construction market size in 2026?
The U.S. swimming pool construction market is valued at $24.8 billion in 2026, growing at a 3.0% CAGR. The broader pool, hot tub, and spa industry is worth $62 billion including equipment, chemicals, and service. Approximately 60,000 new in-ground pools are built annually.
Sources
cufinder.io/blog/benchmarks/swimming-pool
patrickherbert.com.au/pool-builder-statistics
pooldial.com/resources/articles/business/pool-industry-statistics-2026
pooldial.com — state-of-pool-service-2026
poolmagazine.com — the-62-billion-paradox
canibuild.com — blue-haven-pools-leadconverter
worldmetrics.org/pool-service-industry-statistics
reportsanddata.com — swimming-pool-construction-market
roi.live/Blue_Tree_Case_Study.html
getxmedia.com/benchmarks/pool-builder-marketing


