



Table of contents
Plumbing landing pages that follow conversion-rate optimization best practices convert at 5–15%, while the average plumbing homepage converts at just 1.5–3% — a gap that can mean hundreds of lost leads every month.
Key Takeaways
- 5–15% conversion rate for dedicated plumbing landing pages vs 1–3% for generic homepages, representing a 2–4× lift at no additional ad spend (PipelineOn, 2026).
- 75–85% of plumbing conversions come through phone calls rather than form submissions, making click-to-call design the top CRO priority (BestPPC, 2026).
- $129–$183 cost per lead on Google Ads for plumbing, with non-branded search campaigns averaging $183 per lead (SearchLight Digital, 2026).
- 8.6-second average mobile load time for plumbing websites versus the 2.0-second industry target, costing operators significant bounce traffic (PlumbingSEO Agency, 2026).
- 12–16% conversion rate achieved by top-tier plumbing operators who implement the five core CRO fixes within 60–90 days (Astra Results, 2026).
- 40% of plumber websites have no analytics installed, making conversion optimization impossible for a large share of the industry (Claremont Software, 2026).
Plumbing Landing Page Benchmarks at a Glance
| Metric | Average | Top Performers | Source |
|---|---|---|---|
| Landing Page CVR | 5–15% | 12–16% | PipelineOn / Astra Results |
| Homepage CVR | 1.5–3% | 6–8% | Astra Results |
| Cost Per Lead (Google Ads) | $129–$183 | Under $100 | SearchLight / BaaDigi |
| Booking Rate (From Lead) | 28–35% | 41.5% | BaaDigi |
| Mobile Load Time | 8.6 seconds | Under 2.0s | PlumbingSEO Agency |
| Bounce Rate | 55% | Under 35% | Zipdo |
| Phone vs Form Conversions | 75–85% phone | 90%+ phone | BestPPC |
Plumbing Landing Page Conversion Rates by Traffic Source
Conversion rates for plumbing landing pages vary dramatically depending on traffic source, page design, and whether the visitor has emergency or planned intent. The emergency-driven nature of plumbing pushes conversion ceilings higher than most home services verticals.
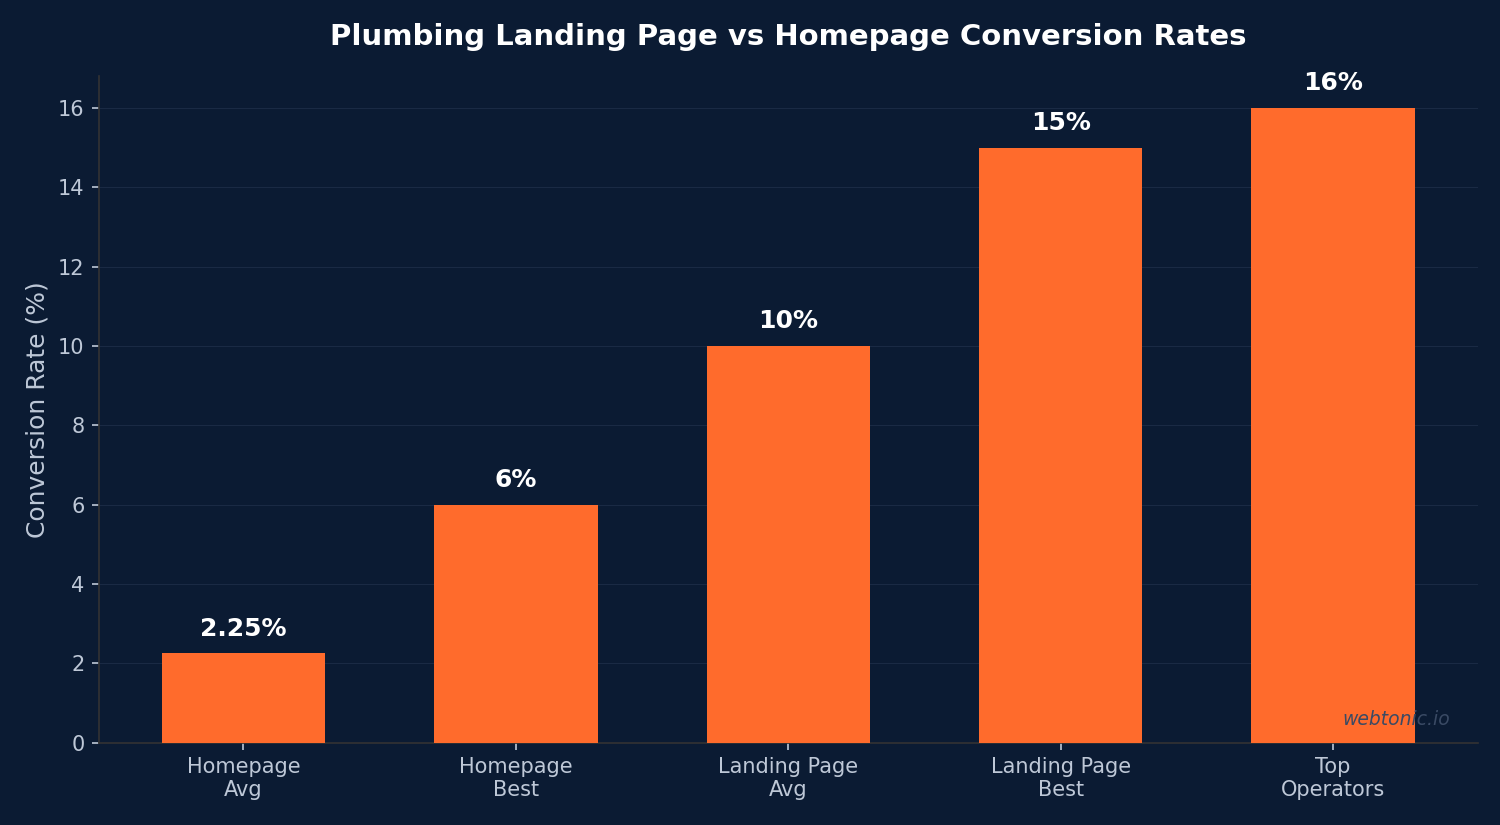
According to Astra Results' 2026 analysis, the industry-average plumbing site converts at 1.5–3%, while WebFX's benchmark report puts the broader home services average at 7.8%. Top-performing plumbing operators with optimized landing pages reach 12–16% — a 4× improvement over the median.
The difference between a 1.5% and a 6% conversion rate is substantial: a plumbing company spending $8,000 per month on lead generation goes from roughly 120 leads to 480 leads with the same traffic volume. That is the math that makes landing page optimization the highest-ROI marketing activity available to most plumbing businesses looking for more booked jobs.
PipelineOn's contractor landing page research found that dedicated landing pages convert at 5–15% versus 1–3% for homepages receiving the same paid traffic — a 2–4× lift at zero added ad spend. Wisetack financing integration alone delivered a 40% lift in booking rate for contractors who added it to their service pages.
Cost Per Lead Benchmarks for Plumbing Landing Pages
Understanding cost per lead helps plumbing businesses evaluate whether their landing pages deliver acceptable unit economics relative to average job tickets and lifetime customer value. The numbers vary significantly by channel.
| Channel | CPL Range | Conversion to Job | Source |
|---|---|---|---|
| Google Ads (Non-Branded) | $183 | 28–35% | SearchLight Digital |
| Google Ads (Branded) | $45–$80 | 40–50% | SearchLight Digital |
| Google LSAs | $25–$75 | 35–45% | BaaDigi |
| Meta Ads | $72 | 20–30% | BaaDigi |
| SEO (At Maturity) | $25–$45 | 35–50% | PipelineOn |
| Angi / Thumbtack | $91+ | 15–25% | PipelineOn |
SearchLight Digital's 2026 benchmark data reveals that non-branded search campaigns cost $183 per lead for plumbing, while branded campaigns run $45–$80. BaaDigi's plumbing benchmarks show a booking rate of 41.5% once leads reach the phone — making the effective cost per booked job $312–$441 on non-branded search.
By comparison, growth marketing strategies that combine SEO-driven landing pages with paid campaigns can bring blended CPL down to $50–$80 per lead once organic rankings mature. This makes the landing page the lever that determines whether a plumbing business achieves profitable unit economics from its advertising spend.
Phone Calls vs Form Submissions: How Plumbing Leads Convert
Plumbing is a phone-first industry by a wide margin. BestPPC's campaign analysis found that 75–85% of plumbing conversions come through phone calls, not form submissions. This makes click-to-call buttons, sticky headers with phone numbers, and call tracking infrastructure non-negotiable for any plumbing landing page that wants to maximize lead capture.
Invoca's 2026 Home Services report adds important depth: across home services, 38% of calls answered by a person are genuine leads, and 45% of those leads convert on the call itself. PCN Answers' 60-million-call study found home services phone lead conversion at 46%, making phone calls the highest-quality lead channel available to plumbing businesses.
The takeaway is clear: every dollar invested in making the phone number prominent, clickable, and trackable returns more than any form-field optimization. Yet Claremont Software's 2026 audit of 47 plumber websites found that nearly one in four do not display a phone number prominently — a basic gap that costs real revenue.
Mobile Speed and Bounce Rate Statistics
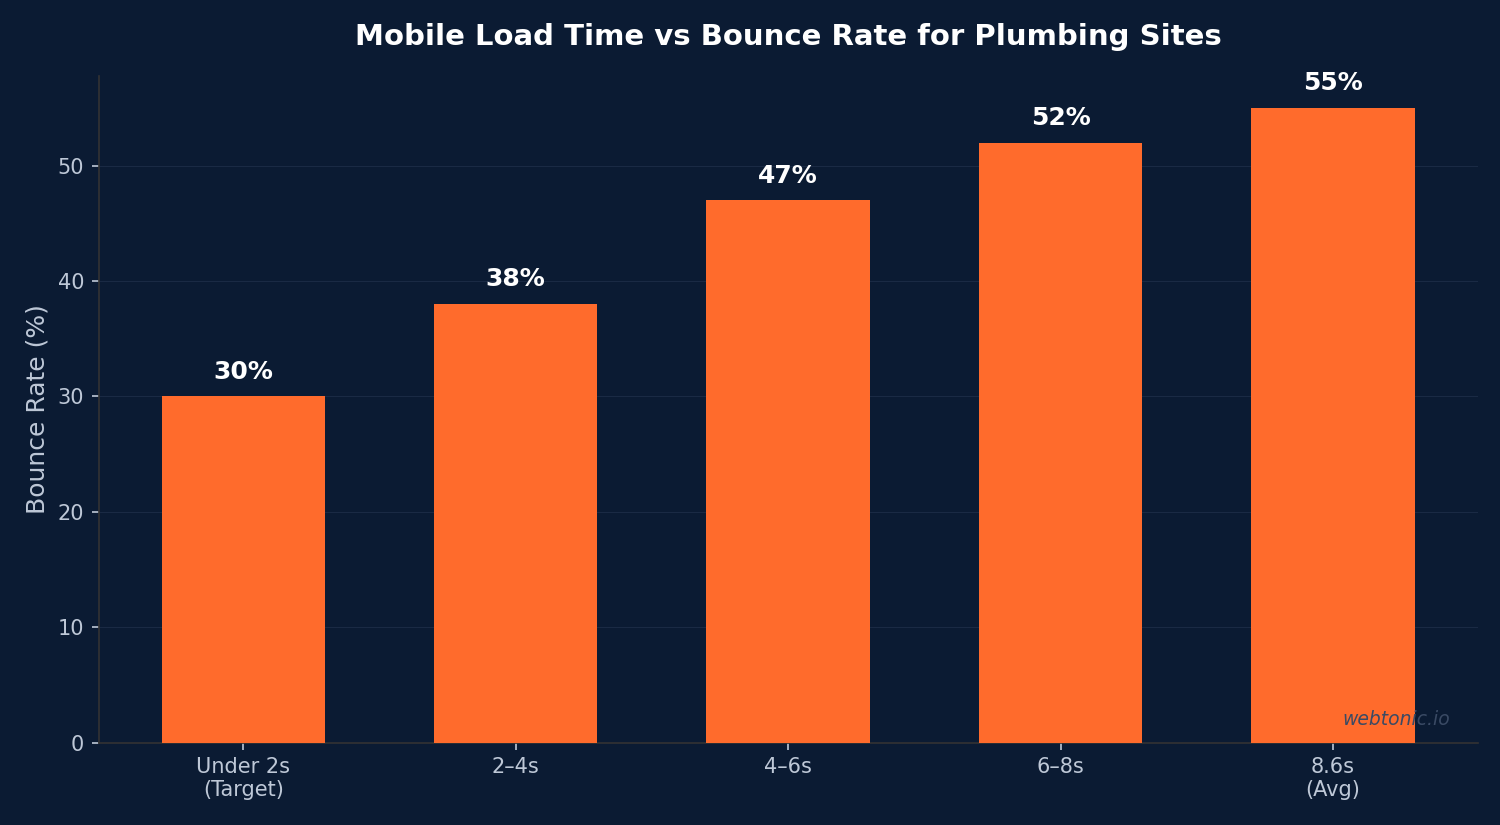
Mobile performance directly impacts whether plumbing landing pages capture or lose emergency-intent traffic. PlumbingSEO Agency's research found that the average plumbing website loads in 8.6 seconds on mobile, compared to 2.5 seconds on desktop — far above the industry target of 2.0 seconds.
According to Zipdo's plumbing industry analysis, plumbing websites carry an average bounce rate of 55%, with anything above 60% considered critically high. Mobile-optimized sites load 50% faster and reduce bounce rates by 25%. PlumbingSEO Agency's speed research also found that bounced sessions had DOM ready times 55% slower than non-bounced sessions, confirming that speed is not just a best practice — it is a direct conversion variable.
Common Plumbing Website Gaps That Kill Conversions
Claremont Software's 2026 study analyzed 47 plumber websites and found systematic gaps that explain the wide conversion-rate variance across the industry:
| Issue | Prevalence | Impact on Conversions |
|---|---|---|
| No analytics installed | ~40% of sites | Cannot measure or optimize performance |
| No prominent phone number | ~25% of sites | Blocks the primary conversion action |
| No SSL certificate | 12% of sites | Browser warnings erode visitor trust |
| No mobile-responsive design | 18% of sites | Loses 60%+ of incoming traffic |
| Missing trust signals | 35% of sites | Reduces credibility for emergency decisions |
| No clear CTA above the fold | 30% of sites | Visitors leave without taking action |
These gaps are addressable within days, not months. Installing analytics, adding a prominent phone number, and placing trust badges above the fold are the three changes that close the largest portion of the conversion gap for plumbing businesses. Combined with a strong Google Ads strategy, these landing page fixes multiply the return on every advertising dollar spent.
Landing Page Optimization Best Practices for Plumbers
The data points to a clear playbook for plumbing businesses looking to close the gap between a 1.5% conversion rate and the 12–16% ceiling. Here are the highest-impact changes, ranked by expected lift:
- Add a sticky click-to-call header — with 75–85% of conversions happening by phone, this single element has the highest conversion impact available on any plumbing landing page.
- Achieve sub-2-second mobile load time — compress images, defer scripts, and use a CDN. The gap between 8.6s average and 2.0s target represents the biggest bounce-rate reduction opportunity in the vertical.
- Install conversion tracking — the 40% of plumber sites without analytics are optimizing blind. Implement call tracking (CallRail or Invoca) and form tracking simultaneously to measure what actually generates booked jobs.
- Add trust signals above the fold — license numbers, insurance badges, Google review ratings, and "same-day service" guarantees address the trust deficit that emergency-intent visitors need resolved before they call.
- Build single-service landing pages — performance creative that matches ad copy to page headline lifts Quality Score and reduces CPC by 15–30%, while improving relevance for the visitor.
Plumbing Landing Pages vs Other Home Services
| Vertical | Avg LP CVR | Avg CPL | Phone Share |
|---|---|---|---|
| Plumbing | 5–15% | $129–$183 | 75–85% |
| HVAC | 4–12% | $90–$150 | 70–80% |
| Electrical | 3–10% | $110–$170 | 65–75% |
| Roofing | 3–8% | $80–$200 | 50–65% |
| Home Services Avg | 5–15% | $100–$175 | 60–75% |
Plumbing leads the home services sector in landing page conversion potential because of the emergency-driven nature of demand. When a pipe bursts, the searcher has high intent and low comparison-shopping tolerance — making the first credible landing page they find the one that wins the job. Understanding Google Ads cost structures helps plumbing operators budget appropriately for this high-converting traffic source.
Emergency vs Planned Plumbing Landing Pages: Conversion Differences
Not all plumbing landing pages serve the same intent, and the conversion dynamics differ significantly between emergency and planned service pages. Emergency pages — targeting keywords like "burst pipe repair" or "emergency plumber near me" — typically convert at the high end of the 12–16% range because the visitor has immediate, non-negotiable need and virtually zero patience for comparison shopping.
Planned service pages — targeting keywords like "water heater installation" or "bathroom remodel plumbing" — convert at 5–8% because visitors research multiple providers before committing. These pages require more trust-building elements: project galleries, detailed pricing ranges, warranty information, and customer testimonial videos to overcome the longer consideration cycle.
The strategic implication is clear: plumbing businesses should build separate landing pages for emergency and planned intent, each optimized with different CTA hierarchies, trust signals, and content depth. Emergency pages prioritize speed and phone access above all else, while planned pages benefit from comprehensive information that supports a slower decision process. Both page types should include Meta Ads integration for retargeting visitors who do not convert on the first visit.
The Landing Page Testing Opportunity for Plumbing Businesses
Despite the clear conversion gap between optimized and unoptimized plumbing landing pages, very few plumbing businesses conduct systematic A/B testing. Claremont Software's 2026 study found that nearly 40% of plumber websites lack analytics entirely — meaning they cannot measure conversion rates, let alone test variations to improve them.
For the businesses that do test, the data shows that the following elements produce the largest conversion lifts when tested systematically: CTA button color and placement (typical lift of 10–25%), headline matching ad copy (15–30% Quality Score improvement), form length reduction (removing one field lifts form conversions by 5–10%), and social proof placement (moving Google reviews above the fold lifts trust-based conversions by 8–15%). Every plumbing business spending over $3,000 per month on advertising should be running at least one landing page test at all times to compound these gains across their marketing budget.
Related reading
- Roofing Landing Page Statistics (2026): Conversion Rates, Speed & CRO Data
- Surrogacy Landing Page Statistics 2026: CRO Benchmarks & Data
- Veterinary Landing Page & CRO Statistics: 2026 Data & Benchmarks
- Landing Page Design services at Web Tonic
FAQ
What is a good conversion rate for a plumbing landing page?
A well-optimized plumbing landing page converts at 5–15%, while the industry average for plumbing homepages sits at 1.5–3%. Top-performing operators reach 12–16% by using click-to-call CTAs, trust badges, and sub-2-second load times.
How much does a plumbing lead cost from a landing page?
Plumbing leads from Google Ads landing pages cost $129–$183 depending on whether campaigns target branded or non-branded keywords. SEO-driven landing pages produce leads at $25–45 once the page reaches maturity after 12+ months.
Should plumbing landing pages prioritize phone calls or form fills?
Phone calls. Across plumbing campaigns, 75–85% of conversions come through calls rather than forms. Phone leads convert at 46% for home services compared to roughly 2–5% for form submissions.
How does mobile speed affect plumbing landing page performance?
The average plumbing website loads in 8.6 seconds on mobile versus the 2.0-second industry target. Mobile-optimized sites load 50% faster and reduce bounce rates by 25%, directly improving lead volume from the same traffic.
How many plumbing websites lack basic conversion tracking?
A 2026 study of 47 plumber websites found that nearly 40% have no analytics installed, and 25% do not display a phone number prominently — two gaps that prevent any meaningful conversion optimization.
Sources
Astra Results — Plumbing Website Conversion
BaaDigi — Plumbing Marketing Benchmarks 2026
PipelineOn — Contractor Landing Page Tips
SearchLight Digital — Plumbing Google Ads CPL
BestPPC — Landing Pages for Plumbing Ads
Zipdo — Marketing in the Plumbing Industry
Claremont Software — 47 Plumber Websites Study
Invoca — Home Services Lead Conversion
PCN Answers — Calls vs Forms Study
PlumbingSEO Agency — Plumber Website Speed


