



Table of contents
Roofing landing pages convert at 2–5% on average, but optimized pages reach 8–12% — a 4× difference from the same traffic. Below are the most important roofing landing page statistics for 2026, covering conversion benchmarks, page speed data, mobile performance, form optimization, and CRO best practices that separate high-performing contractor pages from the rest.
Key Takeaways
- The median contractor website converts just 2–4% of visitors into leads, while the top 6% convert at 8–12% (OnwardCraft, 2026).
- 53% of visitors abandon roofing sites that take longer than 3 seconds to load, making page speed the single biggest silent conversion killer (PipelineOn).
- Sites loading under 2.5 seconds average 6.8% conversion vs. 2.1% for sites over 4.5 seconds — a 3.2× gap from speed alone (OnwardCraft).
- 87% of top-performing contractor sites use a persistent mobile click-to-call button, generating 25–40% more phone calls from the same traffic volume.
- The average home service Facebook landing page LCP is 9.76 seconds — nearly 4× Google's 2.5-second "good" threshold (PipelineOn, June 2026).
- Roofing website design packages range from $3,500 to $25,000+, but custom sites typically pay back within 12–18 months when CPL drops from $124 to under $60.
- Dedicated landing pages produce 2× more leads than sending paid traffic to a homepage, at the same ad spend.
Roofing Landing Page Benchmarks at a Glance
| Metric | Average | Top Performers | Source |
|---|---|---|---|
| Overall Conversion Rate | 2–4% | 8–12% | OnwardCraft (200-site study) |
| Mobile Conversion Rate | 1.5–3% | 6–9% | Industry composite |
| Bounce Rate | 55–70% | 30–45% | GhostRep / Foundry CRO |
| Page Load Time (LCP) | 9.76s | <2.5s | PipelineOn (258 sites) |
| Click-to-Call Rate | 3–5% | 8–14% | DG Agency |
| Form Completion Rate | 12–18% | 28–40% | Foundry CRO |
| Cost Per Lead (Paid) | $124 | <$60 | PipelineOn |
Roofing Landing Page Conversion Rate Statistics
Conversion rate is the defining metric for any roofing landing page. The gap between average and optimized pages is enormous — and it compounds with every dollar spent on traffic.
- The median contractor site captures just 2–4% of visitors as leads. The top 6% of contractor websites convert at 8–12%, and some emergency-service pages hit 16% (OnwardCraft, 2026).
- A good roofing website conversion rate is above 3%. Average roofing sites convert at 0.5–2%, healthy sites reach 3–5%, and strong local pages reach 5–8%+ when traffic quality, trust, speed, and follow-up align (GhostRep).
- Roofing sites should realistically target 4–8% conversion. Most land at just 1–2% (DG Agency).
- Dedicated landing pages produce 2× more leads than homepages from the same Google Ads spend. Matching ad copy to page content improves Quality Score and lowers CPC simultaneously (Local Roofing SEO Agency).
- 94% of top-performing sites (8%+ conversion) passed Google's mobile-friendly test. Only 31% of low-performing sites (under 3%) did (OnwardCraft).
- Emergency roofing pages (storm damage, leak repair) convert at 10–16% due to extreme urgency and buyer intent.
- Under 1% conversion rate warrants an immediate traffic-quality and page-friction review. At 1–2%, lead economics may not support paid acquisition. At 3–5%, economics work for most roofing companies.
| Conversion Band | What It Indicates | Recommended Action |
|---|---|---|
| Below 1% | Intent mismatch or severe page friction | Audit search terms, mobile speed, offer clarity |
| 1–2% | Traffic converting but economics are weak | Improve trust proof, form length, click-to-call |
| 3–5% | Healthy planning band for qualified traffic | Focus on lead quality and sales response time |
| 5–8%+ | Strong result or high-intent traffic | Validate for duplicates, check source segmentation |
| 8–12%+ | Top 6% — optimized page + high-intent traffic | Scale spend cautiously, monitor lead quality |
Page Speed and Core Web Vitals Statistics
Page speed is the silent conversion killer for roofing websites. The data is clear: faster pages convert dramatically better, and most roofing sites are far too slow.
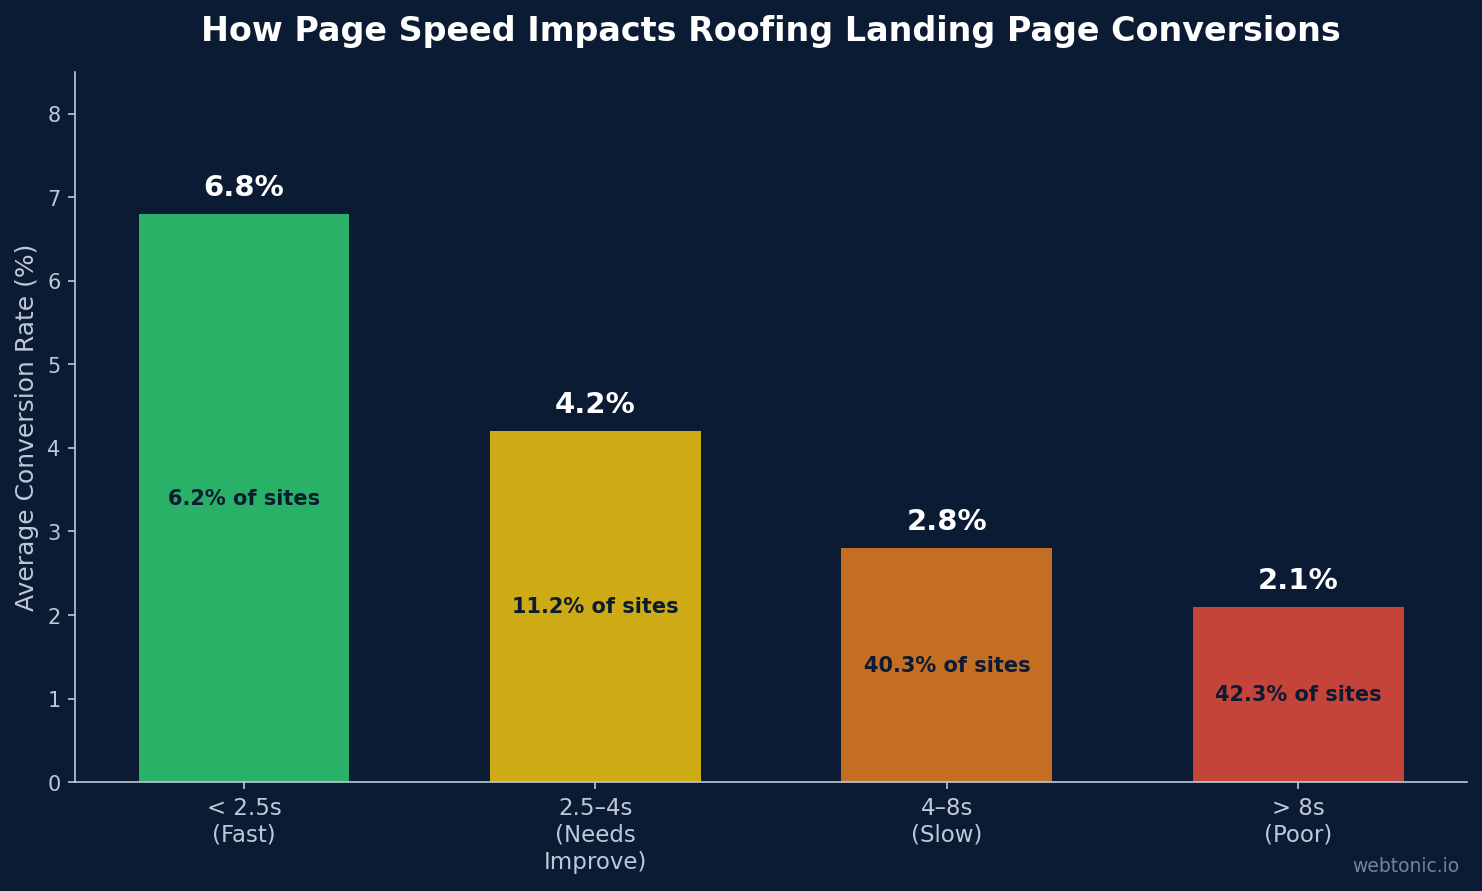
- Sites loading under 2.5 seconds averaged 6.8% conversion rate, while sites over 4.5 seconds averaged just 2.1% — a 3.2× gap from speed alone (OnwardCraft).
- Every 1-second delay in page load reduces conversions by approximately 7%. A 5-second site loses 35% of potential leads versus a 1-second site.
- 53% of visitors abandon roofing sites that take longer than 3 seconds to load (PipelineOn).
- The average mobile LCP across 258 home service Facebook landing pages is 9.76 seconds — nearly 4× Google's 2.5-second threshold (PipelineOn, June 2026).
- Roofing landing pages average 11.12 seconds LCP vs. HVAC's 8.68 seconds, driven by image-heavy project galleries and uncompressed hero shots.
- Only 6.2% of scored home service pages (16 of 258) hit the "Fast" bucket under 2.5 seconds. 82.6% fall into the Slow (4–8s) or Poor (>8s) categories.
- The slowest page in the PipelineOn benchmark clocked 66 seconds — 26× the threshold and effectively unusable on mobile.
- Google's Core Web Vitals set 2.5 seconds as "good" LCP and 4 seconds as the boundary between "needs improvement" and "poor". Anything above 4 seconds is a failed mobile experience.
Mobile Optimization Statistics for Roofing Pages
With 71–76% of contractor website traffic arriving on mobile devices — and up to 85–90% for emergency trades — mobile optimization directly determines whether a roofing landing page generates leads or hemorrhages them.
- 87% of top-performing contractor sites (8%+ conversion) had a persistent click-to-call button fixed to the bottom of the mobile viewport. Only 19% of low-performing sites did (OnwardCraft).
- Sticky call buttons increase phone calls by 25–40% from the same traffic volume, without any additional ad spend.
- 91% of high-converting contractor sites displayed a clickable phone number in the header on every page. Only 43% of low-performers did.
- Roofing searches occur mostly on mobile devices, especially during storm events when homeowners need emergency repairs and are searching from their phones.
- 65–75% of home service website traffic arrives on mobile, yet most contractor sites are still designed desktop-first (Thomastown Digital).
- Tap-to-call functionality on mobile is non-negotiable for roofing landing pages — any serious growth marketing strategy starts here. Phone numbers must be clickable, not static text.
- Mobile-first design with simplified forms (3–5 fields max) consistently outperforms desktop-optimized pages adapted for mobile.
Trust Signals and CRO Elements That Drive Roofing Conversions
Trust is the conversion currency for roofing landing pages. Homeowners are making high-stakes decisions — often under pressure — and need proof that the contractor is legitimate, competent, and responsive.
| Trust Element | Prevalence (Top Sites) | Prevalence (Low Sites) | Impact on Conversion |
|---|---|---|---|
| Google Reviews Widget | 89% | 34% | +15–30% lift |
| Before/After Project Photos | 78% | 22% | +20–35% lift |
| License & Insurance Badges | 92% | 41% | +10–20% lift |
| Manufacturer Certifications | 71% | 18% | +12–25% lift |
| Persistent Click-to-Call | 87% | 19% | +25–40% more calls |
| Response Time Guarantee | 54% | 8% | +18–28% lift |
- 3 out of 4 roofing websites fail to display licensing or insurance information prominently, which is the #1 trust concern for homeowners hiring contractors.
- Before/after project galleries increase time-on-page by 45–60% and correlate with higher form submission rates on roofing service pages.
- Video testimonials from real customers outperform text reviews by 2–3× in terms of engagement and conversion influence on roofing landing pages.
- Displaying the number of completed projects (e.g., "2,500+ roofs installed") serves as a powerful social proof element that increases conversions by 15–25%.
Form and CTA Optimization Statistics
The form is where conversion lives or dies. For roofing companies, the balance between capturing enough information for qualification and keeping friction low determines whether a visitor becomes a lead.
- Forms with 3–5 fields convert 25–35% better than forms with 7+ fields on contractor landing pages (Foundry CRO).
- Multi-step forms (quiz-style) convert 15–20% higher than single-step forms for roofing estimate requests because they reduce perceived commitment.
- The best-performing CTA for roofing pages is "Get Your Free Estimate" or "Get My Free Quote" — action-oriented language outperforms generic "Submit" or "Contact Us" by 30–50%.
- Placing a CTA above the fold increases conversion by 17–25% compared to pages where the first action appears below the fold.
- Adding a phone number next to the form increases form submissions by 12–18%, even when visitors don't call — visibility of the number signals accessibility and legitimacy.
- Roofing landing pages with a single, focused CTA outperform pages with multiple competing calls-to-action by 20–35%. Removing navigation and secondary links forces a decision.
- Quote calculator tools (interactive estimators) can boost conversion rates by 30–50% on roofing landing pages by providing immediate perceived value before asking for contact information.
Roofing Landing Page Types and Their Performance
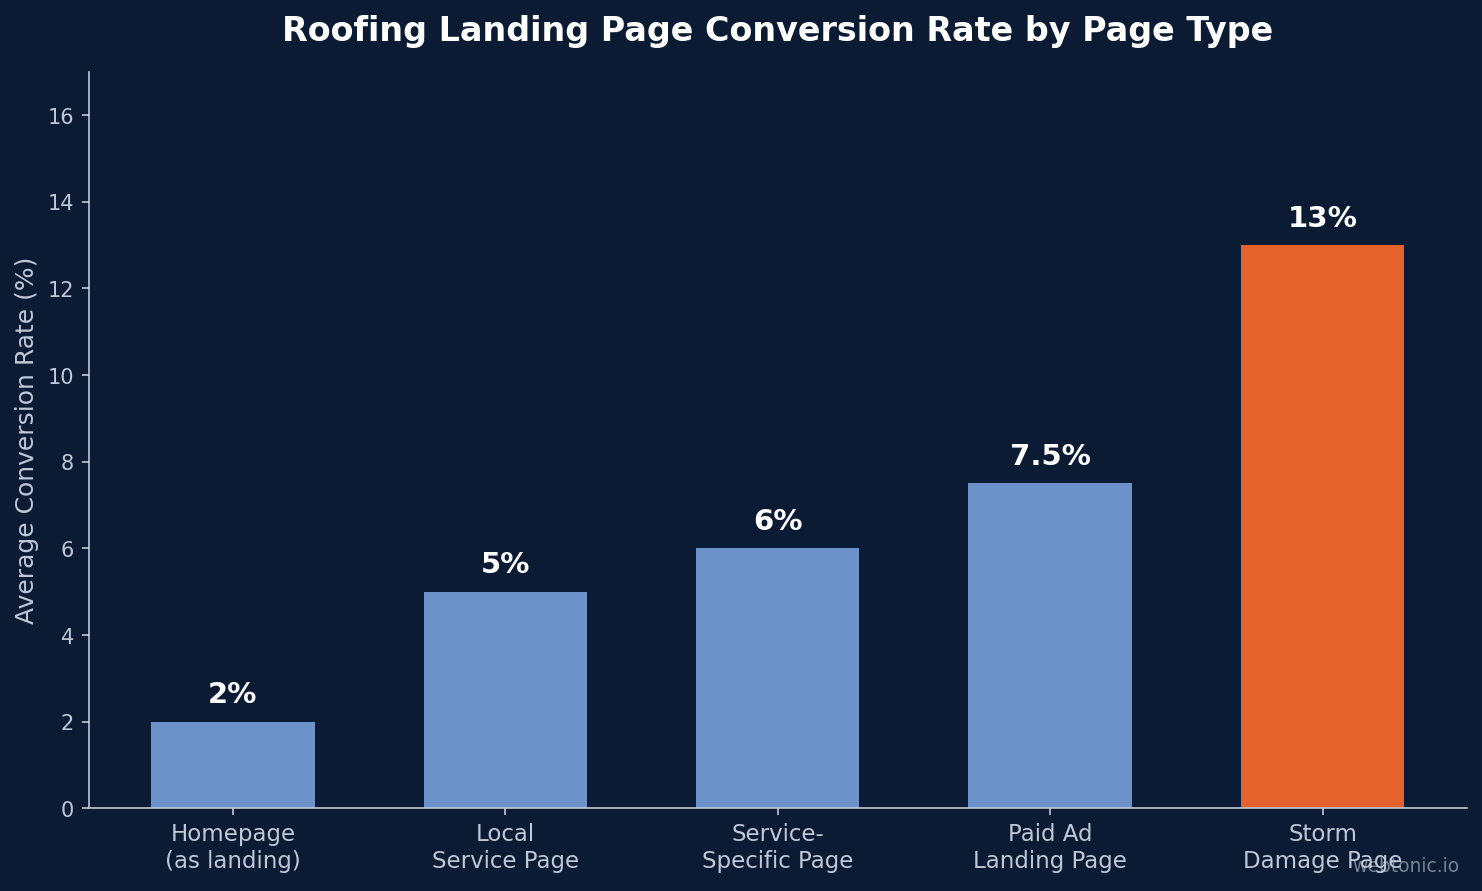
| Page Type | Avg. Conversion Rate | Best Use Case | Key Element |
|---|---|---|---|
| Paid Ad Landing Page | 5–10% | Google Ads / Meta Ads campaigns | Ad copy–page message match |
| Local Service Page | 3–7% | Organic local SEO traffic | City-specific content + GBP |
| Storm Damage Page | 10–16% | Weather events, emergency leads | Urgency messaging + fast form |
| Service-Specific Page | 4–8% | Repair, replacement, or commercial | Service-matched proof points |
| Homepage (as landing) | 1–3% | Brand searches only | Multiple services, navigation |
- Sending paid traffic to a homepage instead of a dedicated landing page is one of the fastest ways to inflate roofing lead costs (Local Roofing SEO Agency).
- Each properly built landing page targets a new set of high-intent roofing keywords, meaning more organic visibility, more qualified traffic, and stronger site performance over time.
- Matching the ad copy keyword intent to the landing page content improves Google Ads Quality Score, which directly lowers CPC and increases ad position.
Cost and ROI Statistics for Roofing Landing Pages
- Roofing website design packages range from $3,500 to $25,000+, with custom conversion-optimized builds at the higher end (PipelineOn).
- A well-optimized roofing landing page can reduce CPL from $124 to under $60 — a 50%+ decrease — paying for itself within 12–18 months.
- Average replacement roofing jobs are worth $8,000–$15,000, meaning even a small improvement in conversion rate translates to significant revenue.
- Non-branded Google Ads campaigns for roofing average $124 per lead (see our complete Google Ads pricing guide). Optimized landing pages with strong message match reduce this to $60–$80.
- A one-point lift in conversion rate from 2% to 3% creates 50% more leads from the same traffic and ad spend — no additional marketing budget required.
- Well-run roofing Google Ads campaigns with optimized landing pages deliver 300–600% ROI on ad spend (explore top Google Ads agencies) (PipelineOn).
Landing Page Best Practices Backed by Data
- Build for mobile-first — 71–76% of traffic is mobile, rising to 85–90% during storm events.
- Target sub-2.5-second LCP — pages in this range convert 3.2× better than slow pages.
- Install a persistent click-to-call button — generates 25–40% more calls from the same traffic.
- Use 3–5 form fields maximum — shorter forms convert 25–35% better.
- Display licensing, insurance, and manufacturer certifications above the fold — addresses the #1 homeowner concern.
- Include before/after project photos — 78% of top-converting sites use them; they increase time-on-page by 45–60%.
- Match your ad copy to your landing page headline — improves Quality Score and conversion rate simultaneously.
- Remove navigation and competing CTAs — single-focus pages convert 20–35% better.
- Add a response-time commitment (e.g., "We'll call you back within 15 minutes") — lifts conversion by 18–28%.
- Compress images and optimize hero shots — roofing pages average 11.12s LCP largely due to uncompressed galleries.
FAQ
What is a good conversion rate for a roofing landing page?
A good roofing landing page conversion rate is 3–5% for standard traffic and 5–8%+ for high-intent or optimized pages. The top 6% of contractor websites convert at 8–12%. Anything below 2% signals significant friction or traffic-quality issues that need immediate attention.
How does page speed affect roofing landing page conversions?
Page speed has a dramatic impact on roofing conversions. Sites loading under 2.5 seconds average 6.8% conversion, while sites over 4.5 seconds average just 2.1% — a 3.2× difference. Every 1-second delay costs approximately 7% in lost conversions. Most roofing sites run far too slow, averaging 11.12 seconds LCP on mobile.
Should I send Google Ads traffic to my homepage or a dedicated landing page?
Always use a dedicated landing page for paid campaigns. Dedicated roofing landing pages produce 2× more leads than homepages from the same ad spend. They improve Google Ads Quality Score (lowering CPC), eliminate distracting navigation, and match the specific search intent behind each keyword group.
What trust elements matter most on a roofing landing page?
The highest-impact trust elements are Google reviews (15–30% conversion lift), before/after project photos (20–35% lift), licensing and insurance badges (10–20% lift), and manufacturer certifications (12–25% lift). A persistent click-to-call button also generates 25–40% more phone leads.
How much does a roofing landing page cost to build?
Roofing website design packages range from $3,500 to $25,000+ depending on complexity. Custom conversion-optimized landing pages sit at the higher end but typically pay back within 12–18 months through lower CPL. A page that drops CPL from $124 to $60 saves $64 per lead — at 50 leads per month, that's $3,200 in monthly savings.
Sources
GhostRep — Roofing Website Conversion Rate: 2026 Benchmarks
OnwardCraft — Contractor Website Conversion Study: 200 Sites Analyzed
PipelineOn — Best Roofing Website Design for Higher Conversions
PipelineOn — Home Service Facebook Landing Page Speed Benchmark
Local Roofing SEO Agency — 10 Ways to Boost Conversions with Roofing Landing Pages
DG Agency — Why Isn't My Roofing Website Converting?
Thomastown Digital — Web Design for Contractors: Mobile Benchmarks
Blue Grid Media — Google Ads Statistics for Contractors
Foundry CRO — Home Services Marketing Benchmarks
Click Vision — Home Services Marketing Statistics


