



Table of contents
Product page clips increase add-to-cart rates by 120% in electronics ecommerce, and 85% of consumers say video content helps them decide whether to purchase a tech product. Here are the benchmarks, format comparisons, and ROI data that phone and tech retailers need to build an effective strategy around moving images.
Key Takeaways
- Product clips boost add-to-cart rates by 120% in electronics ecommerce, with 85% of consumers saying moving-image content helps their purchase decision.
- UGC clips lift conversion rates 25–35% for electronics and tech, outperforming professionally produced brand content in most A/B tests.
- Shoppable clips drive a median 17% sitewide conversion rate lift, translating to approximately $840K in annual incremental revenue for a $500K/month store.
- Short-form ad spending reached $111 billion in 2025 and is projected to hit $145.8 billion by 2028.
- 60% of electronics consumers complete purchases after watching a short demonstration clip under 3 minutes.
- Meta moving-image shopping ads produce 127% higher conversion rates compared to static image-based product ads.
Phone & Tech Retail Moving-Image Marketing Benchmarks at a Glance
These benchmarks aggregate data from industry studies covering electronics brands, Shopify merchants, and enterprise retailers. The data spans product page clips, short-form social content, shoppable formats, and live commerce sessions — all measured in 2025–2026.
| Metric | Electronics Benchmark | All-Industry Average | Source |
|---|---|---|---|
| Add-to-Cart Lift (Product Page) | +120% | +30–80% | Zipdo |
| UGC Content CVR Lift | +25–35% | +15–25% | Eevy.ai |
| Shoppable Format CVR Lift | +17% sitewide | +10–15% | Whatmore.ai |
| Completion Rate (Short Demos) | 60% | 50–55% | Zipdo |
| Repeat Purchase Lift (Commerce) | +275% | +150% | Firework |
| Short-Form Global Spend (2026) | $145.8B projected | — | ShortsIntel / ReelFlood |
Source: Aggregated from Zipdo, Eevy.ai, Whatmore.ai, Firework, ReelFlood (2025–2026 data).
Product Page Clips: The Conversion Driver Electronics Retailers Underuse
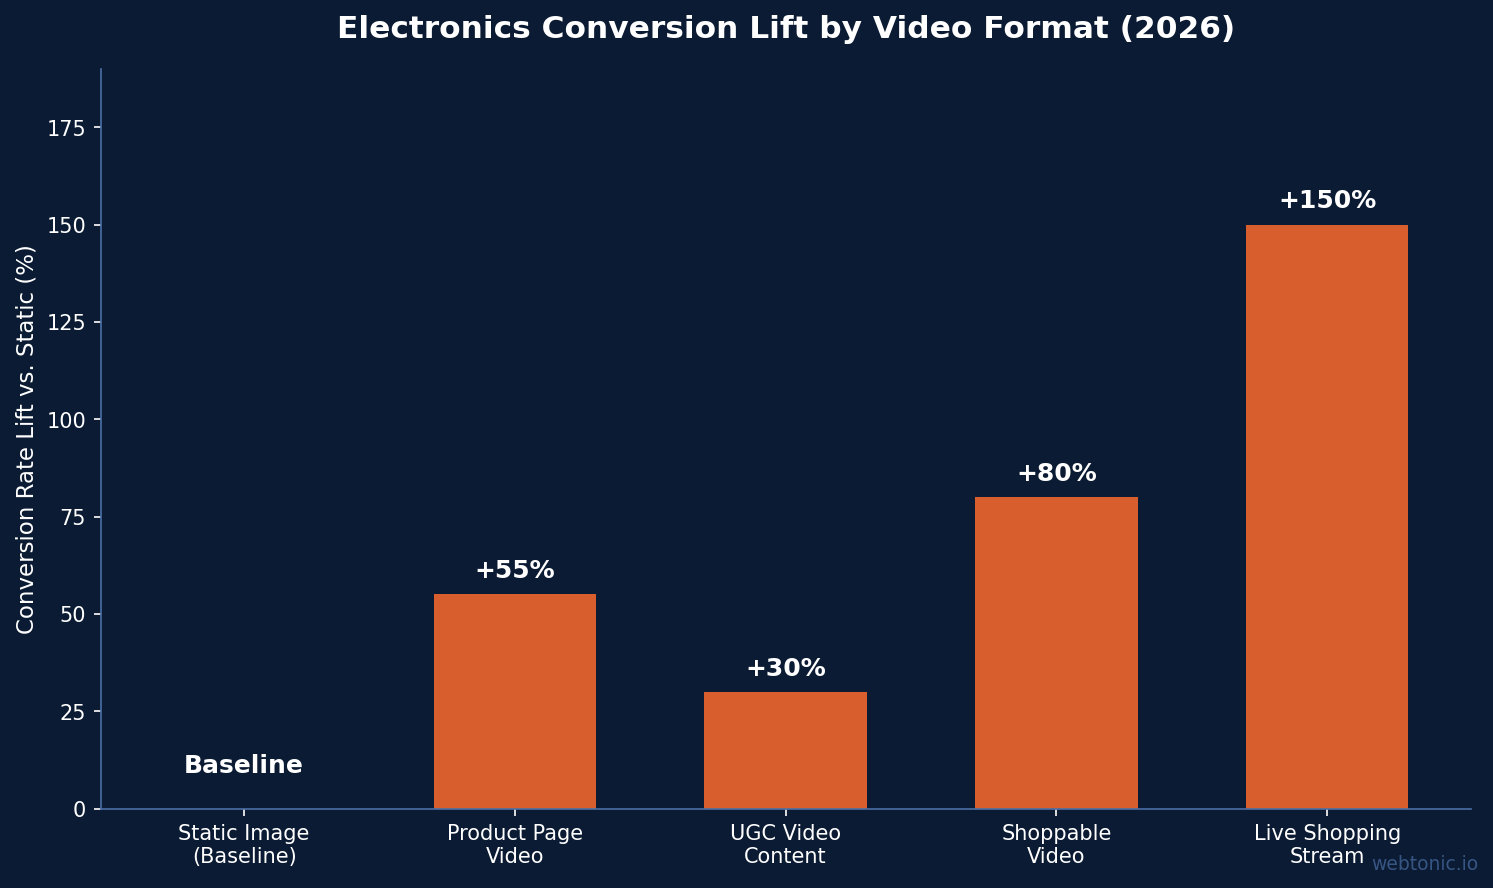
The data is unambiguous: product page clips increase add-to-cart rates by 120% in electronics ecommerce. Yet a substantial majority of today's Shopify electronics stores still rely primarily on static photography. The gap between early adopters and the rest of the market is widening as consumers increasingly expect dynamic product content.
According to Zipdo, 85% of consumers say moving-image content helps them decide to purchase, and 60% complete purchases after watching a short product demonstration under 3 minutes. For tech products where functionality is hard to convey through images — headphones, smart home devices, tools, wearable tech — the lift is even more pronounced.
The optimal approach combines multiple clip types on a single product page: a hero product demonstration (30–90 seconds), a feature comparison against alternatives, and a customer-generated clip showing real-world usage. Stores implementing this full stack see conversion rates climb to 4.2–5.0%, nearly double the electronics median.
User-Generated Clips: The Highest-ROI Content Format for Tech
User-generated moving-image content outperforms professionally produced brand content for electronics in nearly every measurable dimension. According to Eevy.ai, electronics stores see 25–35% higher conversion rates when UGC clips are prominently featured on product pages.
- 25–35% CVR lift for electronics and tech — the highest UGC lift of any ecommerce category, driven by the complexity of tech products.
- Content showing real product functionality — such as headphone sound quality comparisons, smart home setup walkthroughs, and phone case drop tests — generates the strongest conversion impact.
- 92% of consumers trust user-generated content more than traditional advertising, making UGC the most credible format for considered purchases.
- Brands repurposing UGC clips into paid social ads see 31% higher hook rates compared to studio-produced creative, according to Benly.ai.
The cost economics further favor UGC. Professional product demonstrations cost $500–$2,000 per clip, while incentivized customer content averages $50–$150 per submission. For electronics brands managing hundreds of SKUs, the scalability of UGC is a decisive operational advantage.
Unboxing and Demo Content: The Electronics-Specific Format
Unboxing content has evolved from a YouTube curiosity into a mainstream purchase-influence channel for phone and tech retail. Over 2 million clips populate under the #unboxing hashtag on YouTube alone, and the top technology unboxing clip has accumulated more than 19 million views. For electronics brands, unboxing content serves a dual purpose: it generates organic awareness and provides post-purchase reassurance that reduces returns.
Samsung's social shopping livestream demonstrated the format's commercial potential, generating 967K+ views with a 92-second average watch time and an unboxing click-through rate of 21.47% — significantly above the 13% industry benchmark. The customer-handoff format, where real customers film their first interaction with a product, outperforms standard brand-produced demonstrations by 30% according to platform benchmarks.
For phone and tech retailers, the unboxing format works particularly well because it mirrors the actual customer experience. Potential buyers see the packaging, the included accessories, the initial setup process, and the first-use impressions — all of which influence purchase confidence. Gadget unboxing channels on YouTube earn $5–$12+ RPM, making this a viable creator partnership strategy where brands can offset production costs through affiliate and sponsorship structures.
Shoppable Format Performance and Commerce Integration
Shoppable clips — embedded product links within moving-image content — are emerging as the highest-converting format for electronics retailers. According to Whatmore.ai, shoppable formats drive a median 17% sitewide conversion rate lift based on 50/50 traffic-split testing.
| Shoppable Format Metric | Benchmark | Source |
|---|---|---|
| Sitewide CVR Lift (Median) | +17% | Whatmore.ai |
| Annual Incremental Revenue | ~$840K (for $500K/mo store) | Whatmore.ai |
| Add-to-Cart Rate | 3–5% | Bambuser |
| Click-Through Rate Lift | +248% vs. static | OnlineStoreNews |
| CE Repeat Purchase Lift | +275% | Firework |
| CE Share of Total GMV | 43% (via shoppable) | Firework |
Source: Whatmore.ai, Bambuser, OnlineStoreNews, Firework (2025–2026 data).
The Firework State of Commerce 2025 report found that consumer electronics brands using shoppable formats saw 275% more repeat purchases and that shoppable content contributed to 43% of total GMV. These figures position shoppable clips not as an experimental add-on but as a core commerce channel for phone and tech retailers.
Short-Form Content: Market Size and Platform Adoption
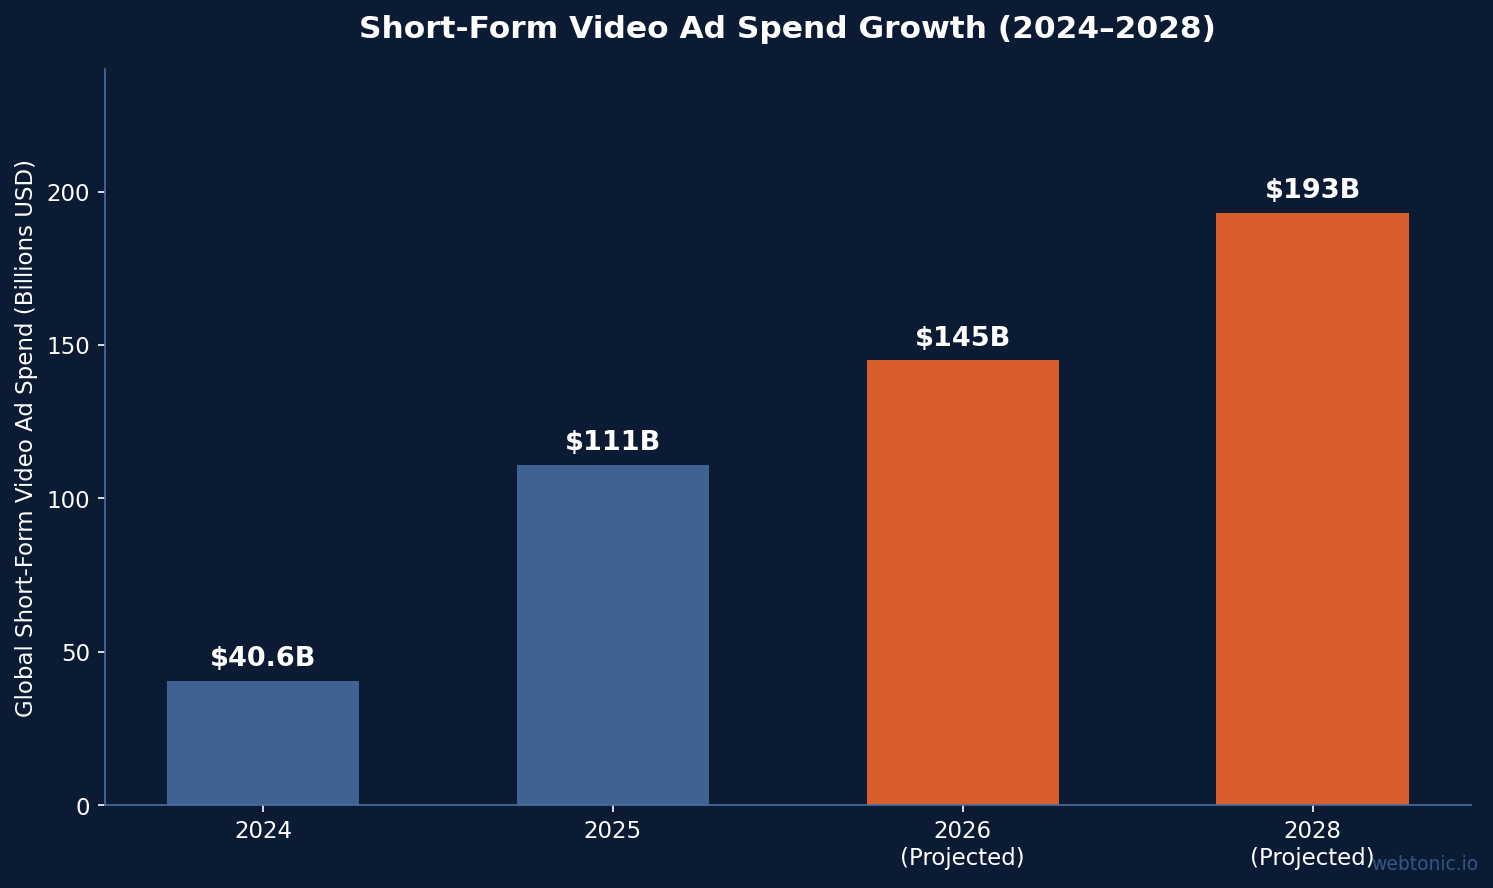
Short-form moving-image content has become the dominant advertising format globally. 91% of businesses use motion content as a marketing tool in 2026, up 11 percentage points since 2024. Short-form content specifically accounts for $111 billion of the $236 billion in global advertising spend for this format — roughly half the total market.
- Short-form market valued at $40.58 billion in 2024, projected to reach $193 billion — a nearly 5x increase driven by TikTok, Reels, and Shorts adoption.
- TikTok has 1.59 billion monthly active users, making it the largest short-form platform by engagement volume.
- Retail brands using Reels and creators see 71% higher brand intent lift and 19% lower acquisition costs, according to Shopify.
- Meta's moving-image shopping ads deliver 127% higher conversion rates, 89% higher click-through rates, and 52% better ROAS compared to static image ads.
For phone and tech retailers, short-form content is particularly effective because tech products benefit from dynamic demonstration. A 15-second clip showing a phone case absorbing a drop impact communicates more persuasively than any number of static images, and performance creative teams are increasingly building their entire production strategies around motion-first workflows. The compounding effect of cross-platform repurposing — where a single product demonstration can be adapted for TikTok, Instagram Reels, YouTube Shorts, and on-site product pages — makes short-form content one of the highest-leverage investments available to electronics marketers in 2026.
Best Practices for Phone & Tech Retail Clip Strategy
- Add product demonstrations to every electronics product page — 120% add-to-cart lift justifies the production investment. Start with top 20% of SKUs by revenue.
- Incentivize customer-generated content — UGC delivers 25–35% CVR lift at a fraction of professional production costs. Offer store credit or discounts for quality submissions.
- Implement shoppable formats on product pages — 17% sitewide conversion lift and 248% higher CTR make this format a high-ROI priority.
- Keep product demonstrations under 3 minutes — 60% of consumers complete purchases after watching short demos. Front-load the key feature or benefit within the first 5 seconds.
- Repurpose content across channels — a single product demonstration clip can be edited for TikTok, Reels, product pages, and email campaigns.
- Test live commerce events for high-ticket products — live sessions convert at 4–6%, and real-time Q&A addresses the objections that slow electronics purchases.
- Track full-funnel attribution — product page clips influence purchase decisions earlier in the funnel. Use attribution tools to capture the full impact beyond last-click.
Electronics vs. Other Industries: Moving-Image Marketing Comparison
Electronics outperforms most verticals in clip-driven conversion lift because the product category benefits disproportionately from dynamic demonstration. Fashion and beauty see strong engagement metrics, but the conversion impact of product clips is highest where functionality is complex and hard to communicate through static imagery alone. This advantage compounds with product price — higher-AOV items like smartphones, laptops, and smart home systems see the largest absolute revenue lift from moving-image content.
| Metric | Electronics | Fashion | Beauty | Home |
|---|---|---|---|---|
| Product Page CVR Lift | +120% | +40–60% | +30–50% | +25–40% |
| UGC CVR Lift | +25–35% | +15–20% | +20–30% | +10–15% |
| Shoppable Format CVR Lift | +17% | +12% | +15% | +8% |
| Consumer Decision Impact | 85% | 70% | 75% | 60% |
| Repeat Purchase Lift (Commerce) | +275% | +180% | +200% | +120% |
Source: Zipdo, Eevy.ai, Whatmore.ai, Firework (2025–2026 data).
Related reading
- Phone & Tech Retail Branding Statistics: Logo, Identity and ROI Data for 2026
- Phone & Tech Retail Ad Creative Stats
- What B2B Tech Marketers Should Budget for Video in 2026
- Branding services at Web Tonic
FAQ
How much do product clips increase conversions for electronics?
Product page clips increase add-to-cart rates by 120% in electronics ecommerce, according to Zipdo. 85% of consumers say dynamic product content helps their purchase decision, and 60% complete purchases after watching a short demonstration under 3 minutes.
Is user-generated content effective for tech products?
Highly effective. Electronics stores featuring UGC clips see 25–35% higher conversion rates — the highest UGC lift of any ecommerce category. Content showing real product functionality, such as sound quality comparisons or durability tests, generates the strongest impact.
What are shoppable clips and how do they perform for electronics?
Shoppable clips embed product links directly within moving-image content, allowing viewers to purchase without leaving the clip. They drive a median 17% sitewide conversion rate lift and 248% higher click-through rates compared to static formats. For electronics specifically, shoppable content contributes to 43% of total GMV among adopting brands.
How large is the short-form content advertising market?
Short-form ad spending reached $111 billion in 2025 and is projected to hit $145.8 billion by 2028. The broader market was valued at $40.58 billion in 2024 and is projected to reach $193 billion. 91% of businesses now use motion content as a marketing tool.
Should electronics brands prioritize live commerce events?
Live commerce shows strong potential for electronics. Live sessions convert at 4–6% for well-seeded events, and the US live shopping market is projected at $68 billion for 2026. Electronics products particularly benefit from real-time Q&A and live demonstrations that address buyer objections on the spot.
Sources
Zipdo — Marketing in the Electronics Industry 2026
Eevy.ai — UGC Conversion Statistics 2026
Whatmore.ai — Shoppable Benchmarks 2026
Firework — State of Commerce 2025
ReelFlood — Short-Form Statistics 2026
Kapwing — Short-Form Stats 2026
Shopify — Marketing Statistics
Ecommerce Times — Meta Shopping Ads
FoundryCRO — Ecommerce Marketing Benchmarks 2026
CuFinder — Consumer Electronics Marketing Benchmarks


