Table of contents
Device brand loyalty has hit record highs — 96.4% for iPhone and 86.4% for Android — which means the phone on the shelf no longer differentiates anyone. The retailer’s own brand does, and the data on what that is worth is messier than the headline numbers suggest.
Key Takeaways
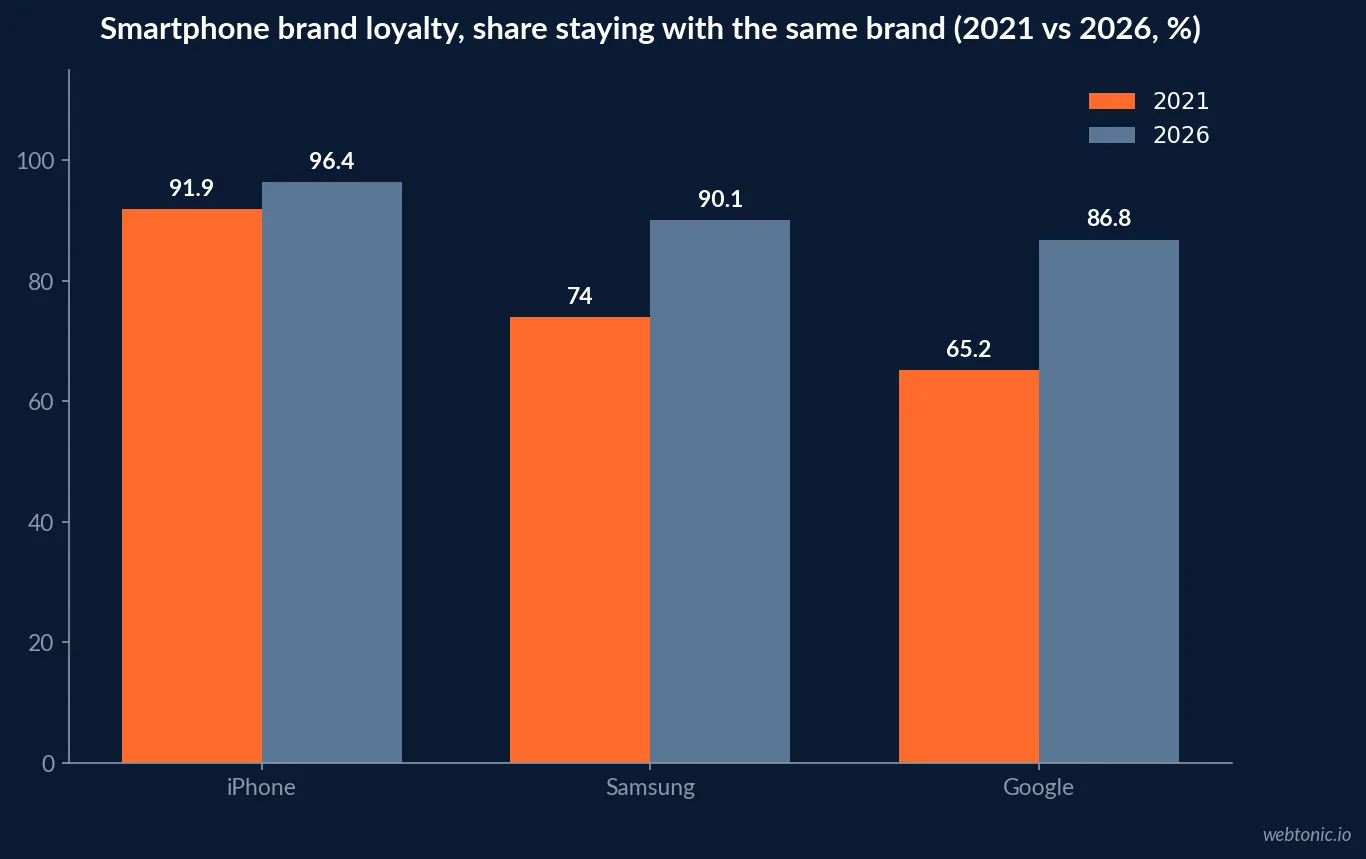
- iPhone loyalty reached 96.4% in 2026, up from 91.9% in 2021.
- Android loyalty sits at 86.4%, a 10-point gap behind iPhone.
- Samsung loyalty recovered to 90.1% from 74% in 2021.
- Google device loyalty rebounded to 86.8% from 65.2%.
- Android users are nearly 4x more likely to switch brands.
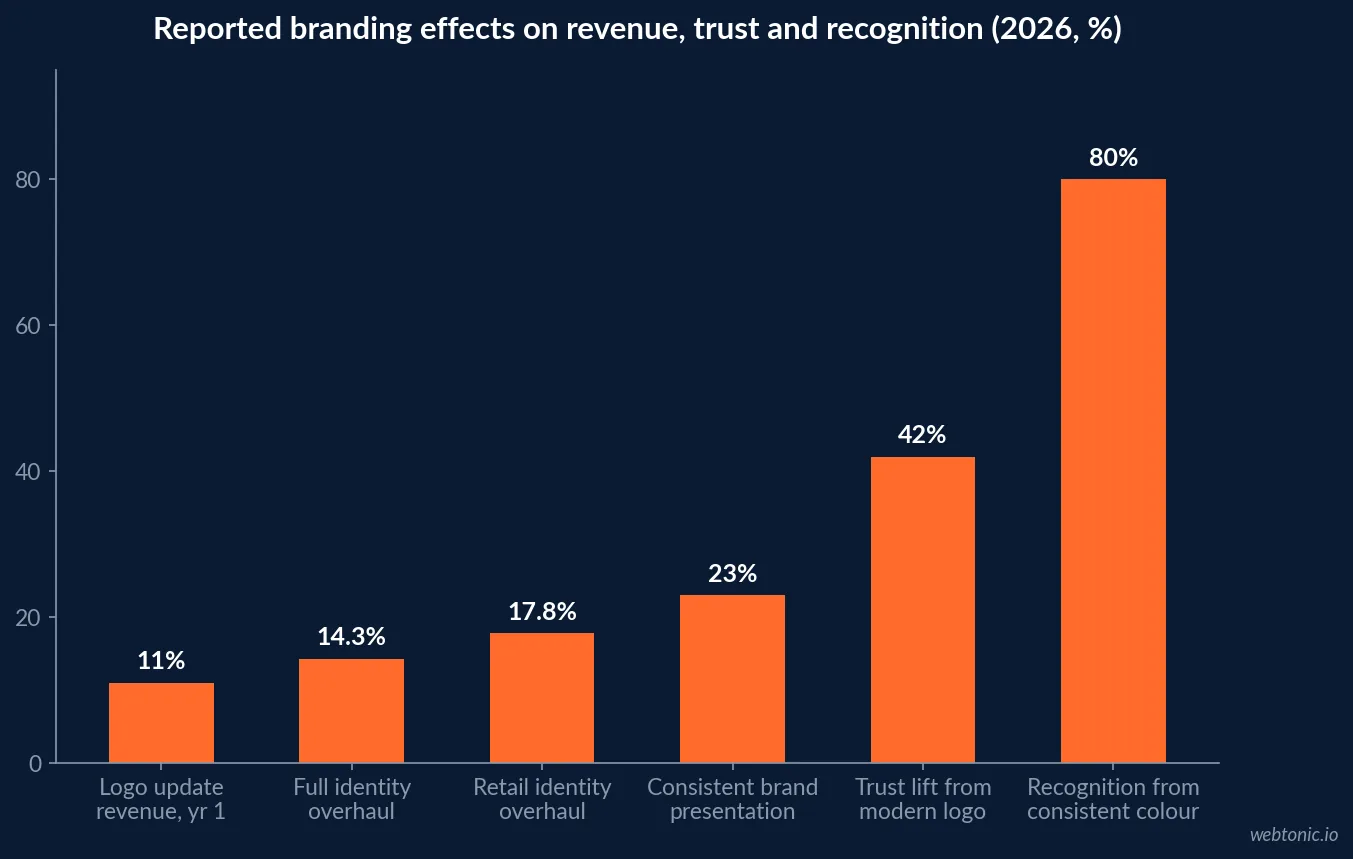
- Consistent brand presentation is linked to a 23% revenue lift.
- Brands consistent across 8+ touchpoints report +27%, ecommerce +31%.
- Inconsistent brands need about 1.75x the media budget for equal growth.
- Consistent colour use raises brand recognition by up to 80%.
- 75% of consumers can identify a brand from its logo alone.
- 48% of consumers define a brand by its visual identity.
- Logo updates are associated with about +11% revenue in year one.
- Full identity overhauls report +14.3%, retail specifically +17.8%.
- 65% of electronics shoppers say a redesign raises purchase intent.
- 53% of brands hit initial backlash after a logo change.
- 91% of consumers expect visual continuity with the previous identity.
- Rebrand volume rose 34% year over year in 2026.
- 81% of customers find repair shops through online search.
- 88% read Google reviews before visiting a local shop.
- 56% of repair customers require a 24-hour turnaround to be satisfied.
- 28% of shop switchers move for speed, not price.
- The average independent repair shop turns over $250,000–300,000 a year.
The Loyalty Ceiling: Why the Device Brand Is Not Your Brand
Start with the constraint. SellCell surveyed more than 5,000 US smartphone users and found iPhone loyalty at 96.4%, Android at 86.4%, Samsung at 90.1% and Google at 86.8% — all at their highest recorded levels. Only 3.6% of iPhone owners say they will switch at their next upgrade, down from 9.5% in 2019.
| Device brand | Loyalty 2019 | Loyalty 2021 | Loyalty 2026 | Switching 2026 |
|---|---|---|---|---|
| iPhone | 90.5% | 91.9% | 96.4% | 3.6% |
| Android (all) | — | — | 86.4% | 13.6% |
| Samsung | 85.7% | 74.0% | 90.1% | 9.9% |
| 84.0% | 65.2% | 86.8% | 13.2% |
Read that as a retail problem rather than a manufacturer story. If nearly every buyer arrives having already decided which ecosystem they are staying in, a phone shop, carrier reseller or repair chain is not competing on the product brand at all. It is competing on its own name, its own promise and its own visual credibility — which is exactly where most independent operators invest least.
What Brand Consistency Is Reported to Be Worth
The branding industry runs on a handful of recycled figures, and it is worth naming them precisely before using them. The core claim is a 23% revenue lift from consistent brand presentation, with 2026 reporting putting multi-touchpoint consistency at +27%, ecommerce at +31%, and inconsistent brands needing roughly 1.75x the media budget for the same growth. Adjacent figures put consistent brands at 3.5x greater market visibility and colour consistency at up to +80% recognition.
| Consistency claim | Reported figure | How to treat it |
|---|---|---|
| Revenue lift from consistent presentation | +23% | Directional; correlational vendor study |
| Consistency across 8+ digital touchpoints | +27% | Use as an upper bound, not a forecast |
| Ecommerce sub-segment | +31% | Closest analogue for online tech retail |
| Media budget penalty for inconsistency | 1.75x spend | The most useful framing for a CFO |
| Recognition lift from consistent colour | Up to +80% | Well replicated across studies |
| Market visibility of consistent brands | 3.5x | Directional |
| Consumers expecting the same experience on every channel | About 90% | Behavioural, defensible |
Our honest read: none of these are causal proofs, and any agency quoting +23% as a projection is overselling. The reliable version is the inverse. Inconsistency demonstrably raises acquisition cost, because every impression that does not look like the last one has to buy recognition again. That is a media-efficiency argument, and it is the one we use when planning growth marketing budgets around identity work.
Logo Redesign Outcomes in the Data
Redesign statistics split cleanly into consumer perception (strong effects) and commercial outcomes (modest effects). Reported figures include 75% logo-only brand recognition, about +11% revenue in the first year after a logo update, +14.3% for full identity overhauls with retail at +17.8%, a 15% awareness lift within six months, and +42% trust perception from a modernised mark.
| Redesign metric | Baseline figure | 2026 update | Relevance to tech retail |
|---|---|---|---|
| Recognition from logo alone | 75% | 78% among mobile-first 18–44s | High — young device buyers |
| Revenue, year one after logo update | +11% | +14.3% for full overhauls | Retail reported at +17.8% |
| Awareness lift within six months | +15% | +19% with campaign support, +9% without | Rollout matters more than the mark |
| Purchase intent after redesign | 57% | 61% overall, 65% electronics | Highest-relevance figure here |
| Trust perception from a modern logo | +42% | +46% average | Matters for repair and trade-in trust |
| Consumers avoiding outdated logos | 60% | 66%, under-35s 2.3x more likely | Ageing shopfront identity is a leak |
| Brands facing initial backlash | 53% | 57% within 72 hours | Budget for the transition, not just the design |
| Consumers expecting visual continuity | 91% | 93% | Evolve the mark; do not detonate it |
The pattern is consistent across sources: evolutionary redesigns outperform total overhauls on audience reception, and rollout support explains more variance than the design itself. A +19% awareness lift with a coordinated launch against +9% for a quiet one is the single most actionable number in this section.
What Consumers Actually Judge
Visual identity is doing more decision-making work than most retailers assume. 48% of consumers define a brand by its visual identity — logo and colours — and 29% have bought something solely because of packaging design. In parallel, 98% of brand owners rate packaging as highly important to brand success and about 99% expect to change theirs within three years.
For accessory-heavy phone retail — cases, chargers, screen protectors, refurbished handsets — packaging is not a CPG luxury. Accessory sales already account for 12–18% of revenue in well-run repair shops, and that is the shelf where design converts directly.
| Consumer signal | Figure | Where it applies in phone retail |
|---|---|---|
| Define a brand by visual identity | 48% | Storefront, van wrap, uniforms, receipts |
| Bought because of packaging alone | 29% | Accessories and refurbished device boxes |
| Brand owners rating packaging as critical | 98% | Own-label accessory ranges |
| Will not buy without trusting the brand first | 81–86% | Refurbished and trade-in categories |
| Prefer clean, minimal identity | 67–71%, Gen Z 79% | Small-screen legibility |
| Retail purchase decisions shaped by colour | 76% | Shelf and app iconography |
The Economics Underneath: What a Brand Point Is Worth
Branding spend has to be sized against the business it sits on. The average independent repair shop turns over $250,000–300,000 a year at 20–35% net margin, roughly $24,000 a month, with the global smartphone repair market at about $22.66 billion in 2026 and heading for $45.5 billion by 2035.
| Business metric | Benchmark | Branding implication |
|---|---|---|
| Annual revenue, single-location shop | $250,000–300,000 | Identity budget must fit a five-figure ceiling |
| Monthly revenue | About $24,000 | A 5% brand-driven lift is roughly $1,200/month |
| Net margin | 20–35% | Design spend competes with parts and wages |
| Gross margin on screen repair | 60–75% | Premium positioning is defensible |
| Accessory share of revenue | 12–18% | Where packaging design pays back fastest |
| Buyback and refurb operations | 25–40% higher revenue | Requires trust signalling to work |
| Repeat business to the same shop | 49% | Retention is the branding KPI |
At $24,000 of monthly revenue, a credible brand refresh has to move something measurable within two quarters or it is a vanity spend. The measurable things are conversion on the Google Business Profile, accessory attach rate, and repeat visits — not unaided awareness.
Speed Beats Slogans: The Uncomfortable Finding
The strongest 2026 evidence in this category is that the category’s marketing is aimed at the wrong lever. 56% of customers are only satisfied if the repair is finished inside 24 hours, and 28% of customers who switch shops do so specifically because the new shop was faster — not cheaper — while 78% read Google reviews before walking in. Independent shops already price about 30–50% below authorised service centres, so discounting is not a position, it is the baseline.
That reframes the brand brief. The promise worth owning is turnaround time, communication and transparency — and then every visual and verbal asset should carry it. A brand that says “lowest prices in town” is competing in the one dimension where every competitor is identical.
Search and Reviews Are Part of the Identity
For a local tech retailer, brand experience begins in the local pack, not on the fascia. 81% of customers find repair shops through online search, 88% read Google reviews before visiting, 64% check the Google Business Profile first, and Google holds 73–81% of all online reviews. Reviews account for roughly 20% of local ranking factors, and shops replying to every review see about 35% higher engagement.
| Discovery channel | Share of customers | Brand asset that carries the load |
|---|---|---|
| Online search and local pack | 81% | Profile photos, category, name consistency |
| Google reviews read pre-visit | 88% | Reply tone of voice |
| Google Business Profile checked first | 64% | Cover imagery and service list |
| Walk-in and high-street footfall | 25–35% | Signage, window graphics, uniforms |
| Word-of-mouth referral | 20–30% | Memorable name and recall device |
| Online booking | 15–20% more enquiries converted | Booking UI consistency |
Rebrand Volume, Cost and Timing
Rebrand volume rose 34% year over year in 2026 — the highest on record for that tracker — with evolutionary rebrands earning about 40% more community saves than total overhauls, and 41% of briefs now mentioning sustainability. Spend benchmarks put Fortune 500 branding design at 10–15% of marketing budget, CPG packaging and branding at about 7% of revenue, and AI-generated concepts appearing in 22% of agency projects.
The timing argument for phone retail is device-cycle shaped. Trade-in and upgrade traffic spikes around flagship launches, so a refresh that lands two months before a major launch window buys attention that the same money cannot buy in February.
Where to Spend First: A Practical Order
- Fix the operational promise before the mark. A 24-hour turnaround claim you can keep is worth more than any wordmark.
- Standardise the five assets customers actually see — Google Business Profile, storefront, receipt or repair ticket, uniform and van. Consistency across touchpoints is where the +27% figure comes from.
- Evolve, do not detonate. 91–93% of consumers expect continuity, and 53–57% of redesigns face early backlash.
- Design for 40 pixels. Preference for clean identity runs 67–71%, rising to 79% among Gen Z, on legibility grounds.
- Support the launch. +19% awareness with campaign support against +9% without is the cheapest multiplier available.
- Brand the accessory shelf. Accessories are 12–18% of revenue and 29% of consumers have bought on packaging alone.
- Measure retention, not recall. Only 49% of repair customers return; that is the number a brand should move.
If you want the identity work tied to measurable channel performance rather than a mood board, that is how our performance creative team scopes it, and you can who we are and talk to us about what a phone retail refresh should cost.
Frequently Asked Questions
How loyal are smartphone buyers to their device brand in 2026?
Extremely. A SellCell survey of more than 5,000 US smartphone users puts iPhone loyalty at 96.4%, up from 91.9% in 2021, with Android at 86.4%, Samsung at 90.1% and Google at 86.8%. Android users are close to four times more likely to switch than iPhone users (13.6% versus 3.6%). For a retailer or repair shop, that means the device brand is a fixed constraint, not a differentiator.
Does brand consistency actually increase revenue for a retailer?
The most-cited figure is a 23% revenue lift from consistent brand presentation, with 2026 reporting putting brands consistent across eight or more digital touchpoints at +27% and ecommerce specifically at +31%. Treat these as directional: they are correlational vendor studies, not controlled experiments. The defensible read is that inconsistency is expensive — inconsistent brands are reported to need about 1.75x the media budget for the same growth.
What does a logo redesign do to sales in tech retail?
Reported outcomes cluster around +11% revenue in year one for a logo update and +14.3% for a full identity overhaul, with retail at +17.8%. Consumer-side figures are stronger than commercial ones: 72% read a redesign as innovation, 57% say it raises purchase intent, and 61% in 2026 reporting — electronics specifically at 65%. Roughly 53% of brands also face initial backlash.
How much of a phone retail brand is really its Google reviews?
More than its logo. 81% of customers find repair shops through online search, 88% read Google reviews before visiting, 64% check the Google Business Profile first, and Google holds 73–81% of all online reviews. Shops that reply to every review see about 35% higher engagement. Visual identity earns the click; the review corpus earns the visit.
Should an independent phone shop invest in branding or in speed?
Speed first, on the evidence. 56% of customers are only satisfied when a repair is finished within 24 hours, and 28% of customers who switch shops do so because the new shop was faster — not cheaper. Branding then makes that speed legible and repeatable. Only 49% of customers return to the same shop, so identity and reputation are the retention layer over an operational promise.
Sources
SellCell Smartphone Loyalty Survey 2026
MacRumors iPhone loyalty coverage
Amra & Elma brand consistency ROI statistics
Amra & Elma logo redesign impact statistics
ZipDo branding industry statistics
Gitnux branding design industry statistics
Cellbot phone repair industry statistics 2026
FixyFlow phone repair industry stats 2026
State of Brand Design 2026
L.E.K. 2026 packaging study
Bynder rebranding statistics 2026