



Table of contents

Key Takeaways
- Global mobile advertising spend will exceed $430 billion in 2026, representing 74% of all digital advertising investment worldwide (eMarketer / Digital Applied).
- Consumer electronics companies will increase digital ad spend by 9.6% to $26.32 billion in 2026, pulling back from 16.4% growth originally forecasted due to tariff-driven margin pressure (eMarketer).
- UGC-style ad creatives outperform polished production on hook rate by 31% and CTR by 33% across Meta, TikTok, and YouTube, reshaping how tech retailers approach creative strategy (Benly.ai, 2026).
- Retail media ROAS averages 6.1x across platforms for the fifth consecutive quarter, with Amazon Sponsored Products delivering the strongest returns for consumer electronics categories (Skai).
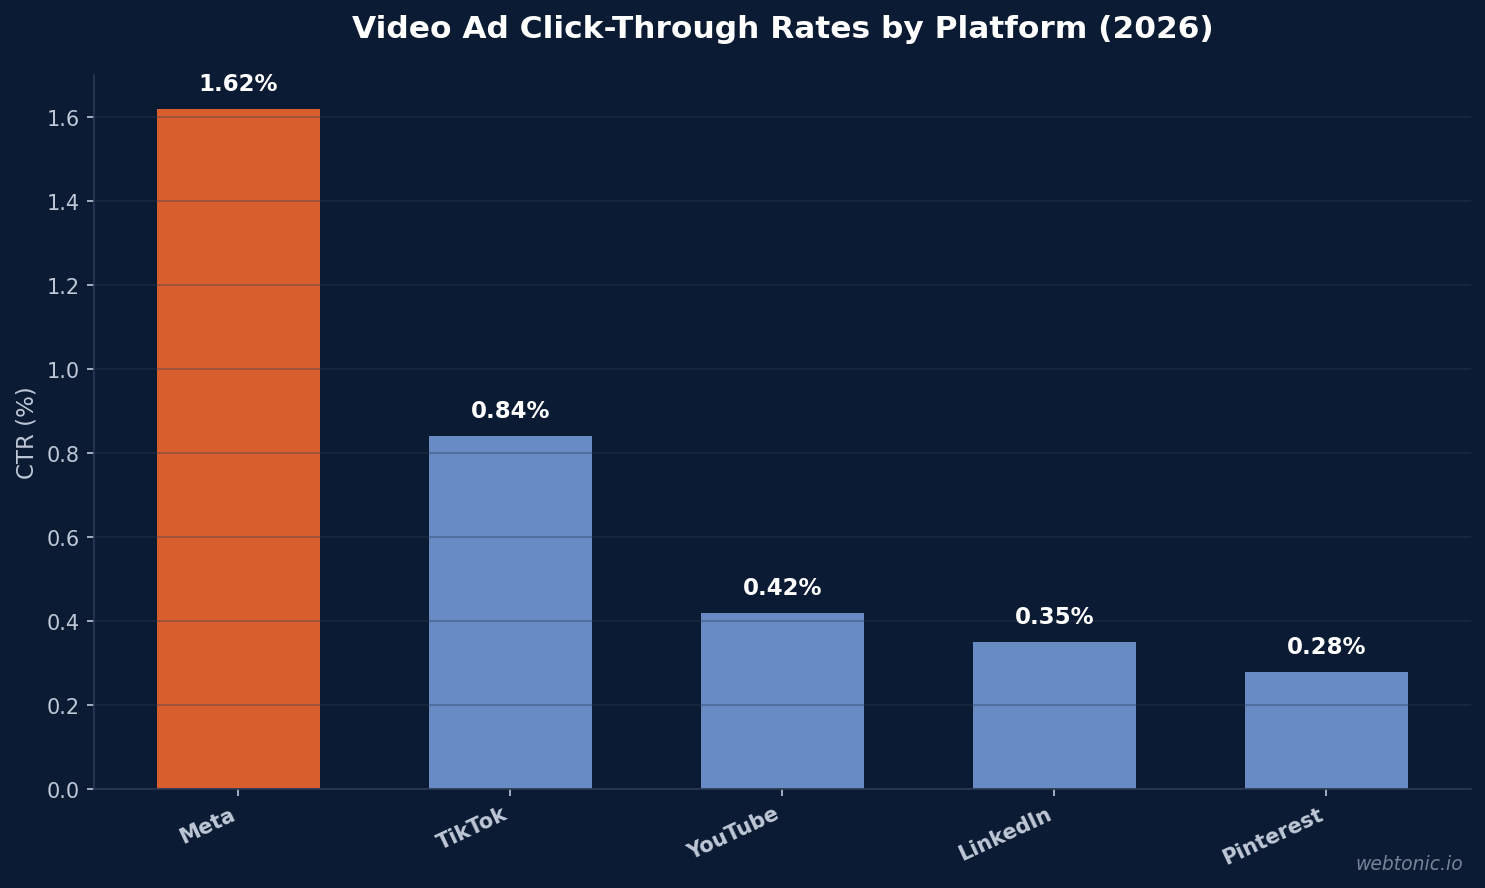
- Video ad CTR on Meta leads all platforms at 1.62%, while TikTok delivers the highest hook rate at 33% median (Benly.ai, 2026).
- Electronics marketers allocate 70-75% of digital budgets to commerce media because retail platforms capture high-consideration buyers comparing specifications (Skai, 2026).
Phone and tech retail advertising is defined by creative performance in 2026, not just spend volume. With $430 billion flowing into mobile channels and consumer electronics brands sharpening their approach under margin pressure, the creative quality gap between winning and wasting ad dollars has never been wider. These statistics cover the platform benchmarks, format comparisons, and engagement data that performance creative teams need to optimize campaigns.
Phone and Tech Retail Ad Creative at a Glance
| Metric | Value | Source |
|---|---|---|
| Global mobile ad spend (2026) | $430B | eMarketer / Digital Applied |
| Mobile share of digital ad spend | 74% | eMarketer, 2026 |
| US mobile ad spend | $218B | eMarketer, 2026 |
| Consumer electronics digital ad spend (US) | $26.32B | eMarketer, 2026 |
| CE digital ad spend growth YoY | +9.6% | eMarketer, 2026 |
| Retail media avg. ROAS | 6.1x | Skai Q1 2025 |
| Meta video ad CTR | 1.62% | Benly.ai, 2026 |
| TikTok median hook rate | 33% | Benly.ai, 2026 |
Platform Creative Performance Benchmarks
Creative performance varies dramatically across platforms. The chart below shows video ad click-through rates based on Benly.ai's analysis of 12,000+ ads. For tech retail campaigns, these benchmarks help Meta Ads and cross-platform teams set realistic performance targets.
Hook Rate and Completion Rate Benchmarks
Hook rate — the percentage of viewers who watch past the first 3 seconds — is now the primary creative quality metric. For phone and tech retail, where product demonstrations and unboxing sequences drive purchase intent, strong opening hooks are essential.
| Platform | Median Hook Rate | Top 25% | Top 10% | Completion Rate |
|---|---|---|---|---|
| Meta (Facebook/Instagram) | 28% | 38% | 45% | 18% |
| TikTok | 33% | 45% | 55% | 24% |
| YouTube | 22% | 30% | 38% | 32% |
| 18% | 25% | 32% | 28% | |
| 15% | 22% | 28% | 35% |
UGC vs. Polished Creative Performance in Tech Retail
UGC-style creatives outperform polished production on hook rate by 31% and CTR by 33% across platforms (Benly.ai, 2026). Polished creatives retain an advantage for brand recall and high-ticket electronics purchases, but the first-impression metric (hook rate) favors authenticity over production value.
For smartphone and electronics retailers, only 12% of all ads score above 70 out of 100 on creative scoring metrics, meaning most campaigns have significant room for improvement. Testing UGC-style unboxing clips against studio product shots is the fastest path to identifying what resonates with your audience segment.
Ad Format Performance: Static vs. Video vs. Carousel
AdSpyder's 2026 analysis found that on live Meta feeds, carousel ads had the highest 30-day survival rate at 39.9%, followed by video at 26.2% and image at 23.3%. Historical Meta data still favors video (14.9% survival vs. 8.0% for image-only), but the carousel's durability signal suggests it deserves more testing budget in tech retail campaigns.
| Format | Meta Historical Survival | Meta Live Survival | LinkedIn Survival | Best Use Case |
|---|---|---|---|---|
| Video | 14.9% | 26.2% | 39.8% | Demos, unboxing, testimonials |
| Image (Static) | 8.0% | 23.3% | 91.1% | Product shots, offers, B2B |
| Carousel | N/A | 39.9% | N/A | Multi-feature showcase, comparisons |
| Text-Only | N/A | N/A | 27.1% | Thought leadership, announcements |
Mobile Advertising Spend Trajectory
The chart below shows global mobile ad spend from 2021 to 2026. For phone and tech retailers, this growth reflects both expanding consumer adoption and the shift of advertising budgets from desktop to mobile-first campaigns.
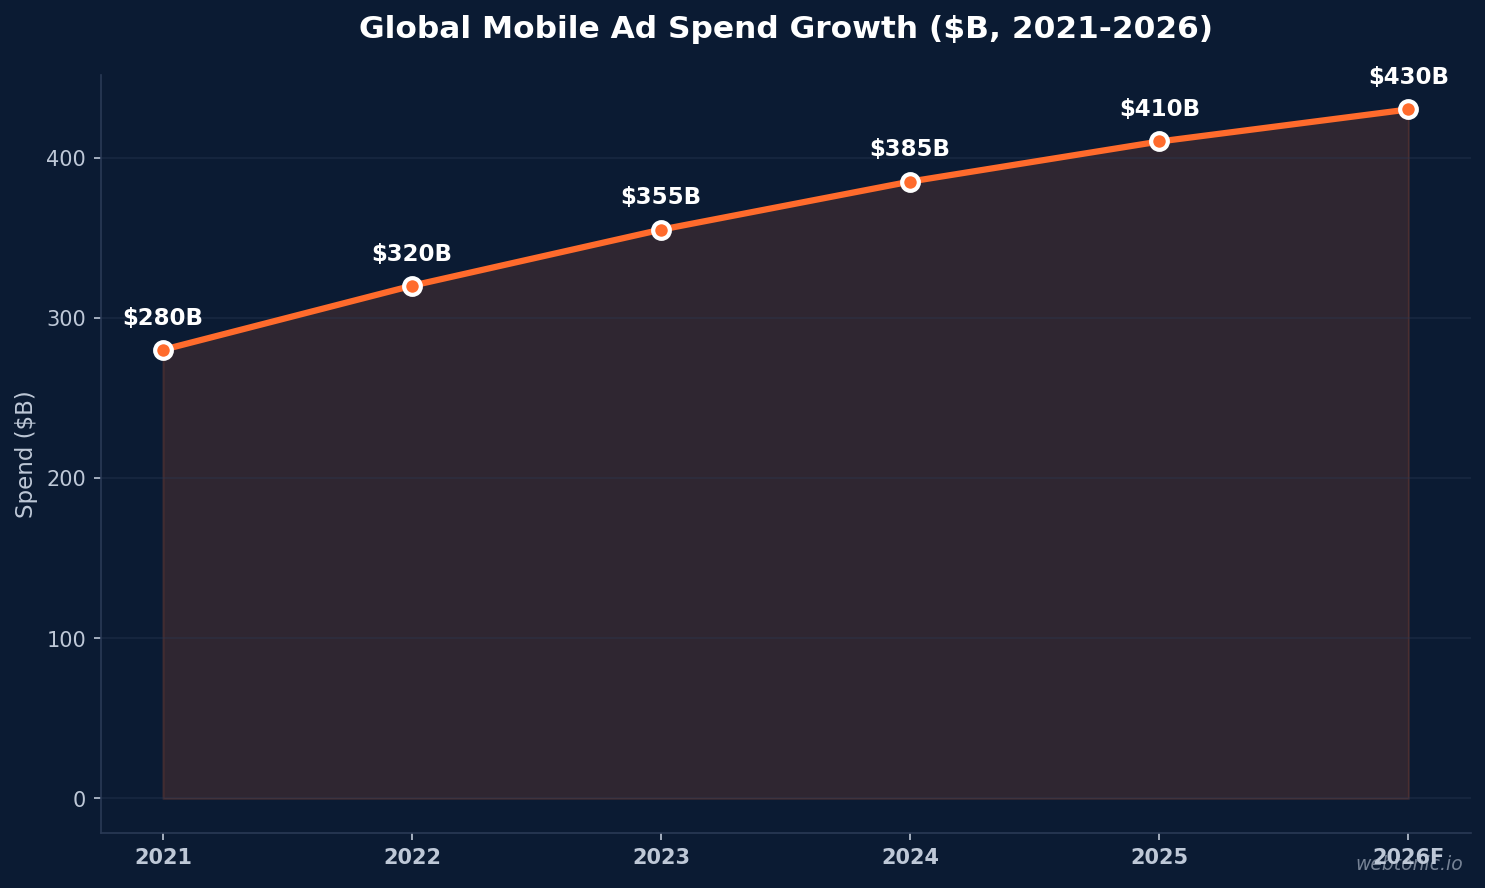
The US accounts for $218 billion in mobile ad spend, representing 54% of global mobile investment (eMarketer). The top three destinations — Google, Meta, and TikTok — capture 67% of all mobile ad dollars, creating a concentrated marketplace where creative quality determines whether your budget generates returns.
Retail Media Creative Performance for Electronics
Electronics marketers allocate 70-75% of digital budgets to commerce media (Skai, 2026). On Amazon, Sponsored Brand conversion rates increased 26.5% year-over-year in Q2 2026, while Sponsored Products average daily spend grew 21.2% (Pacvue, 2026).
Walmart Connect saw Sponsored Brand CTR increase 75% YoY while CPC decreased 15.6% — a rare combination of rising visibility at lower costs. This signals an under-exploited channel that savvy advertisers should prioritize before competition intensifies.
| Retail Platform | Key Metric | 2026 Benchmark | YoY Change |
|---|---|---|---|
| Amazon SP | Average ROAS | $10.19 (strongest) | Category-dependent |
| Amazon SB | Conversion Rate | Up significantly | +26.5% YoY |
| Walmart SP | CTR | Improved | +23.4% YoY |
| Walmart SB | CTR | Sharply higher | +75% YoY |
| Instacart Display | ROAS | Growing | +22.1% YoY |
| Cross-Platform | ROAS | 6.1x | Stable 5 quarters |
AI and Automation in Tech Retail Ad Creative
55% of US adults say AI-powered features are a deciding factor when purchasing consumer electronics (eMarketer), and this consumer interest extends to how brands produce and deliver their advertising creative. AI-generated ad variations allow tech retailers to test 10-20x more creative concepts within the same budget, rapidly identifying winning combinations of headline, visual, and call-to-action that manual production processes cannot match at scale.
The 2026 challenge for electronics marketers is creative velocity. When tariffs spike prices or component shortages hit, budgets need to shift from demand creation to inventory optimization within days, not quarters (Skai, 2026). AI-powered creative tools enable this agility by generating product-specific ad variations that can be deployed across Meta, Google, and retail media networks simultaneously, maintaining consistent messaging while adapting format and copy to each platform's specifications.
Retail media platforms are accelerating this trend. Amazon DSP Display new-to-brand sales grew 26.6% year-over-year in Q2 2026 (Pacvue), driven largely by enhanced creative formats including video in search results and interactive product demonstrations. Tech retailers who invest in platform-native creative — rather than repurposing generic display assets — consistently outperform competitors on both CTR and ROAS metrics.
Native and Emerging Ad Formats for Tech Retail
Native advertising is gaining traction in retail media, with native ad CTR exceeding 0.4% compared to standard display formats (eMarketer, 2026). In-store digital native placements — such as Caper Cart ads and in-aisle displays — deliver even stronger results: over 3% engagement and 2% add-to-cart rates (Osmos / RMIQ, 2026).
For phone and tech retailers, the most promising emerging format is CTV (Connected TV) retail media. TripleLift's retail media business grew 110% year-over-year in 2025, with CTV inventory more than doubling (TripleLift, December 2025). This creates a new creative surface for electronics brands to showcase product demonstrations, comparison content, and seasonal promotions on the largest screen in the household — the TV — with retail-quality attribution linking exposure to purchase.
Purchase intent lifts 18% for native ads compared to standard display (eMarketer, 2026), and when combined with closed-loop attribution, retailers can measure incremental sales lift rather than relying on last-click models that undervalue awareness-stage creative. The practical implication for tech retail advertisers: allocate a test budget to native formats on retail media networks, measure iROAS against standard Sponsored Products campaigns, and scale the winner.
Retail Advertising Benchmarks for Phone and Electronics
According to CuFinder's 2026 retail benchmarks, mobile devices generate 78.4% of all retail traffic, with mobile bounce rates averaging 51.2%. Google Ads conversion rates for retail average 3.8%, while Facebook Ads CTR sits at 1.45% with a CPM of $14.50.
For electronics specifically, total media ad spending grew 22.2% in H1 2025 before slowing to 3.2% in H2 as tariff uncertainty hit margins (eMarketer / MediaRadar). This front-loading pattern is expected to repeat in 2026, making Q1-Q2 the critical creative testing window for electronics advertisers.
Creative Best Practices for Phone and Tech Retail Advertisers
- Lead with a 3-second hook. Top 10% ads achieve 45% hook rates on Meta and 55% on TikTok. For phone retail, open with the product in-hand, a price reveal, or a feature demonstration.
- Test UGC against polished production. UGC outperforms on hook rate (+31%) and CTR (+33%). Run A/B tests with unboxing clips versus studio product shots for each campaign objective.
- Prioritize carousel on Meta. With a 39.9% survival rate on live Meta feeds, carousel ads deserve more budget for multi-feature product showcases and specification comparisons.
- Front-load creative budgets. Electronics ad spend shows 22.2% growth in H1 versus 3.2% in H2. Align your creative testing calendar to capitalize on Q1-Q2 momentum.
- Invest 70%+ in commerce media. Retail platforms capture high-intent buyers. Amazon SB conversion rates rose 26.5% YoY — invest in enhanced product content and Sponsored Brand creative.
- Benchmark against platform medians. Only 12% of ads score above 70/100 on creative quality. Use these benchmarks to identify gaps and allocate testing budget to close them.
Related reading
- Home Renovation Retail Ad Creatives: Effectiveness and Benchmark Data
- What B2B SaaS ad creatives actually work?
- Video Marketing for Phone & Tech Retail: 38+ Statistics & Benchmarks (2026)
- Branding services at Web Tonic
FAQ
What is the average CTR for phone and tech retail ads in 2026?
Video ad CTR on Meta leads all platforms at 1.62%, followed by TikTok at 0.84% and YouTube at 0.42%. Google Ads conversion rates for retail average 3.8% and Facebook Ads CTR averages 1.45%. Benchmarks vary by product category and creative format.
How much do consumer electronics companies spend on digital ads?
US consumer electronics companies will spend $26.32 billion on digital advertising in 2026, growing 9.6% year-over-year. Global mobile ad spend across all industries will exceed $430 billion, with mobile representing 74% of all digital advertising investment.
Do UGC ads outperform polished production for tech retail?
On hook rate and click-through rate, yes. UGC-style ads outperform polished production by 31% on hook rate and 33% on CTR across Meta, TikTok, and YouTube. Polished ads retain advantages for brand recall and high-ticket products. Testing both formats is recommended.
What is the best ad format for phone retail on Meta?
Carousel ads had the highest 30-day survival rate on live Meta at 39.9%, outperforming video at 26.2% and static image at 23.3%. Carousel is ideal for multi-feature comparisons, while video excels for unboxing and demonstration content.
What ROAS should tech retailers expect from retail media?
The cross-platform retail media ROAS average is 6.1x, maintained for five consecutive quarters. Amazon Sponsored Products deliver the strongest returns for consumer electronics. Walmart Connect Sponsored Brand CTR grew 75% YoY with CPC decreasing 15.6%.
Sources
Benly.ai — Ad Creative Benchmarks 2026
Searchlab — Mobile Marketing Statistics 2026
Digital Applied — Mobile Marketing Statistics 2026
eMarketer — Consumer Electronics Ad Spend
Skai — Consumer Electronics Guide 2026
Pacvue — Q2 2026 Commerce Media Benchmarks
AdSpyder — Static vs Video Ads 2026
CuFinder — Retail Marketing Benchmarks 2026
Osmos — Retail Media ROAS Benchmarks 2026


