Table of contents
Electronics earns the highest click-through rate of any ecommerce category on TikTok and the highest cost per purchase. Both numbers come from the same 2026 dataset, and reconciling them is the whole job for a phone or tech retailer buying this platform.
Key Takeaways
- Electronics median CTR on TikTok is 0.73% — the highest of ten ecommerce verticals.
- Electronics median CPA is $31.25 — also the highest of the ten.
- Electronics median CPM is $5.17, mid-pack in the category set.
- Electronics median CVR is 1.85%, second lowest measured.
- Electronics median ROAS is 1.68 against 2.49 for apparel.
- Platform ecommerce medians: CPA $32.74, CPM $13.26, ROAS 2.21.
- CPM rose 16% year over year while CVR fell 6.2%.
- Median CPC across objectives is $0.62 (IQR $0.38–$1.04).
- Reach CPM is roughly 40% cheaper than equivalent Meta inventory.
- Conversion CPM is roughly 35% cheaper than Meta.
- Spark Ads CTR is 1.92x standard in-feed (1.62% vs 0.84%).
- Spark Ads CPA runs about 28% lower.
- TikTok Shop crossed $50 billion in annualised GMV in Q2 2026.
- Electronics accessories crossed $1 billion in quarterly Shop GMV.
- Accessory AOVs reported at $28–$44 for grips, cases and organisers.
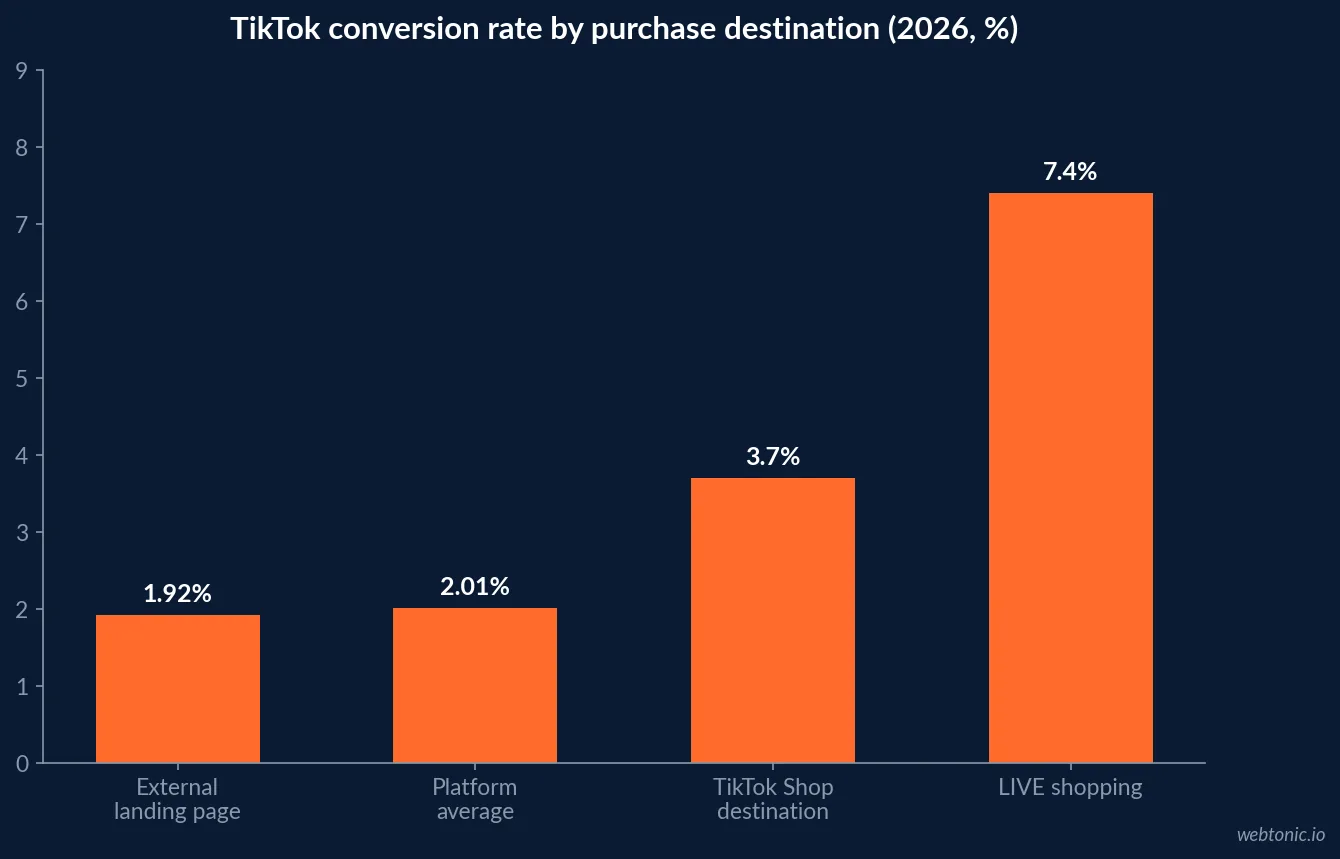
- TikTok Shop destination lifts CVR from 1.92% to 3.7%.
- LIVE shopping converts at 7.4–7.8%, roughly 3x the platform average.
- Affiliate content drives about 42% of TikTok Shop GMV.
- TikTok reached 1.9–2.0 billion monthly active users by Q1 2026.
- 67% of Gen Z use TikTok as a search engine.
- US time in app is about 57 minutes a day.
Electronics against the other nine verticals
The cleanest vertical split available for 2026 comes from Triple Whale's full-year first-party ecommerce data, compiled by Influee. Electronics sits at both extremes.
| Vertical | Median CTR | Median CPM | Median CPA | Median CVR | Median ROAS |
|---|---|---|---|---|---|
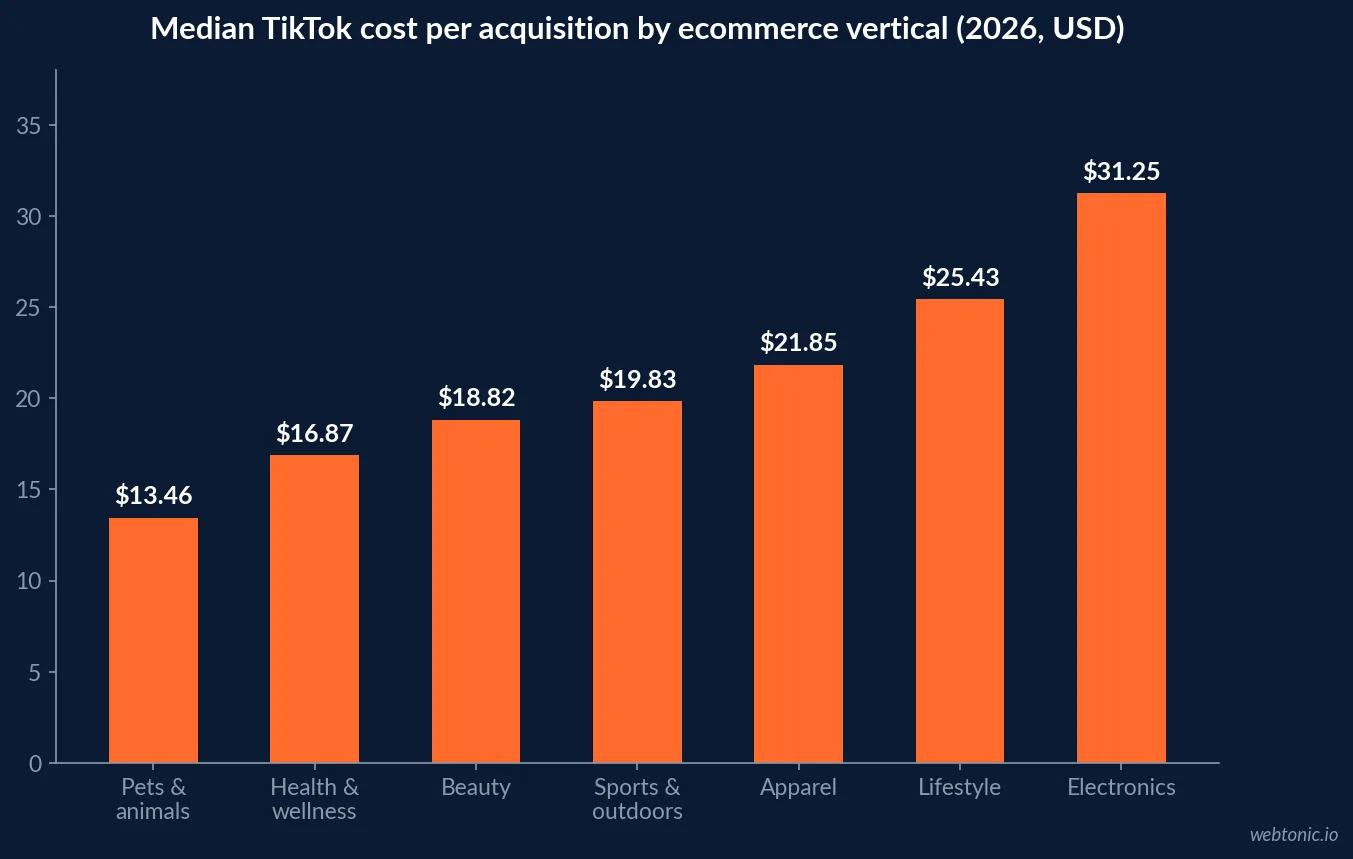
| Electronics | 0.73% | $5.17 | $31.25 | 1.85% | 1.68 |
| Apparel & accessories | 0.69% | $4.24 | $21.85 | 2.37% | 2.49 |
| Home & garden | 0.68% | $5.69 | $21.36 | 2.42% | 1.97 |
| Beauty | 0.58% | $5.28 | $18.82 | 2.19% | 0.74 |
| Food & beverage | 0.58% | $6.33 | $19.84 | 2.17% | 0.49 |
| Sports & outdoors | 0.52% | $3.79 | $19.83 | 1.49% | 1.39 |
| Platform median (ecommerce) | 1.77% | $13.26 | $32.74 | 2.01% | 2.21 |
Read the last row carefully: the platform figure is an all-click CTR while the vertical rows are link CTRs, which is why they cannot be compared directly. Judge a device account against 0.73%, not 1.77%. The direction of travel across 2025 was CPM up 16%, CTR up 13.74%, CVR down 6.2% and ROAS down 5.7% — more expensive reach, more clicks, fewer purchases.
Why the highest CTR produces the worst ROAS
A phone is a considered purchase with public pricing. A TikTok video creates the interest; the purchase happens days later on a comparison page, a carrier site or in a store. Three of those paths are invisible to the ad platform, so the recorded ROAS understates the truth while the recorded CPA is real cash. That is why electronics ranks fourth on ROAS at 1.68 but improves relative to peers on blended marketing efficiency ratio, where it sits second at 0.38.
| Symptom | Number | Most likely cause |
|---|---|---|
| High CTR, low CVR | 0.73% CTR vs 1.85% CVR | Spec and price research intent, not buying intent |
| High CPA vs category | $31.25 vs $21.85 apparel | Longer consideration window than the attribution window |
| ROAS below MER implication | 1.68 ROAS, 0.38 MER | Cross-device and offline purchase leakage |
| Q4 cost spike | CPM +40–80% over baseline | Launch and holiday auction pressure |
| CPA balloons with CPC | $28.21 at $0.74 CPC → $218.18 at $1.92 | Audience or creative mismatch, not platform pricing |
The practical response is to stop grading TikTok on last-click purchase ROAS for handsets. Measure blended efficiency and new-customer share instead: one 2026 analysis put TikTok's CPA-to-net-new-customer delta at just 10% versus 38% for Meta, meaning a far larger share of TikTok purchases are genuinely incremental. Our data intelligence work exists mostly to settle arguments like this one.
Cost by objective, and where the arbitrage still exists
AdLiftr analysed 3,127 campaigns from 548 advertisers spending $18.7 million over four months in 2026.
| Objective | Median CPM | Versus Meta | Fit for phone & tech retail |
|---|---|---|---|
| Reach | $4.10 | ~40% cheaper | Launch-week awareness, trade-in offers |
| Traffic | $6.80 | Cheaper | Spec pages, comparison content, store locator |
| App installs | $12.40 | Comparable | Retailer app, repair booking |
| Conversions | $16.20 | ~35% cheaper | Accessories and mid-range handsets |
| Cheapest cell in dataset | under $2.80 | — | Reach + one Spark Ad under 12s, 18–34 |
Median CPC is $0.62 across objectives, cheaper than Meta's typical $1.10–$2.00 and cheaper than Snapchat at $0.84. Median CTR of 1.18% runs about 38% above equivalent Meta inventory. As AI Advantage Agency notes, budget against $9–$13 CPM for conversion campaigns rather than the platform-wide average, and expect Q4 to run 40–80% hotter.
Spark Ads are not optional for this category
Device content on TikTok is already creator content: unboxings, camera tests, battery drain tests, case durability clips. Running that natively rather than as a brand ad is the single largest measured lever in the dataset.
| Format | Typical CTR | Note |
|---|---|---|
| In-feed standard | 0.84%–1.0% | The default, and the weakest option |
| Spark Ads | 1.62%–2.4% | 1.92x in-feed CTR; CPA ~28% lower |
| Branded effects | ~8% | Engagement metric, not a purchase metric |
| TopView | 12%–16% | $50k–$150k/day flat buys; launch moments only |
According to Hawky, a good TikTok CTR is 1.0% or better, above 1.5% is excellent, and below 0.5% means the creative or audience is wrong — but that scale applies to in-feed. A 1.1% CTR on a TopView buy would be a failure. RedClaw, reporting on more than $40 million of managed ecommerce spend, adds that creator content outperforms brand-produced content by 2–4x and that Smart+ catalog campaigns delivered about 30% higher ROAS than manual targeting.
TikTok Shop: accessories, not flagships
The commerce layer is where the category converts. Ecommerce Times reports TikTok Shop crossed $50 billion in annualised GMV at the end of Q2 2026, making it the third-largest US marketplace by GMV behind Amazon and Walmart, with electronics accessories crossing $1 billion in the quarter. US GMV passed $9 billion through May 2026, on pace for more than $21 billion for the year.
| Metric | Value | Implication for a device retailer |
|---|---|---|
| Annualised Shop GMV | $50B (Q2 2026) | Marketplace-scale demand, not an experiment |
| Electronics accessories GMV | $1B+ per quarter | Cases, grips, chargers, cables, audio |
| Accessory AOV band | $28–$44 | Matches TikTok's impulse price ceiling |
| Electronics share of Shop GMV | ~14% | Fourth behind beauty, fashion, home |
| CVR on Shop vs external site | 3.7% vs 1.92% | Keep the transaction in-app |
| Shop vs external CPA | ~25% lower | Fewer steps, native checkout |
| LIVE shopping CVR | 7.4–7.8% | ~3x platform average; best for bundles |
| Affiliate share of GMV | ~42% | Creator commissions of 5–20% by category |
The strategic read is unglamorous: TikTok is an accessory and mid-range channel for phone retail, and a demand-creation channel for flagships. A $1,200 handset does not close in-app at a $28–$44 impulse ceiling — but the case, the charger, the earbuds and the screen protector all do, and those carry the margin anyway. Note the trade-off Ecommerce Times flags: return rates run about 23% higher than traditional ecommerce.
Audience: big, young, and already researching devices
Axis Intelligence puts TikTok at roughly 1.9–2.0 billion monthly active users as of Q1 2026 with about $33.1 billion of 2025 revenue, up 40.4%, of which roughly 77% is advertising. Thunderbit puts 18–24 at 36% of the global audience, 25–34 at 34%, and about 70% of users under 35, with 76% of US 18–24s on the platform.
| Behaviour signal | Value | Why it matters for devices |
|---|---|---|
| Gen Z using TikTok as search | 67% | Spec and review queries never reach Google |
| Purchased after seeing a product | 36–37% | Direct response is real at accessory price points |
| Visited a brand site after an ad | 48% | Traffic objective has genuine downstream value |
| Average engagement rate | 5.53% | 2x Instagram Reels, ~3x YouTube Shorts |
| US daily time in app | ~57 minutes | Second only to YouTube at 61 minutes |
| Brands reporting positive ROI | 51% | Another 45% report break-even |
A budget structure that fits the numbers
- Run a Reach layer at $4.10 median CPM for launch weeks and trade-in windows, judged on reach and view-through, never on ROAS.
- Run a Conversions layer at $16.20 median CPM pointed at accessories and mid-range handsets, where the $28–$44 AOV band actually closes.
- Make every ad a Spark Ad. 1.92x the CTR and 28% lower CPA is the cheapest improvement available.
- Send accessory demand to TikTok Shop, not your site: 3.7% versus 1.92% CVR and about 25% lower CPA.
- Test LIVE for bundles at 7.4–7.8% conversion, then hold the schedule — top accounts take 20–30% of revenue through LIVE.
- Budget CPMs 40–80% higher in Q4 and pull the awareness layer forward into Q3.
- Grade handsets on blended MER and new-customer share, not platform ROAS of 1.68.
- Refresh creative on the CTR curve: falling from 0.73% toward 0.5% is a creative signal, not an auction signal.
For the cross-platform comparison, our benchmarks on Facebook ad costs and Meta ROI give the reference point most teams are actually reallocating from, and our performance creative team builds the Spark-ready assets that make the difference above.
Frequently Asked Questions
What do TikTok ads cost for an electronics retailer in 2026?
Electronics posts a median CPM of $5.17 — mid-pack among ecommerce verticals — against a platform ecommerce median of $13.26 for established brands running conversion campaigns. Median CPC across objectives is $0.62 with an interquartile range of $0.38–$1.04. By objective, median CPM runs $4.10 for Reach, $6.80 for Traffic, $12.40 for App Installs and $16.20 for Conversions.
Why is electronics the best CTR and the worst ROAS on TikTok?
Because the format sells curiosity, not commitment. Electronics leads all ecommerce verticals on TikTok click-through rate at 0.73%, yet posts the highest median CPA at $31.25, a median conversion rate of 1.85% and a median ROAS of 1.68. Buyers click to research specs and price, then leave to compare — which is a measurement problem as much as a performance one.
Does TikTok Shop work for phone accessories?
This is where the category actually earns money. TikTok Shop crossed $50 billion in annualised GMV in Q2 2026, and electronics accessories alone crossed $1 billion in quarterly GMV. Reported average order values for phone grips, cases and cable organisers sit around $28–$44, and brands selling through TikTok Shop rather than an external site report roughly 40% higher conversion rates and 25% lower CPAs.
Are Spark Ads worth the extra creator coordination?
The gap is large enough that skipping them is the most common reason a TikTok account underperforms. In a 2026 dataset of 3,127 campaigns, Spark Ads delivered 1.92x the click-through rate of standard in-feed ads (1.62% vs 0.84%) and a CPA about 28% lower. Creator-made content outperforms brand-produced content by 2–4x for ecommerce on the platform.
How big is TikTok's audience for device buyers?
TikTok reached roughly 1.9–2.0 billion monthly active users by Q1 2026 and generated about $33.1 billion in revenue in 2025, up 40.4%. US users spend around 57 minutes a day in the app, 67% of Gen Z use it as a search engine, and 36–37% of users report buying a product after seeing it on the platform. Roughly 70% of the audience is under 35.
Sources
Influee — TikTok Ads Benchmarks 2026 by Industry
AdLiftr — TikTok Ads Cost Benchmarks 2026
Hawky — TikTok Ads Benchmarks by Industry 2026
AI Advantage Agency — TikTok Ads Cost for Ecommerce
RedClaw — eCommerce TikTok Ads Benchmarks 2026
Ecommerce Times — TikTok Shop Crosses $50B GMV
Ecommerce Times — TikTok Shop Hits $9B US GMV
Dashboardly — TikTok Shop Revenue & GMV Statistics
Axis Intelligence — TikTok Statistics 2026
Thunderbit — 80 TikTok Statistics for 2026
Digital Applied — TikTok Statistics 2026