Table of contents
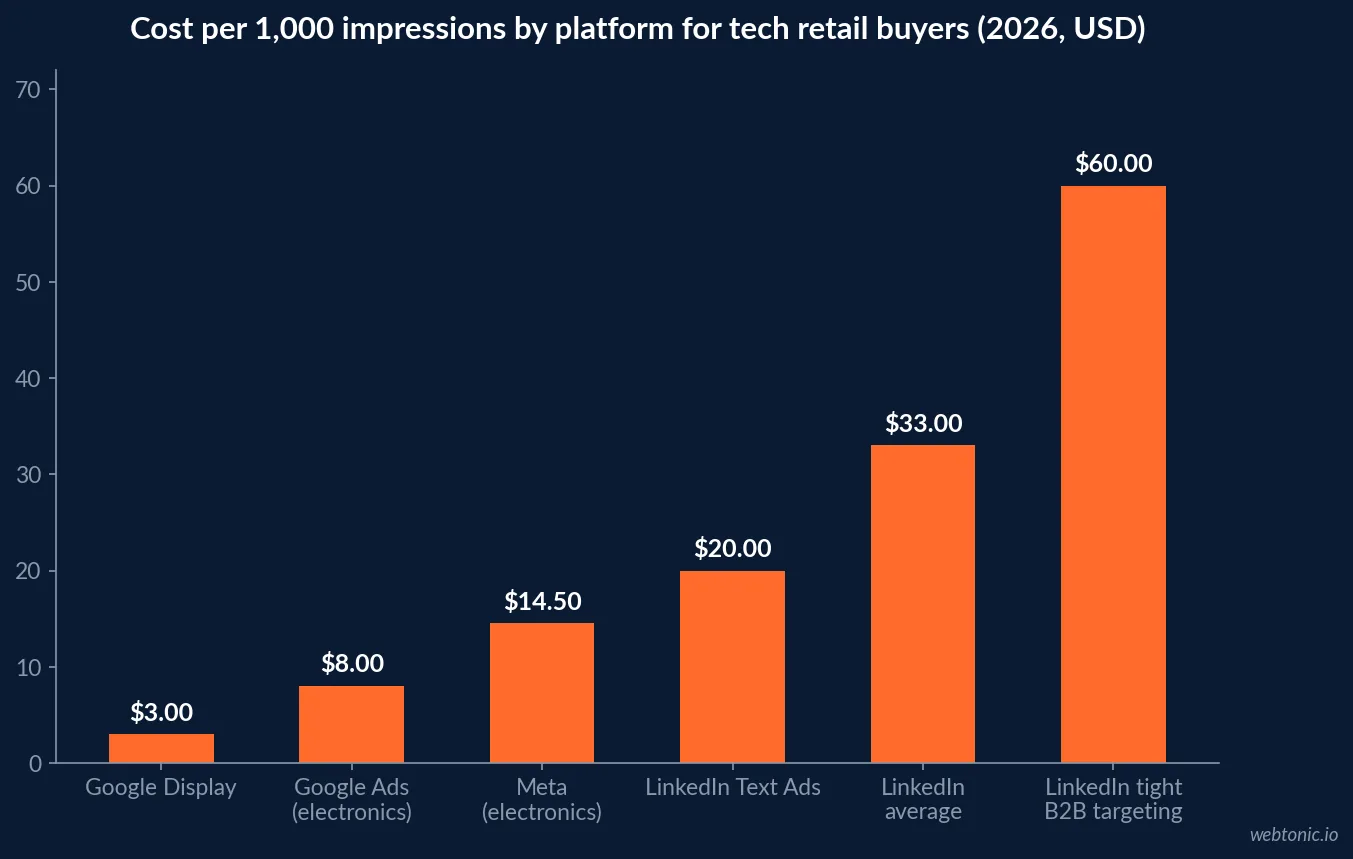
LinkedIn charges about $33 per thousand impressions to reach a verified job title, against $14.50 on Meta for electronics advertisers — and consumer tech retail converts at 2.65% on a $185 average order. That arithmetic decides whether LinkedIn belongs in a phone or tech retail plan at all.
Key Takeaways
- LinkedIn passed 1.3 billion members by January 2026.
- Monthly active users are estimated at about 310 million.
- Platform revenue reached $17.81 billion in FY2025, up 9%.
- Marketing Solutions revenue grew 15% year over year.
- Average LinkedIn CPC is $5.26, US range $6–$12.
- Average CPM is about $33, range $25–$55.
- Average CTR is 0.44–0.65%, median 0.52%.
- Median cost per lead is $110, range $60–$200.
- B2B retail and ecommerce CPCs run $3.00–$6.80 — among the cheapest verticals.
- B2B retail CPL runs $68–$105 versus $148–$200 in financial services.
- Lead Gen Forms convert at 10–18% against 2–6% on landing pages.
- Landing-page leads reach SQL at 40–55% versus 25–40% for forms.
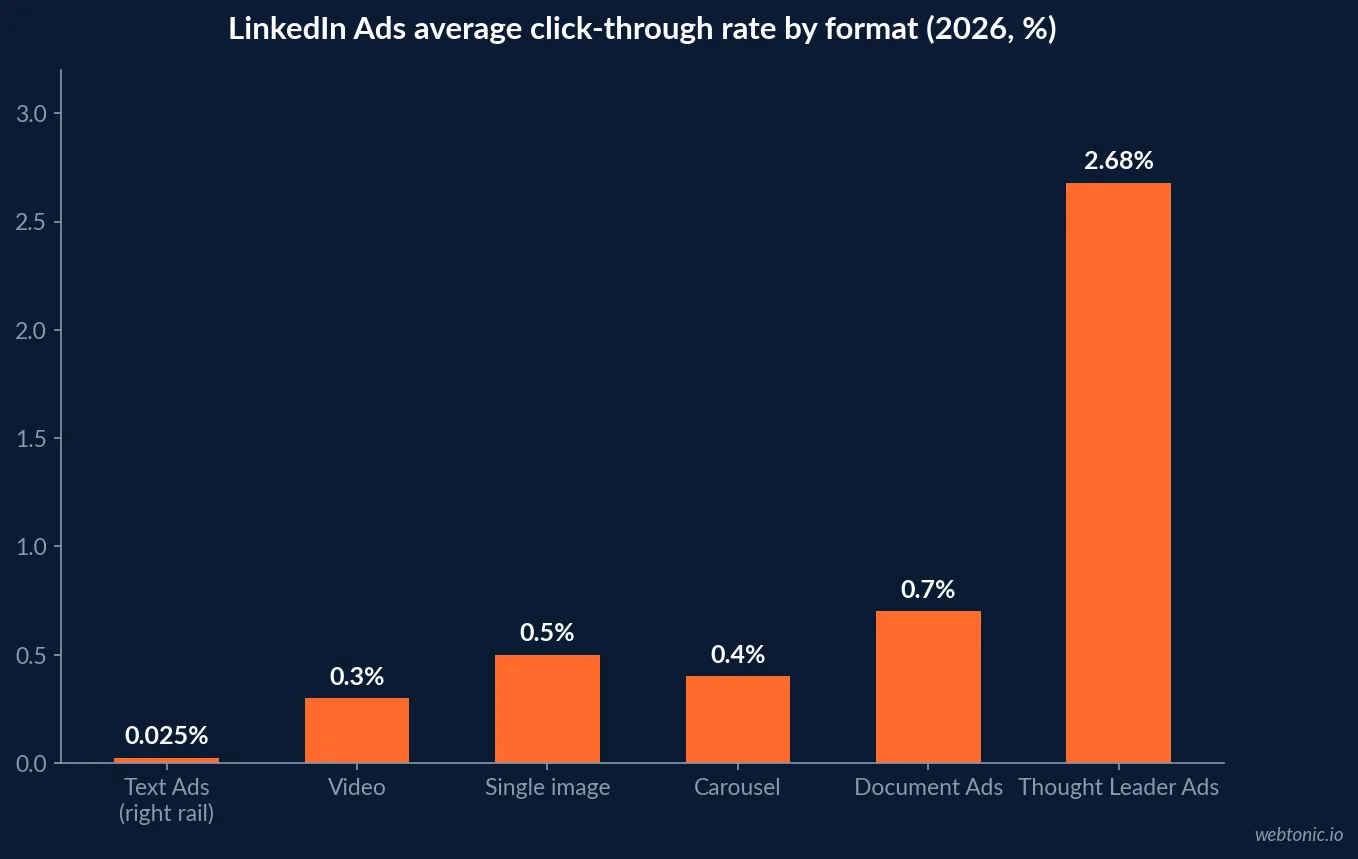
- Thought Leader Ads hit 2.68% CTR at a $2.29 CPC.
- Right-rail Text Ads average 0.025% CTR.
- C-suite targeting costs $10–$24+ per click.
- Excluding companies over 500 employees can cut CPL 60–70%.
- LinkedIn reports 121% B2B ROAS against Google Search 67% and Meta 51%.
- LinkedIn takes 41% of B2B paid social budgets.
- Consumer electronics ecommerce converts at 2.65% on a $185 AOV.
- Facebook and Instagram CPM for electronics is $14.50.
- 53% of US LinkedIn users are in $100,000+ households.
- CPCs swung 50% between Q1 and Q3 in a single year.
LinkedIn Ads Cost Benchmarks for 2026
Start with the platform-wide figures, then narrow. Sponsored Content averages a $5.26 CPC globally and $6–$12 in the US, a $33 CPM, 0.44% CTR, $75–$200 B2B CPA and 8–12% Lead Gen Form conversion. A second dataset puts CPC at $5.26–$8.50 with a median CPL of $110 and CVR of 10–18% on forms against 2–6% on landing pages.
| Metric | Global average | US / typical range | Strong | Weak |
|---|---|---|---|---|
| CPC (Sponsored Content) | $5.26 | $6–$12 | Under $5 | Over $15 |
| CPM (Sponsored Content) | $33 | $35–$55 | Under $28 | Over $60 |
| CTR (Sponsored Content) | 0.44% | 0.40–0.55% | Over 0.80% | Under 0.20% |
| CPA / CPL (lead gen) | $110–$120 | $75–$200 | Under $80 | Over $250 |
| Landing page CVR | 2.35% | 2–4% | Over 4% | Under 1% |
| Lead Gen Form CVR | 8–12% | 9–13% | Over 13% | Under 5% |
| Pipeline-attributed ROAS | 3–5x | 3.5–6x | Over 5x | Under 2x |
Two datasets disagree by roughly 2x on CPC and it is worth understanding why rather than averaging them. An agency dataset drawn from 87 campaigns and over $5 million of managed spend reports $10.11 CPC, $60 CPM, 0.65% CTR and $276 CPL. That is what tightly targeted enterprise ICP buying costs. The $5.26 figure is what the whole platform averages, including broad campaigns nobody would run for a niche audience.
Where Tech and Retail Audiences Sit by Cost
Industry matters less than audience contestation. A dataset covering $47 million of spend across 874 B2B campaigns puts B2B retail and ecommerce at $4.20–$6.80 CPC and $71–$105 CPL, against financial services at $7.80–$15.20 and $148–$200. B2B SaaS and tech — the closest match for device management, MDM and IT reselling — runs $6.20–$11.80 CPC and $103–$160 CPL.
| Audience segment | CPC range | CPL range | CTR range |
|---|---|---|---|
| B2B retail / ecommerce | $4.20–$6.80 | $71–$105 | 0.58–0.85% |
| Education and training | $4.10–$6.20 | $68–$95 | 0.61–0.89% |
| Marketing and advertising | $4.60–$7.40 | $82–$120 | 0.51–0.76% |
| Manufacturing | $4.80–$7.90 | $84–$125 | 0.52–0.78% |
| B2B SaaS / technology | $6.20–$11.80 | $103–$160 | 0.42–0.65% |
| Healthcare and pharma | $6.90–$12.40 | $129–$175 | 0.38–0.58% |
| Financial services | $7.80–$15.20 | $148–$200 | 0.35–0.52% |
| Cybersecurity | $12.00–$18.00 | $130–$180 | 0.48–0.58% |
The seniority premium is steeper than the industry premium. C-suite targeting costs $10–$24+ per click, 2–3x Director level and 6–12x individual-contributor targeting at $2–$4. In the other direction, ultra-specific titles reduced CPC 25–47% versus broad function targeting, and excluding companies over 500 employees cut CPL 60–70% for most B2B products.
The Consumer Retail Reality Check
This is where most phone retail LinkedIn plans die. Consumer electronics ecommerce benchmarks for 2026 show a 2.65% conversion rate, $185 average order value, 74.5% cart abandonment, a $1.15 Google Ads CPC and $14.50 Facebook and Instagram CPM. Against a $110 median LinkedIn CPL, a $185 order simply cannot carry the channel.
| Economics input | Consumer tech retail | LinkedIn requirement |
|---|---|---|
| Average order value | $185 | Guidance suggests $5,000+ contract value |
| Site conversion rate | 2.65% (top 20% at 4.80%) | Landing pages 2–6% |
| Paid click cost | $1.15 Google Ads, $0.88 Shopping | $5.26–$12 CPC |
| Paid impression cost | $14.50 Meta CPM | $33 average CPM |
| Customer retention (12 months) | 24% | Judged on pipeline, not repeat orders |
| Repeat purchase rate | 21.5% | Not the LinkedIn use case |
| Search CPA | $48.50 | $110 median CPL |
The conclusion is not “never use LinkedIn”. It is that LinkedIn is a B2B instrument inside a tech retail business: fleet and bulk device sales, corporate repair and MDM contracts, leasing, refurbished-hardware supply and channel recruitment. For consumer demand, the money belongs in search, shopping and Meta Ads, where the cost structure matches a $185 basket.
Format Benchmarks: Where the CTR Actually Comes From
Format selection moves CTR by an order of magnitude — far more than creative polish. Sponsored Content single image runs $5–$9 CPC and $30–$50 CPM, video $6–$11 and $35–$55, Document Ads $27–$45 CPM, and Message Ads price per send at $0.26–$0.60 with 30–50% open rates.
| Format | Avg CPC | Avg CPM | Avg CTR | Best use in tech retail |
|---|---|---|---|---|
| Sponsored Content — single image | $5–$9 | $30–$50 | 0.40–0.60% | Fleet offer, trade-in programme |
| Sponsored Content — video | $6–$11 | $35–$55 | 0.20–0.40% | Repair SLA explainer |
| Carousel | $4–$8 | $28–$48 | 0.30–0.50% | Device range or case studies |
| Document Ads | $4–$7 | $25–$42 | 0.50–0.90% | Procurement TCO guides |
| Thought Leader Ads | $2.29–$6 | $22–$38 | 0.60–2.68% | Founder credibility, cheapest clicks |
| Text Ads (right rail) | $2–$5 | $15–$25 | 0.025–0.04% | Retargeting only |
| Message / Conversation Ads | $0.26–$0.80 per send | — | 30–50% open rate | Event and demo invites |
Thought Leader Ads are the standout of 2026: 2.68% CTR at $2.29 CPC, roughly 77% cheaper per click than single image ads. Document Ads deliver 20–30% lower CPL than image ads in content-heavy verticals. Both work because LinkedIn discounts CPM for engagement — a campaign at 1% CTR pays less over time than one at 0.3%.
Audience: Who You Are Actually Buying
LinkedIn passed 1.3 billion members by January 2026 with an estimated 310 million monthly actives, 252 million+ in the US, and 53% of US users in households above $100,000. The 25–34 bracket is 33.4% of the audience and over half the platform is under 35 — the same demographic that buys and specifies devices.
| Audience metric | 2026 figure | Why it matters for device selling |
|---|---|---|
| Total members | 1.3 billion | Verified job titles, not inferred interests |
| Monthly active users | About 310 million | The real reach denominator |
| US members | 252 million+ | Primary market for bulk device programmes |
| Members outside the US | Over 72% | Distributor and reseller recruitment |
| Household income above $100,000 | 53% of US users | Purchase authority |
| Company pages | 69 million+ | Account-based targeting universe |
| Members posting weekly | About 1% | Organic reach is not a plan |
| Share of B2B social leads | 80% | Vendor-reported, treat as share of social only |
One planning caution: seasonality is real. CPCs averaged $10.48 in Q1 of one recent year and $15.72 in Q3 — a 50% swing on identical targeting. Budget tests outside the Q3 crunch if you can.
Forms Versus Landing Pages
Form completion rate is the metric most worth watching, averaging 10–15%, with below 10% signalling offer-audience mismatch and above 25% counted as excellent. Lead Gen Forms cut CPL 20–30% and lift completion 3–5x through pre-filled profile data.
| Path | Conversion rate | Lead to SQL | Effective trade-off |
|---|---|---|---|
| Lead Gen Form | 10–18% (median 13%) | 25–40% | More leads, lower intent |
| Landing page | 2–6% (median 3.5%) | 40–55% | Fewer leads, better fit |
| Document Ad gated download | 0.50–0.90% CTR | Varies | 20–30% lower CPL |
| Conversation Ads | 35–50% open rate | Varies | Best for events and demos |
LinkedIn Against the Alternatives on Cost per Outcome
The honest comparison is not click price, it is cost per closed unit — and that reframes the answer twice. Tech and IT audiences on LinkedIn run $8–$22 CPC and $35–$75 CPM in 2026, with Sponsored Content engagement below 1.5% and Lead Gen Forms converting at 5–12%, which makes LinkedIn a precision supplement rather than a primary channel for most sellers. Meta CPCs sit at $0.50–$1.50 for the same human being.
| Channel | Typical cost | Best-fit outcome | Where it fails in tech retail |
|---|---|---|---|
| LinkedIn Sponsored Content | $5–$12 CPC, $33 CPM | Fleet and contract enquiries | Consumer handset and accessory sales |
| LinkedIn Thought Leader Ads | $2.29–$6 CPC | Cheapest qualified reach on platform | Needs a real named executive |
| Google Search / Shopping | $1.15 and $0.88 CPC | In-market device demand | No account-level targeting |
| Meta Ads | $14.50 CPM (electronics) | Volume, retargeting, accessories | No verified job titles |
| 24.5% open rate | Retention on a 24% repeat base | Requires an owned list | |
| LinkedIn Message Ads | $0.26–$0.80 per send | Event and demo invitations | One sponsored message per member per 30 days |
The counter-argument for the B2B side is deal value. LinkedIn-sourced deals are reported to carry 28.6–35% higher contract value than Google-sourced ones, and one analysis of 66 million sessions and 3.5 million journeys found LinkedIn returning 121% against Google Search at 67% and Meta at 51%. On that basis an $8.50 click producing a $50,000-plus contract costs about $2,400 per deal — effectively the same as Google Search at half the click price, on a bigger deal. LinkedIn now takes 41% of B2B paid social budgets for that reason.
How to Run LinkedIn for a Tech Retail Business
- Only fund the B2B half. Contract value above $5,000 is the published viability line; a $185 consumer order is not it.
- Start with Thought Leader and Document Ads. 2.68% and 0.50–0.90% CTR at the lowest CPMs on the platform.
- Exclude enterprise if you sell to SMB. Removing companies over 500 employees cut CPL 60–70% in agency data.
- Target titles, not functions. Ultra-specific titles reduced CPC 25–47%.
- Run forms and landing pages side by side and judge on the 40–55% versus 25–40% SQL gap, not raw CPL.
- Budget realistically. The stated minimum is $10/day; practitioners treat $50–$100/day as the floor for readable data.
- Watch CTR as a cost lever. Above 0.70% earns roughly 15% lower CPCs through relevance scoring.
If you want the channel decision made on unit economics rather than platform folklore, that is the first thing our growth marketing team models — get in touch with your AOV and close rate and the answer is usually arithmetic.
Frequently Asked Questions
What does a LinkedIn ad click cost in 2026?
The platform average CPC is $5.26, with practitioner datasets reporting $5.26–$8.90 and US-specific ranges of $6–$12. One agency dataset built on $5 million of tightly targeted B2B spend reports an average of $10.11. B2B retail and ecommerce audiences sit at the cheap end, $3.00–$6.80, because the job titles are less contested than CISOs or CFOs.
Is LinkedIn viable for a consumer phone or electronics retailer?
Rarely for direct sales. Average order value in consumer electronics ecommerce is about $185 and conversion runs 2.65%, while LinkedIn CPLs start around $68 and average $110. Published guidance puts the viability threshold near $5,000–$15,000 of contract value. LinkedIn earns its place on the B2B side of the business: bulk device sales, repair contracts, MDM, leasing and IT procurement.
What is a good LinkedIn Ads CTR in 2026?
Platform average is 0.44–0.65% with a median near 0.52%. Above 0.60% is good and above 0.90% is excellent. Format changes the answer more than industry does: Thought Leader Ads reach 2.68% at a $2.29 CPC, Document Ads run 0.50–0.90%, video runs 0.20–0.40% and right-rail Text Ads sit at 0.025%.
Do LinkedIn Lead Gen Forms beat landing pages?
On volume, clearly. Lead Gen Forms convert at 10–18% (median 13%) against 2–6% for landing pages, and pre-filled fields lift completion 3–5x. On quality it inverts: landing-page leads convert to sales-qualified at 40–55% against 25–40% for form leads. Forms reduce CPL by roughly 20–30%, so run both and judge on qualified pipeline.
How does LinkedIn compare with Meta for tech retail advertising?
LinkedIn CPM averages about $33 against $14.50 on Facebook and Instagram for electronics advertisers, and LinkedIn CPCs are 3–5x higher than Meta’s. The offsetting figure is deal value: one analysis of 66 million sessions reports LinkedIn as the only channel with positive B2B ROAS at scale, 121% against Google Search at 67% and Meta at 51%.
Sources
LinkedIn Ads benchmarks 2026 (Calc4Marketers)
Foundry CRO LinkedIn benchmarks by industry
Ryze CPC and CPL benchmarks, $47M spend
42 Agency B2B LinkedIn benchmarks
DemandSense LinkedIn Ads benchmarks 2026
AdLibrary LinkedIn advertising costs 2026
Dupple LinkedIn Ads B2B cost 2026
Leadfeeder LinkedIn statistics 2026
Consumer electronics marketing benchmarks 2026
Eightx mobile revenue share by vertical