



Table of contents

Shopify powers over 4.8 million online stores worldwide in 2026, and the consumer electronics vertical is one of its fastest-growing segments. Here are the benchmarks, conversion data, and platform insights that phone and tech retailers need to compete.
Key Takeaways
- Electronics Shopify stores convert at 1.4–2.3%, roughly half the rate of beauty and supplements stores — high AOV drives the gap.
- Average order value for electronics on Shopify is $120–$180, with device-bundling stores reaching $280+.
- Shopify holds roughly 30% of the US ecommerce platform market and approximately 10–11% globally.
- Comprehensive product content reduces electronics returns by 20–30%, with return rates sitting around 15% industry-wide.
- Smartphone accessories online sales hit $285 million in 2025, with 20–50% year-over-year growth projected for 2026.
- Optimized electronics stores achieve conversion rates of 4.2–5.0%, nearly double the category median.
Phone & Tech Retail Shopify Benchmarks at a Glance
Before diving into the data, here is a snapshot of how electronics and phone retail performs on Shopify compared to platform-wide averages. These benchmarks are drawn from multiple independent studies covering thousands of active Shopify stores across the electronics vertical.
| Metric | Electronics Benchmark | All-Shopify Average | Source |
|---|---|---|---|
| Conversion Rate | 1.4–2.3% | 2.5–3.5% | Karbon Analytics, Growth Suite |
| Average Order Value | $120–$180 | $85–$120 | DollarPocket, Acceleroi |
| Return Rate | 15% | 17.5% | WisePIM |
| Repeat-Purchase Rate | 32% | 28.5% | WisePIM |
| Cart Abandonment | 70–76% | 68–72% | EasyAppsEcom |
| Mobile Traffic Share | 78.4% | 72% | CuFinder |
Source: Aggregated from Karbon Analytics, DollarPocket, Acceleroi, WisePIM, CuFinder (2025–2026 data).
Shopify Market Share and Platform Position
Shopify's dominance in the ecommerce platform space is most visible in the United States, where the platform controls roughly 30% of the market. Globally, estimates range from 10–11% depending on the measurement methodology — trackers that include all web origins place Shopify at 4.76% alongside WooCommerce at 6.64%, while dedicated ecommerce software rankings put it above 45% market share.
The divergence in numbers stems from methodology. Platforms like GravityKit measure all detectable web origins (including sites with a minimal shop widget), while Axis Intelligence focuses on dedicated ecommerce software deployments. For phone and tech retailers evaluating platforms, the US figure is most actionable: Shopify is the dominant platform in the largest electronics market.
| Platform | US Market Share | Global Share (ecommerce software) | Source |
|---|---|---|---|
| Shopify | ~30% | ~10–11% | Axis Intelligence |
| WooCommerce | ~18% | ~20% | Axis Intelligence |
| Wix Stores | ~15% | ~1.5% (web origins) | GravityKit |
| Magento / Adobe | ~8% | — | Axis Intelligence |
| BigCommerce | ~4% | — | Axis Intelligence |
Source: Axis Intelligence, GravityKit, EcommerceTrix (2026 data).
Electronics Conversion Rate Benchmarks on Shopify
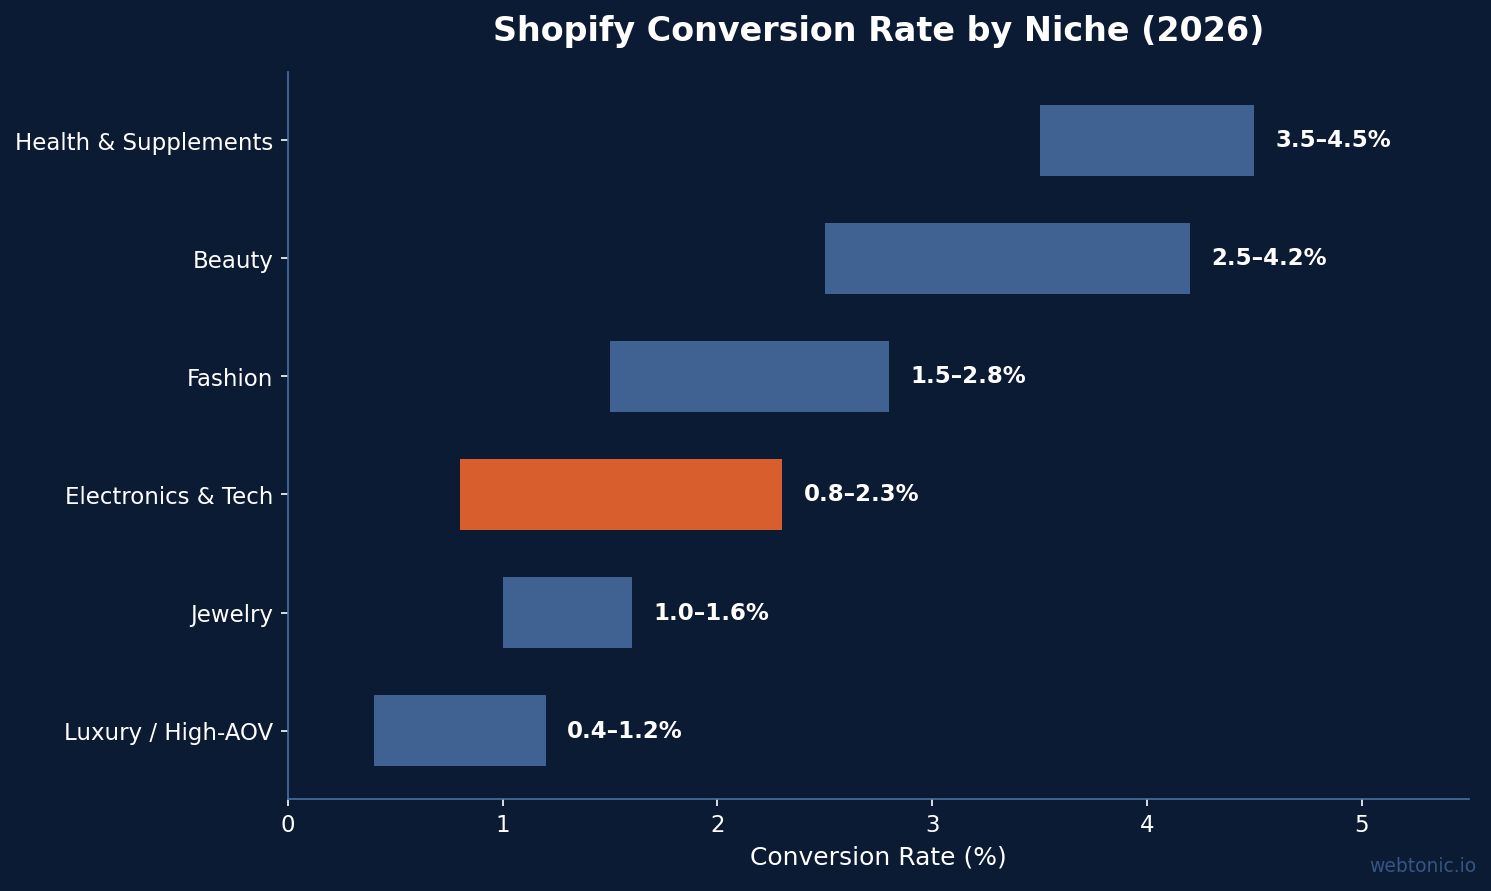
Conversion rate benchmarks reveal a clear pattern: higher average order values correlate with lower conversion rates. Electronics sits at the lower end of the Shopify conversion spectrum precisely because buyers deliberate more before committing to purchases above $150. A furniture brand converting at 1.2% or a phone case store converting at 2.1% are not broken — they are operating within expected parameters for their price point.
| Shopify Niche | CVR Range (2026) | AOV Range | Primary Conversion Driver |
|---|---|---|---|
| Health & Supplements | 3.5–4.5% | $50–$90 | Subscription models, urgency |
| Beauty & Cosmetics | 2.5–4.2% | $35–$65 | Social proof, visual demos |
| Fashion & Apparel | 1.5–2.8% | $45–$80 | Visual merchandising, sizing guides |
| Electronics & Tech | 0.8–2.3% | $120–$180 | Trust signals, detailed specs |
| Jewelry & Accessories | 1.0–1.6% | $100–$150 | Gift wrapping, complementary items |
| Luxury / High-AOV | 0.4–1.2% | $300+ | White-glove experience, exclusivity |
Source: GrowWithBa, Karbon Analytics, Growth Suite, DollarPocket (2026 benchmarks).
Top-performing electronics stores that invest in specification tables, trust badges, and post-purchase reassurance push conversion rates to 4.2–5.0%, nearly double the median. The conversion stack that matters most for tech products includes detailed comparison charts, warranty callouts above the fold, and free-shipping thresholds tied to performance creative messaging.
Average Order Value: What Phone & Tech Retailers Earn Per Transaction
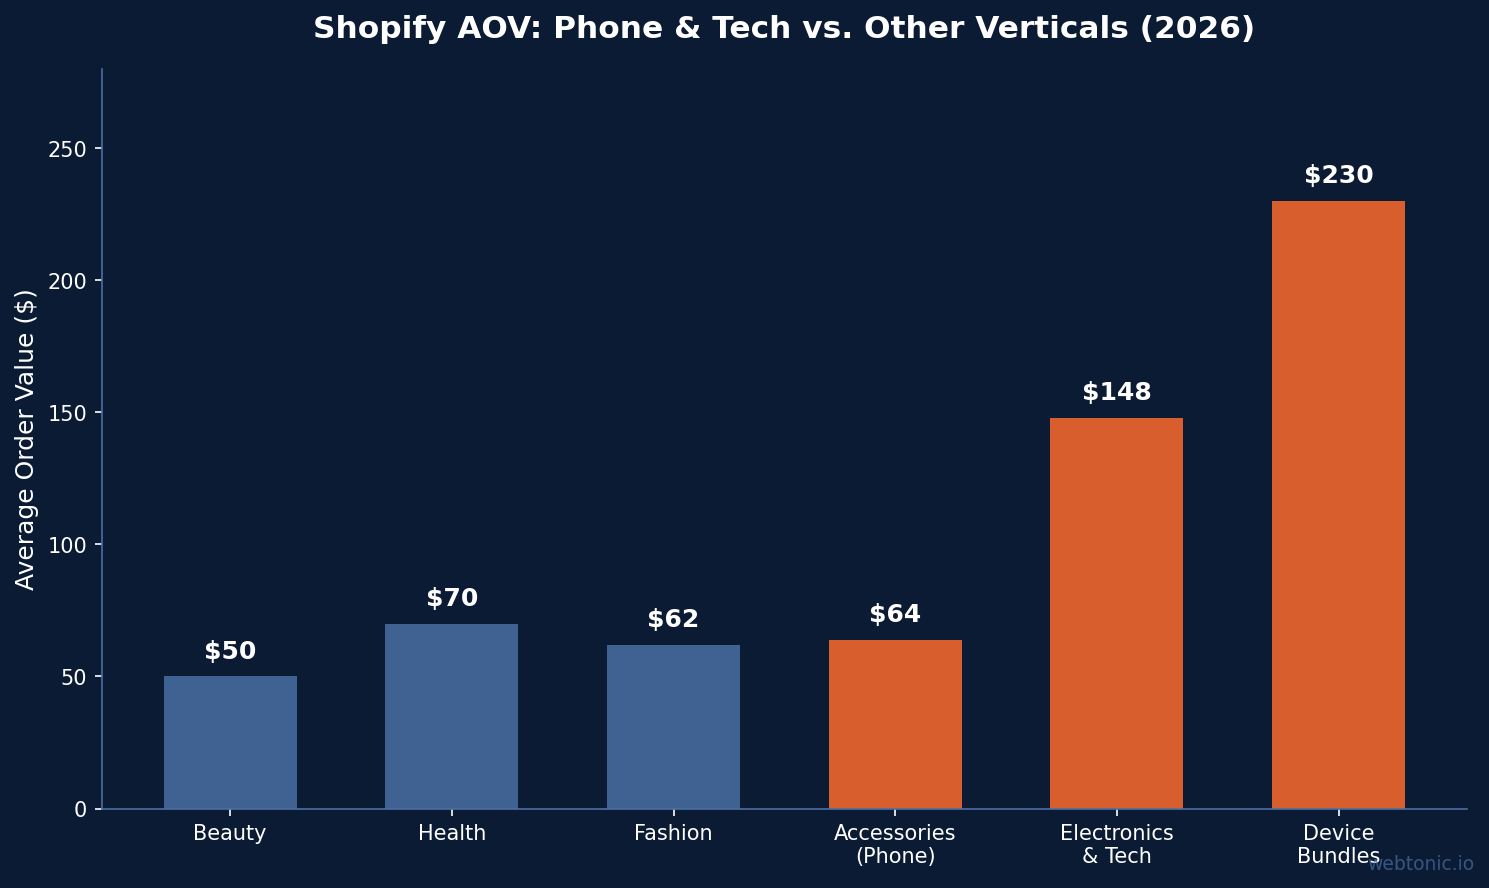
Average order value is the counterweight to lower conversion rates in electronics. The median AOV for Shopify electronics stores is approximately $127, but this figure masks a wide distribution that depends on product mix and bundling strategy:
- Single-accessory brands (cases, chargers, screen protectors): $28–$100 AOV
- Mid-range electronics (headphones, smart-home devices, wearables): $120–$180 AOV
- Device-bundling stores (phones + protection plans + accessories): $180–$280 AOV
Brands with strong device-bundling and protection-plan attachment consistently report AOVs of $145 or higher, well above the median. Warranty upsells alone can add $15–$40 to AOV on qualifying electronics items, according to Acceleroi partner data covering seven electronics brands.
Mobile Accessories: The Fastest-Growing Shopify Segment
The mobile accessories market represents one of the most dynamic opportunities for Shopify-powered phone retailers. Online retail now commands 54.22% of mobile accessories sales, and the online channel is expanding at a 7.67% CAGR through 2031. Physical outlets hold the remaining 45.78%, but they are losing ground as foot traffic declines and consumers shift to digital-first comparison shopping.
| Market Metric | Value | Source |
|---|---|---|
| Smartphone Accessories Online Sales (2025) | $285 million (tracked retailers) | Grips Intelligence |
| YoY Online Sales Growth | 20–50% | Grips Intelligence |
| Online Retail Share of Accessories | 54.22% | Mordor Intelligence |
| Online Channel CAGR (2026–2031) | 7.67% | Mordor Intelligence |
| Protective Cases Market Share | 26.11% of accessories | Mordor Intelligence |
| Mobile Accessories of Total Retail | 16.4% | Future Market Insights |
Source: Grips Intelligence, Mordor Intelligence, Future Market Insights (2025–2026 data).
For Shopify merchants in this space, the key advantage is repeat purchase potential. A customer buying a phone case today is likely to return for a charger, screen protector, or earbuds within 60 days — and retention-focused strategies can capitalize on that behavior. The 32% repeat-purchase rate in electronics outpaces fashion (25–30%), underscoring the accessory ecosystem around phone and tech products. Protective cases alone account for 26.11% of the mobile accessories market, making case-first product strategies viable as customer acquisition funnels for higher-margin add-ons.
How Product Content Impacts Returns and Revenue
Electronics has a return problem — but data shows that better product content directly reduces it. Stores that invest in comprehensive specification tables, comparison guides, and sizing or compatibility information see return rates drop by 20–30% compared to stores relying on manufacturer-supplied copy alone.
- Electronics return rates average 15% — lower than the 17.5% ecommerce-wide average, partly because product pages set clearer expectations about functionality and compatibility.
- 4 out of 5 Asurion consumers pay more for products from stores offering clear, detailed product information and transparent warranty terms.
- Stores with 360-degree product views, demo videos, and AR previews report the lowest return rates in the electronics category and the highest customer satisfaction scores.
- Structured comparison tables between similar products (e.g., iPhone 16 vs. 16 Pro case compatibility) reduce both returns and pre-purchase support tickets.
This is where Shopify's native rich-content modules provide an edge. Electronics merchants using product metafields for technical specifications, Shopify AR for 3D previews, and structured comparison layouts outperform competitors still relying on basic product descriptions. Pairing this content strategy with data-driven optimization further narrows the gap between browser and buyer. When product pages address common pre-purchase questions — compatibility, warranty coverage, included accessories — customers convert with higher confidence and lower return intent.
Best Practices for Phone & Tech Shopify Stores
- Bundle accessories with devices — bundling lifts AOV by 30–50% and improves margin per order. Offer "complete kit" options that combine a device with its most-purchased accessories.
- Add warranty and protection plan upsells — protection plans add $15–$40 to AOV on qualifying items. Display warranty options prominently in the cart, not buried in checkout.
- Invest in specification tables and comparison charts — detailed specs reduce returns by 20–30% and boost buyer confidence. Use Shopify metafields to generate spec tables dynamically.
- Optimize for mobile first — 78.4% of electronics traffic is mobile. Ensure checkout is thumb-friendly, images load fast, and CTAs are visible without scrolling.
- Use structured data for product pages — product schema drives rich snippets and improves click-through rates from organic search results.
- Implement post-purchase email and SMS flows — cross-sell related accessories within 7 days of a device purchase. Electronics buyers who receive targeted follow-ups show 32% higher repeat-purchase rates.
- A/B test trust badges, guarantee copy, and shipping thresholds — electronics buyers require more reassurance on high-ticket items than buyers in other verticals.
Electronics vs. Other Shopify Verticals: Performance Comparison
When comparing electronics to other Shopify verticals, the story is about trade-offs between volume and value. While health and beauty stores convert more browsers into buyers, electronics merchants generate substantially more revenue per transaction and maintain a stronger repeat-purchase cycle driven by the accessory ecosystem.
| Metric | Electronics | Beauty | Health | Fashion |
|---|---|---|---|---|
| CVR | 1.4–2.3% | 2.5–4.2% | 3.5–4.5% | 1.5–2.8% |
| AOV | $120–$180 | $35–$65 | $50–$90 | $45–$80 |
| Return Rate | 15% | 8–12% | 5–10% | 20–25% |
| Repeat Purchase | 32% | 40–45% | 50–55% | 25–30% |
| Mobile Share | 78.4% | 82% | 75% | 80% |
Source: WisePIM, GrowWithBa, EasyAppsEcom, CuFinder (2026 benchmarks).
The repeat-purchase rate of 32% for electronics is encouraging — and higher than fashion (25–30%). This reflects the accessory ecosystem around phones and devices, where a single customer often makes 3–5 related purchases over a product lifecycle. Brands leveraging paid acquisition strategies should factor lifetime value, not just first-order ROAS, into their targeting decisions.
Related reading
- Phone & Tech Retail WordPress Statistics (2026)
- Inside Phone & Tech Retail Webflow: Key Statistics & Insights for 2026
- 60+ Statistics Shaping Landing Pages & CRO in the Phone & Tech Retail Industry (2026)
- Custom Web Development services at Web Tonic
FAQ
What is the average Shopify conversion rate for electronics stores?
Electronics stores on Shopify convert at 1.4–2.3% on average, according to 2026 benchmarks from Karbon Analytics and Growth Suite. Top-performing stores with optimized product pages, trust badges, and comprehensive spec tables can reach 4.2–5.0%, nearly double the category median.
What AOV should a phone accessories Shopify store expect?
Single-accessory phone stores typically see AOV of $28–$100, while stores bundling devices with accessories and protection plans reach $180–$280. The electronics category median is approximately $127 across all Shopify electronics stores tracked by Acceleroi.
How does Shopify compare to WooCommerce for electronics retail?
Shopify holds ~30% US ecommerce platform market share versus WooCommerce's ~18%. For electronics retailers, Shopify's advantage lies in its native checkout optimization, app ecosystem for warranty upsells, and built-in analytics. WooCommerce offers more backend customization but requires more technical resources and ongoing maintenance.
What is the return rate for electronics on Shopify?
Electronics return rates on Shopify average 15%, slightly below the 17.5% ecommerce-wide average. Stores investing in comprehensive product content — including detailed specifications, comparison guides, and demo videos — reduce returns by 20–30% compared to stores using manufacturer-supplied copy.
Is Shopify growing in the phone and tech retail segment?
Yes. Smartphone accessories online sales reached $285 million in 2025 across tracked retailers, with 20–50% year-over-year growth projected for 2026. Online retail now accounts for 54.22% of mobile accessories sales, and the online channel is expanding at a 7.67% CAGR through 2031, according to Mordor Intelligence.
Sources
Acceleroi — Shopify Electronics AOV Benchmark 2026
DollarPocket — Shopify Store Benchmarks 2026
Karbon Analytics — Shopify CVR Benchmarks 2026
GrowWithBa — Average Shopify Conversion Rate 2026
WisePIM — Electronics E-commerce Benchmarks 2026
GravityKit — Ecommerce Platform Market Share 2026
Axis Intelligence — Shopify Statistics 2026
EcommerceTrix — Shopify Statistics 2026
Grips Intelligence — Smartphone Accessories Analytics
EasyAppsEcom — Ecommerce Statistics 2026
CuFinder — Consumer Electronics Marketing Benchmarks


