Table of contents

Webflow now powers about 0.8% of all websites and appeared on 2.1% of home pages in the 2026 Web Almanac sample, up from 1.4% a year earlier. For phone and tech retail the question is narrower: can a design-first platform carry a catalogue where every model multiplies by storage, colour and condition, on a device split where 67% of sessions are mobile but only 35% of revenue is?
Key Takeaways
- Webflow reached roughly 822,000 live sites and $213M in revenue (+66% year over year), with about 15,700 active stores — credible, but a rounding error next to the 24 million stores running on ecommerce platforms.
- Webflow pages beat WordPress by 410ms on median LCP and win the platform Core Web Vitals table on desktop at 71% good scores, yet only 53% on mobile.
- Consumer electronics converts at 2.1% on desktop and 0.9% on mobile — a 2.3x gap, the widest of any retail vertical.
- Electronics takes 35% of revenue from mobile against 67% of traffic; apparel is already mobile-majority at 62%.
- Product-page wallet checkout logs 4.1% to 6.8% mobile conversion versus 1.9% to 2.7% for form-based flows.
- Webflow operators succeed under about 200 SKUs; comparison guides put the practical ceiling nearer 30 SKUs before commerce depth bites.
Webflow Benchmarks at a Glance for Tech Retail
The platform numbers below are the ones worth quoting in a build decision. Note the scope column: population-wide field data and agency-built samples disagree by more than a second on load time.
| Metric | 2026 value | What is being counted |
|---|---|---|
| Share of all websites | 0.8% | W3Techs population share, roughly 1 in 125 sites |
| Share of Web Almanac home pages | 2.1% | 16.4M home pages crawled, up from 1.4% |
| Live Webflow sites | ~822,000 | Aggregated tracker counts, 2026 |
| Active Webflow stores | ~15,700 | Storefronts with live commerce enabled |
| Platform revenue | $213M | FY2024, +66% year over year, $4B valuation |
| Good Core Web Vitals, desktop | 71% | Builder comparison, share of sites passing |
| Good Core Web Vitals, mobile | 53% | Same sample; all-builder average is 41% |
| Ecommerce pricing | $42 / $84 / $235 | Standard / Plus / Advanced, billed annually |
Webflow is small in absolute terms and growing fast in relative terms: usage doubled from about 0.4% of the web in 2021, and Webflow ecommerce sites grew 647% over three years. Against WordPress at roughly 43% of the web, share is not the argument — build speed and page experience are. See our growth marketing services for how platform choice feeds the wider acquisition plan.
Speed: Where Webflow Actually Wins for Phone Retailers
Page experience still influences organic placement, and phone shoppers are impatient. The 2026 Web Almanac (16.4 million home pages, 22.1 million inner pages) found Webflow sites ahead of WordPress by 410ms on median LCP and 0.03 on median CLS. It also found median mobile INP worsened by 11ms year over year across the web, driven by heavier JavaScript on landing pages.
| Platform / sample | Typical LCP | Typical INP (p75) | Scope |
|---|---|---|---|
| Webflow storefront (tested) | 1.4s | — | Independent Q1 2026 test, equivalent catalogue load |
| Shopify Dawn theme (tested) | 1.9s | — | Same test, default theme |
| Well-built Webflow site | 2.0–2.4s | 100–180ms | Field p75 on audited builds |
| Shopify, 3 or fewer apps | 2.2–2.6s | 130–200ms | Optimised theme, field p75 |
| Shopify, 8+ apps | 2.8–3.6s | 200–280ms | Default theme, no audit |
| Unoptimised Webflow sample | 2.8s | — | 50 sites vs 50 Next.js sites, lab tooling |
| Next.js custom build | 0.9s | — | Same 50-site comparison |
Two lessons. First, halving app count moves p75 LCP by 400 to 600ms — heavier than most platform migrations. Second, Webflow does not immunise you: the same platform shows 1.4s in a tuned build and 2.8s in an average one, with total page weight at 3.2MB against 680KB for a custom front end.
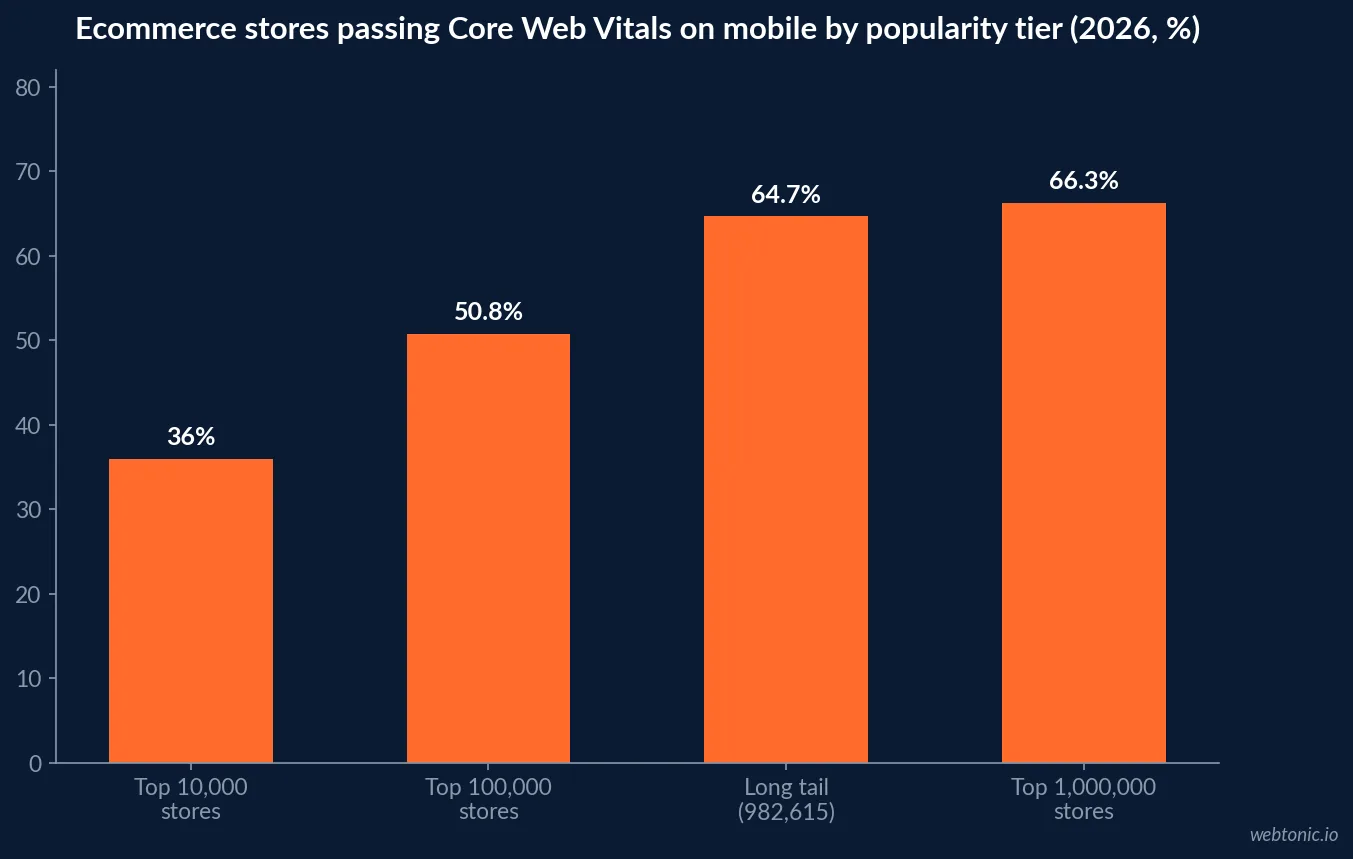
Scale is not on your side either way. Across 1.07 million stores in Chrome field data, only 36.0% of the top 10,000 pass Core Web Vitals on mobile against 64.7% of the long tail, and the entire difference is responsiveness: good INP falls from 94.6% to 45.3%, with several flagship stores answering a tap in 400 to 675ms. Every widget you bolt onto a phone-retail PDP — live stock, trade-in calculator, finance estimator, chat — competes for the same thread.
The Mobile Gap That Defines Electronics Storefronts
This is the number that should shape a tech-retail Webflow build. Mobile is the research device, desktop is the buying device, and electronics has the widest split in retail.
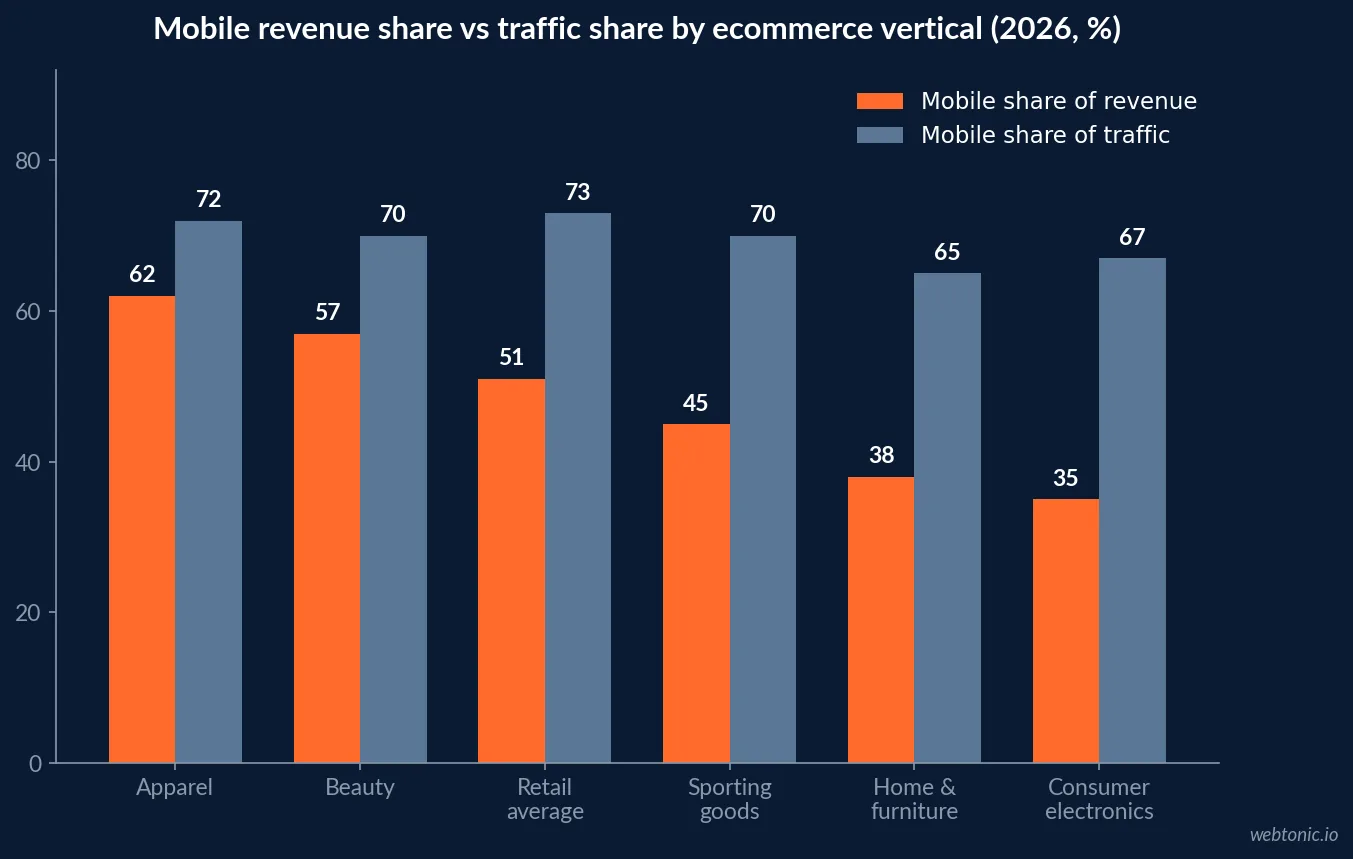
| Vertical | Mobile share of revenue | Mobile share of traffic | Read |
|---|---|---|---|
| Apparel | 62% | 72% | Mobile-majority revenue; low consideration |
| Beauty | 55–60% | 70% | Near parity, easy wins mostly done |
| General retail average | 51% | 73% | 22-point gap is the industry norm |
| Sporting goods | 45% | 70% | Longer consideration, larger baskets |
| Home & furniture | 38% | 65% | High AOV, comparison-heavy |
| Consumer electronics | 35% | 67% | Widest gap in retail |
Conversion data says the same thing from the other direction: consumer electronics converts at 2.1% on desktop against 0.9% on mobile (2.3x), versus 1.6x for apparel and beauty. A 1.6x gap is the floor for a well-optimised mobile checkout; anything wider is a fixable problem, and electronics is a long way past it. Category conversion overall averages 2.49% with a top quartile above 4%, on an electronics AOV near $190.
Checkout: The Highest-Return Fix on a Webflow Tech Store
Wallet checkout, not redesign, closes the device gap. Agency data shows stores surfacing Apple Pay first on the product page logging 4.1% to 6.8% mobile conversion against 1.9% to 2.7% for multi-step form checkouts, and one audit of 47 stores found the laggards leaving 23% of mobile revenue on the table.
| Lever | Measured effect | Effort on Webflow |
|---|---|---|
| Wallet button on PDP | 2x+ conversion vs form checkout | Low — native or gateway toggle plus placement |
| Enabling Apple / Google / Shop Pay | +15% to +25% mobile CVR | Low |
| Mobile LCP improvement | ~1% CVR per 100ms | Medium — image weight, third-party scripts |
| Sticky add-to-cart, swipe galleries | ~20% better than ported desktop layouts | Low in Webflow Designer |
| Removing forced account creation | Addresses 26% of abandonment | Low |
| Showing total cost early | Addresses 48% of abandonment | Medium |
Benchmarks to hold yourself to: express-checkout initiation of 18% to 25% where the button is well placed (below 10% signals a placement problem), wallet conversion at least 2x your form rate, and mobile abandonment under the 78% ecommerce average. Cart abandonment overall sits at 70.22%, but mobile runs 85.65% against 73% on desktop.
Where Webflow Breaks for Phone and Tech Catalogues
Phone retail is a variant business. One handset becomes six SKUs across storage and colour, twelve if you sell refurbished grades, and accessories multiply from there. That is precisely the axis where Webflow Ecommerce is thinnest.
| Constraint | Reality in 2026 | Impact on a phone retailer |
|---|---|---|
| Comfortable SKU range | Under 200 products; guides say nearer 30 | Handsets plus accessories exceed it quickly |
| CMS item ceiling | 10,000 items on top tiers | Fine for content, tight for variant-level pages |
| Subscriptions | Not native | Blocks care plans and insurance bundles |
| Tax and multi-region | Limited automation | Painful past three tax regions |
| App ecosystem | Small; $50–$200/mo typical | Reviews, loyalty, upsells need custom work |
| Transaction fee | 2% on Standard, 0% on Plus/Advanced | Standard also caps at $50k annual sales |
The pattern that works: a Webflow front end over a dedicated commerce back end. Reviewers describe it as the most designer-friendly headless setup for brands in the $1M to $5M range, and it keeps editorial pages, comparison guides and launch content in the visual builder while inventory, tax and payments stay in the commerce engine. Our performance creative team builds against exactly that split.
Cost of Ownership Against the Alternatives
For a $1M brand, 24-month total cost of ownership lands within about 15% either way between Webflow Ecommerce Plus and Shopify Advanced. The differences show up in build cost and app spend, not hosting.
| Line item | Webflow | WordPress / WooCommerce | Custom front end |
|---|---|---|---|
| Typical build | $5,000–$25,000 | $3,000–$15,000 templated | $15,000–$75,000+ |
| Monthly platform | $42–$235 plus seats | $135–$795 all-in | $21–$125 |
| App / plugin spend | $50–$200 | $50–$280 | Build cost instead |
| Store share of market | ~15,700 stores | WooCommerce ~18% of stores | n/a |
| Speed ceiling | 1.4–2.4s LCP tuned | 3.4–3.8s typical | 0.9s |
Read this next to your ad economics rather than in isolation. In electronics, mobile carries roughly 72% of traffic and 61% of orders at a category conversion rate near 2.65% and an AOV around $185, so a 100ms LCP win on mobile is worth more than any hosting line item. Compare the paid side in our breakdown of what Google Ads actually costs in 2026.
What Website Owners Say They Struggle With
Webflow surveyed 1,000 marketing and technology leaders across the US, UK and Canada for its 2026 report. The findings are less about platforms than about governance, and they match what tech retailers report during replatforming.
- 91% say the website drives more revenue than any other marketing channel.
- 95% say current governance practices hurt their ability to manage the site.
- 97% of technical leaders say technical debt materially affects site management.
- 92% report update requests growing in size and complexity.
- Only 28% deliver web projects on time and on budget.
- 52% will prioritise optimisation for AI-driven search and summaries in 2026.
That last point matters for phone retail specifically, where spec-level structured data is what gets a product quoted in an AI answer. Whatever platform holds the catalogue has to emit clean Product markup with real attribute fields.
A 90-Day Plan for a Webflow Tech Storefront
- Weeks 1–2: pull field Core Web Vitals, not lab scores, and segment by template. Target p75 LCP under 2.4s and INP under 180ms — the band audited Webflow builds actually hit.
- Weeks 2–4: put a wallet button above the fold on every product page and measure initiation rate against the 18% to 25% benchmark.
- Weeks 4–6: cut third-party scripts on PDPs. Every removed widget buys back INP, the metric that fails big stores.
- Weeks 6–8: decide the architecture honestly. Past roughly 200 SKUs or any subscription requirement, move commerce behind Webflow rather than fighting the platform.
- Weeks 8–12: rebuild PDP structured data with spec-level attributes, then track mobile revenue share monthly. Moving electronics from 35% toward 45% is the whole game.
Instrument it properly or none of it is provable — see our data intelligence services for the measurement layer.
Frequently Asked Questions
Is Webflow a good platform for a phone and tech retail store?
It fits brand-led tech retailers with fewer than roughly 200 SKUs, and reviewers put the comfortable ceiling closer to 30 SKUs before Webflow Ecommerce feels thin. Phone retail catalogues multiply fast (model x storage x colour x condition), so most operators past a few hundred variants run Webflow as the front end and keep a dedicated commerce engine behind it.
How fast are Webflow sites compared with other platforms?
The 2026 Web Almanac found Webflow pages beat WordPress pages by 410 milliseconds on median LCP and 0.03 on median CLS. Independent testing put Webflow storefronts at 1.4 seconds LCP against 1.9 seconds for Shopify's Dawn theme under comparable catalogue loads, while a 50-site sample of unoptimised Webflow builds averaged 2.8 seconds. Platform choice sets your floor, not your score.
Why does mobile traffic dominate electronics stores but not revenue?
Consumer electronics runs roughly 67% of sessions on mobile and only about 35% of revenue, because phones are the research device for high-consideration, high-AOV purchases. Desktop converts at about 2.1% against 0.9% on mobile in the category, a 2.3x gap, the widest in retail.
What does Webflow Ecommerce cost for a tech retailer in 2026?
Published 2026 pricing runs about $42 per month for Standard, $84 for Plus and $235 for Advanced when billed annually, with a 2% transaction fee and a $50,000 annual sales cap on Standard. Add workspace seats. A comparable app stack on Webflow runs $50 to $200 per month against $300 to $700 on a $1M Shopify store, because the app market is smaller.
What should a phone retailer fix first on a Webflow storefront?
Express wallet checkout on the product page. Stores surfacing Apple Pay first log mobile conversion of 4.1% to 6.8% versus 1.9% to 2.7% for multi-step form checkouts, and adding wallet options lifts mobile conversion 15% to 25% on its own. Then attack LCP: roughly 1% conversion per 100 milliseconds of mobile LCP improvement is a reliable retail rule of thumb.
Sources
Popupsmart — Webflow statistics 2026
2026 Web Almanac findings for Webflow audits
Ecommerce Times — Webflow's ecommerce layer in 2026
Website Builder Report — market share and Core Web Vitals
Digital Heroes — Webflow vs Shopify field data
PageSpeed Matters — ecommerce Core Web Vitals by store tier
Metricuno — desktop vs mobile conversion by vertical
Eightx — mobile revenue share by vertical
Foundry CRO — ecommerce conversion benchmarks 2026
Online Store News — wallet checkout conversion benchmarks
CUFinder — consumer electronics ecommerce benchmarks