



Table of contents

US pest control generated USD 13.416 billion in 2025 and streaming reached 49.0% of TV time at the height of summer 2026, yet no published study reports what pest control firms spend on connected TV. What can be measured is the season, the audience and the price of entry.
Key Takeaways
- US structural pest control revenue reached USD 13.416 billion in 2025, up 6%.
- Nearly 13.29 million residential customers used professional service in 2025.
- Recurring revenue was 85.4% of residential service revenue.
- 36.8% of firms said technician shortages constrained growth.
- Streaming rose from 48.6% of TV in May 2026 to 49.0% in July (Nielsen).
- Roku carried 32% of North American programmatic CTV ad share in Q4 2025 (Pixalate).
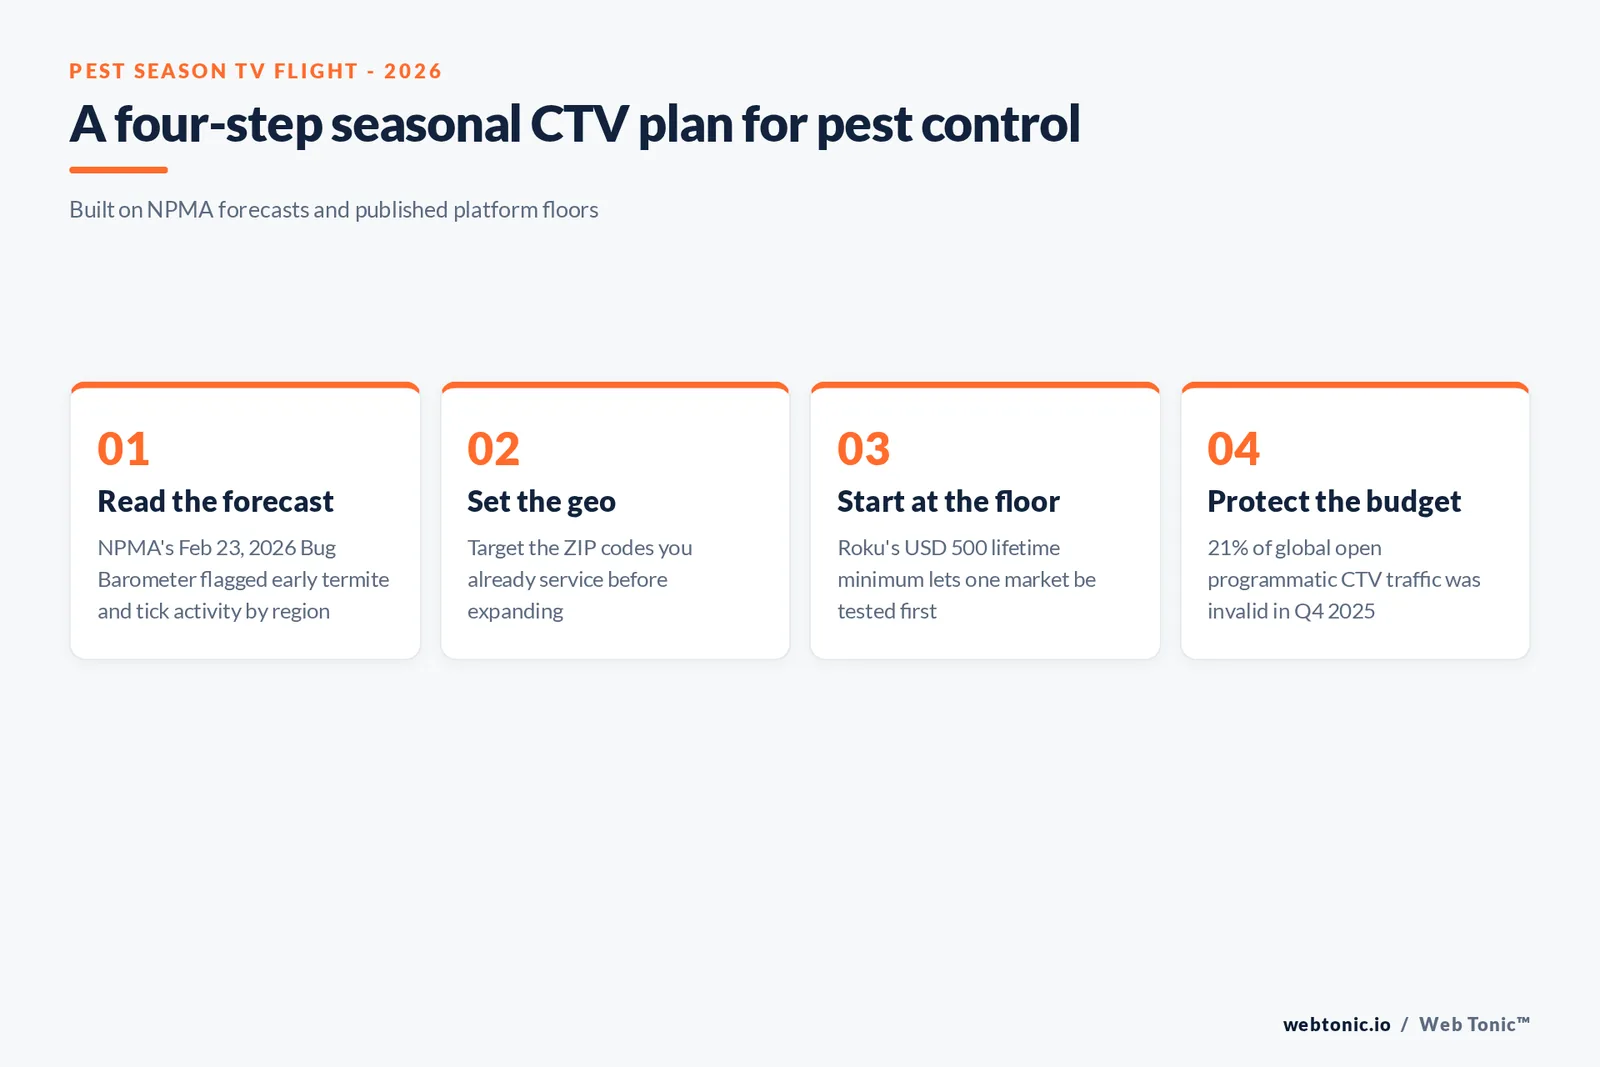
- 21% of global open programmatic CTV traffic was invalid in Q4 2025.
- US CTV ad spend was estimated at USD 26.6 billion for 2025 (IAB).
- Roku's self-serve floor is a USD 500 lifetime budget.
The market behind the ad
NPMA reports, citing Specialty Consultants' 2025 study, that US structural pest control generated USD 13.416 billion in 2025, a 6% rise from USD 12.654 billion and more than 2.7 times US real GDP growth. Nearly 13.29 million residential customers bought professional service, and recurring contracts made up 85.4% of residential revenue. Two-thirds of respondents, 66.8%, expected residential revenue to grow in 2026, while 36.8% said growth was limited by too few technicians.
| NPMA / Specialty Consultants metric | Figure | Year | Advertising implication |
|---|---|---|---|
| Structural pest control revenue | USD 13.416 billion | 2025 | Large local-services category |
| Revenue growth | +6% | 2025 vs 2024 | Demand still expanding |
| Residential customers | Nearly 13.29 million | 2025 | Most homes are not customers |
| Recurring share of residential revenue | 85.4% | 2025 | A new customer is worth a contract, not a visit |
| Firms constrained by technician shortage | 36.8% | 2025 | Do not buy demand you cannot service |
| Firms expecting residential growth | 66.8% | 2026 outlook | Competition for the same homes |
The recurring-revenue figure matters for TV math. When most residential revenue comes from ongoing plans, a campaign is buying customer lifetimes, so a flight can be judged on contracts signed rather than one-off calls. The technician figure is the brake: a spot that fills the phones in a week when crews are booked out wastes the impressions.
Timing: what the 2026 Bug Barometer said
NPMA's Spring and Summer 2026 Bug Barometer, published February 23, 2026, warned that erratic winter weather could bring pests out sooner and in greater numbers. It is a forecast by NPMA entomologists, not measured demand, but it is the industry's own timing signal and it varies by region.
| Region (NPMA 2026 forecast) | Expected early pressure | Seasonal note | Flight timing idea |
|---|---|---|---|
| Northeast | Termites, stink bugs, lady beetles | Mild start to winter, drier spring | Early-spring spots |
| Southeast | Termites, mosquitoes, ants | Warm, wet spring; storms in summer | Spring plus storm-season bursts |
| South Central | Termites, ticks, mosquitoes | Mild, damp spring after cold winter | Early spring start |
Streaming share through the pest season
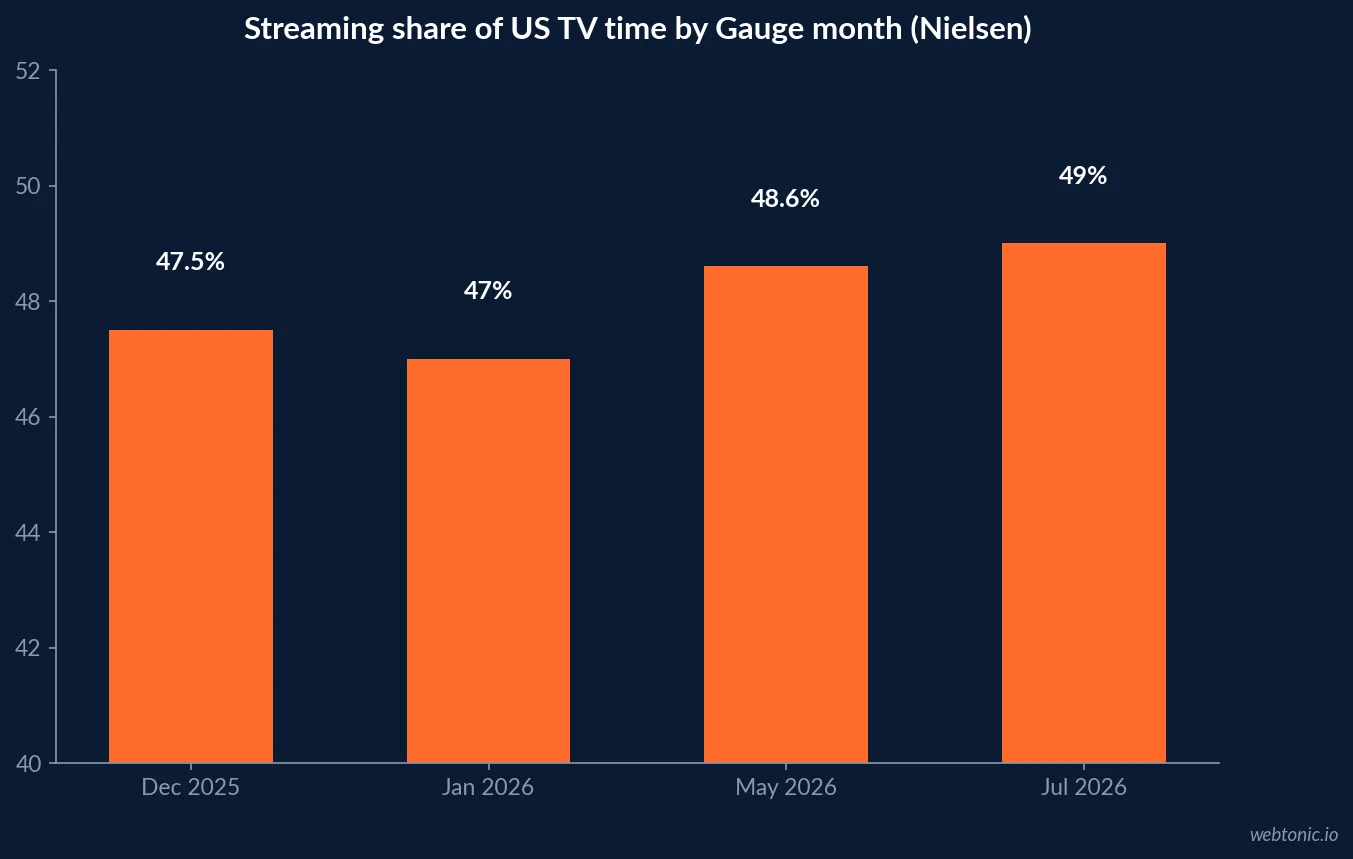
Nielsen's Gauge shows streaming gaining through the warm months. The May 2026 report put streaming at 48.6% of TV watch time, up from 44.8% a year earlier, and the July 2026 report put it at 49.0%, with YouTube at a record 14.2%. In winter the share was a little lower: 47.5% in December 2025 and 47.0% in January 2026, according to Nielsen's January report.
| Gauge month | Streaming share | Broadcast | Cable |
|---|---|---|---|
| December 2025 | 47.5% | - | - |
| January 2026 | 47.0% | - | - |
| May 2026 | 48.6% | - | - |
| July 2026 | 49.0% | 19.5% | 18.7% |
The pattern lines up with pest season: the months when calls rise are also the months when streaming holds its largest share of TV. That is a coincidence of calendars, not evidence that streaming ads create pest calls, but it means a summer TV plan that skips streaming skips about half of viewing.
Which screens carry the ads
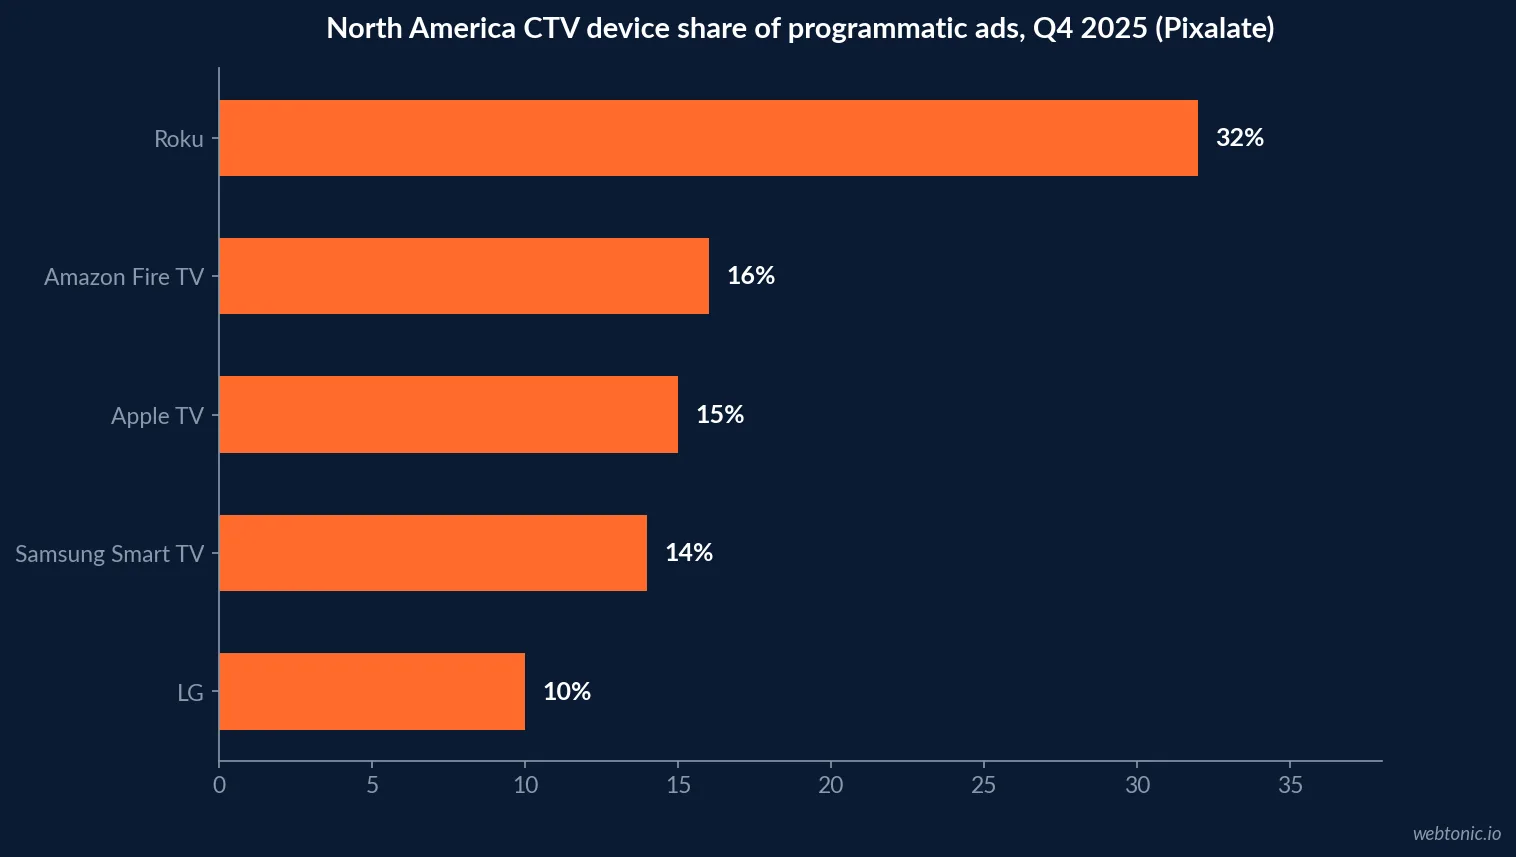
Pixalate's Q4 2025 CTV supply chain report measured device share of voice for open programmatic ads in North America: Roku 32%, Amazon Fire TV 16%, Apple TV 15%, Samsung Smart TV 14% and LG 10%. The measure reflects where programmatic ads were delivered, which Pixalate uses as a proxy for usage.
Invalid traffic by device
The same report found 21% of global open programmatic CTV traffic was invalid in Q4 2025, with Amazon Fire TV lowest at 14% and Samsung Smart TV highest at 28%. Global open programmatic CTV spend was USD 6.9 billion in the quarter, down 9% year on year. Pixalate sells fraud protection, so treat these as vendor benchmarks for open programmatic supply. For a local operator buying a few thousand households, a fifth of delivery going to invalid traffic is the difference between a readable test and noise.
| Pixalate Q4 2025 measure | Figure | Scope |
|---|---|---|
| Invalid traffic, global open programmatic CTV | 21% | All devices |
| Lowest-IVT device | Amazon Fire TV, 14% | Global |
| Highest-IVT device | Samsung Smart TV, 28% | Global |
| Global open programmatic CTV spend | USD 6.9 billion | Q4 2025, down 9% YoY |
| Roku share of voice | 32% | North America |
How big the CTV market is
IAB's 2025 Digital Video Ad Spend report estimated US CTV ad spend at USD 26.6 billion for 2025, up 13% and 43% larger than online video. Home-services brands are a small part of that total, and IAB does not break out pest control. The size of the market mostly tells a local operator that national advertisers set the auction price in peak months.
IAB's 2026 edition projects total US digital video past USD 80 billion in 2026, with CTV growing 11% and social video 13%. Summer 2026 also carried the World Cup, which Nielsen credits with lifting viewing in June and July; big live events bring more national buyers into the same inventory a local operator bids on, so a maximum-bid cap is worth setting before a peak-season flight goes live.
Entry costs for a seasonal flight
Roku requires a lifetime budget of USD 500 per campaign and bills only on delivered spend. MNTN advertises no upfront commitments and no minimums, and its small-business program cites entry from USD 2,000. Amazon Ads recommends USD 10K for self-service streaming TV and requires USD 50K for managed service. A single branch can test one spring flight at the lowest of these; a multi-state operator can stage bursts by region as the forecast moves.
| Platform | Published entry point | Pricing basis | Seasonal use |
|---|---|---|---|
| Roku Ads Manager | USD 500 lifetime minimum | Dynamic CPM, billed on delivery | One-branch spring test |
| MNTN Performance TV | No minimums; from USD 2,000 | Dynamic CPM | Regional burst ahead of peak |
| Amazon streaming TV, self-service | USD 10K recommended | Amazon DSP | Multi-market season |
| Amazon streaming TV, managed | USD 50K minimum | Managed service | Multi-state operator |
Linear versus streaming prices
Pest control has a long history on local broadcast, so the price comparison matters. Tatari's analysis of its own client data from 2019 to 2023 found streaming CPMs typically three to four times linear, about USD 9.50 against USD 2.50, and says its streaming rates already sit below open-market programmatic prices. Its 2025 planning note reports the average 30-second streaming CPM fell 16.7% in 2024.
For a route-based business the higher streaming CPM buys something linear cannot: the ability to pay only for homes inside a service area. A broadcast spot in a large market reaches counties no technician drives to. Whether tighter targeting outweighs a CPM three to four times higher depends on how much of the market a company actually covers, which only its own route map and call data can answer. These are cross-industry figures from one buyer; no pest-specific CPM has been published.
| Cost reference | Figure | Source | Scope |
|---|---|---|---|
| Streaming CPM, 2019-2023 | About USD 9.50 | Tatari client data | Cross-industry |
| Linear CPM, 2019-2023 | About USD 2.50 | Tatari client data | Cross-industry |
| Streaming vs linear | 3 to 4 times higher | Tatari client data | Cross-industry |
| 30-second streaming CPM change, 2024 | -16.7% | Tatari 2025 planning note | All categories |
What is not measured
No verified source publishes pest control CTV CPMs, completion rates, cost per booked inspection or return on ad spend. Vendor case studies exist for home services generally, but without sample sizes they are not benchmarks. The defensible plan uses what is measured: a growing, contract-driven market, a regional forecast published each February, a streaming share near half of TV in summer, and invalid traffic that must be screened out.
It is also worth separating residential from commercial work. The NPMA figures above describe residential customers and recurring residential revenue; commercial accounts are usually won through bids and relationships, and household-targeted streaming is a poor fit for them. Keep TV aimed at homeowners in the ZIP codes your routes already cover, and judge it on new recurring plans signed.
Finally, the forecast is regional and so should the spend be. The Bug Barometer describes different pests and different timing for the Northeast, the Southeast and South Central states, so a single national start date will be early in some markets and late in others. Staggering flights by region, and pausing a market when crews are fully booked, keeps the budget tied to the demand the industry itself expects.
A seasonal spot plan
- Read the regional Bug Barometer each February and pick the first markets to open.
- Check technician capacity for the flight weeks before booking media.
- Start at a published floor in serviced ZIP codes and cap CPM with a maximum bid.
- Use a tracked phone number and a booking page tied to the spot.
- Request delivery by device and app; exclude supply with high invalid traffic.
- Measure new recurring plans in exposed versus unexposed ZIP codes before scaling.
More context: our streaming media statistics, the pest control SMS marketing data for following up seasonal leads, and the advertising statistics roundup. Our data intelligence team sets up ZIP-level lift reads.
Frequently Asked Questions
Do pest control companies advertise on connected TV?
Some do, but no public dataset measures how much the industry spends on CTV or what it pays per household. The verifiable evidence is indirect: a USD 13.416 billion US market in 2025 (NPMA / Specialty Consultants), streaming at 49.0% of TV time in July 2026 (Nielsen) and platform budget floors from USD 500.
When should a pest control company run TV ads?
Ahead of local pest pressure. NPMA's Spring and Summer 2026 Bug Barometer, released February 23, 2026, forecast early termite, tick and mosquito activity in several regions. Streaming's share of TV also rises into summer, from 48.6% in May 2026 to 49.0% in July.
What is the cheapest way to test streaming TV for pest control?
Roku Ads Manager requires a lifetime campaign budget of at least USD 500, and MNTN markets small-business entry from USD 2,000 with no minimums. Amazon recommends USD 10K for self-service streaming TV. Target the ZIP codes you already service.
Which streaming devices matter most?
In North America, Pixalate measured Roku at 32% of open programmatic CTV ad share of voice in Q4 2025, followed by Amazon Fire TV at 16%, Apple TV at 15%, Samsung at 14% and LG at 10%. This measures programmatic ad delivery, not household ownership.
How much CTV traffic is invalid?
Pixalate found 21% of global open programmatic CTV traffic was invalid in Q4 2025, ranging from 14% on Fire TV to 28% on Samsung Smart TV. Ask for device-level reporting and prefer direct inventory.
Sources
NPMA - US pest control industry grows 6% in 2025
NPMA - Spring and Summer 2026 Bug Barometer
Nielsen - May 2026 The Gauge
Nielsen - July 2026 The Gauge
Nielsen - January 2026 The Gauge
Pixalate - Q4 2025 CTV supply chain trends
IAB - 2025 Digital Video Ad Spend report
IAB - 2026 Digital Video Ad Spend report
Roku - Campaign budget and schedule
MNTN - Performance TV
MNTN - Go Big small business program
Tatari - Linear vs streaming CPMs
Tatari - How to plan and budget for TV in 2025
Amazon Ads - Streaming TV ads


