



Table of contents
67% of home services business leaders cannot connect marketing spend directly to revenue — and for pest control operators running four or more channels simultaneously, that blind spot costs six figures annually. Call tracking, attribution modeling, and conversion analytics transform pest control marketing from guesswork into a measurable growth engine. Here are the benchmarks that define what "good" looks like.
Key Takeaways
- 67% of home services leaders can't tie marketing spend to revenue — the most expensive blind spot in pest control operations (Scorpion, 2026 State of Home Services).
- Elite pest control teams close 65%+ of qualified inbound leads — while below-average teams convert just 20–30% (Plaibook, thousands of call recordings).
- Companies self-report close rates 15–25 percentage points higher than reality — the average company claims 55–75% but actually closes 30–45%.
- A minimum viable attribution stack costs $30–$50 per month — GA4, call tracking, UTM discipline, and CRM lead-source fields (Cube Creative).
- LSA calls bypass websites entirely — creating the largest single attribution blind spot for operators relying on web analytics alone.
- Pest control software produces 2x–4x ROI through recovered missed calls, churn reduction, and route optimization (Ardenus, 2026 framework).
Pest Control Analytics Benchmarks at a Glance
| Metric | Benchmark | Source |
|---|---|---|
| Leaders unable to attribute revenue | 67% | Scorpion 2026 Home Services Report |
| Elite team close rate (qualified leads) | 65%+ | Plaibook call data analysis |
| Average team close rate | 30–45% | Plaibook call data analysis |
| Self-reported vs. actual close rate gap | 15–25 pts | Plaibook call data analysis |
| Minimum attribution stack cost | $30–$50/mo | Cube Creative |
| After-hours call volume | 57% | MarketingLTB 2026 |
| Pest control software ROI | 2x–4x | Ardenus 2026 |
| Home services CPC (YoY increase) | $6.88 (+22.6%) | Visionary Marketing 2026 |
| Website bounce rate — pest control avg. | 47% | MarketingLTB 2026 |
Close Rates by Team Performance Tier
The gap between top-performing and average pest control sales teams is wider than most operators assume. Analysis of thousands of real pest control sales calls reveals a four-tier distribution that challenges the industry's self-reported numbers. The data comes from recorded inbound calls, not CRM summaries, which is why the numbers differ so dramatically from what most operators believe.
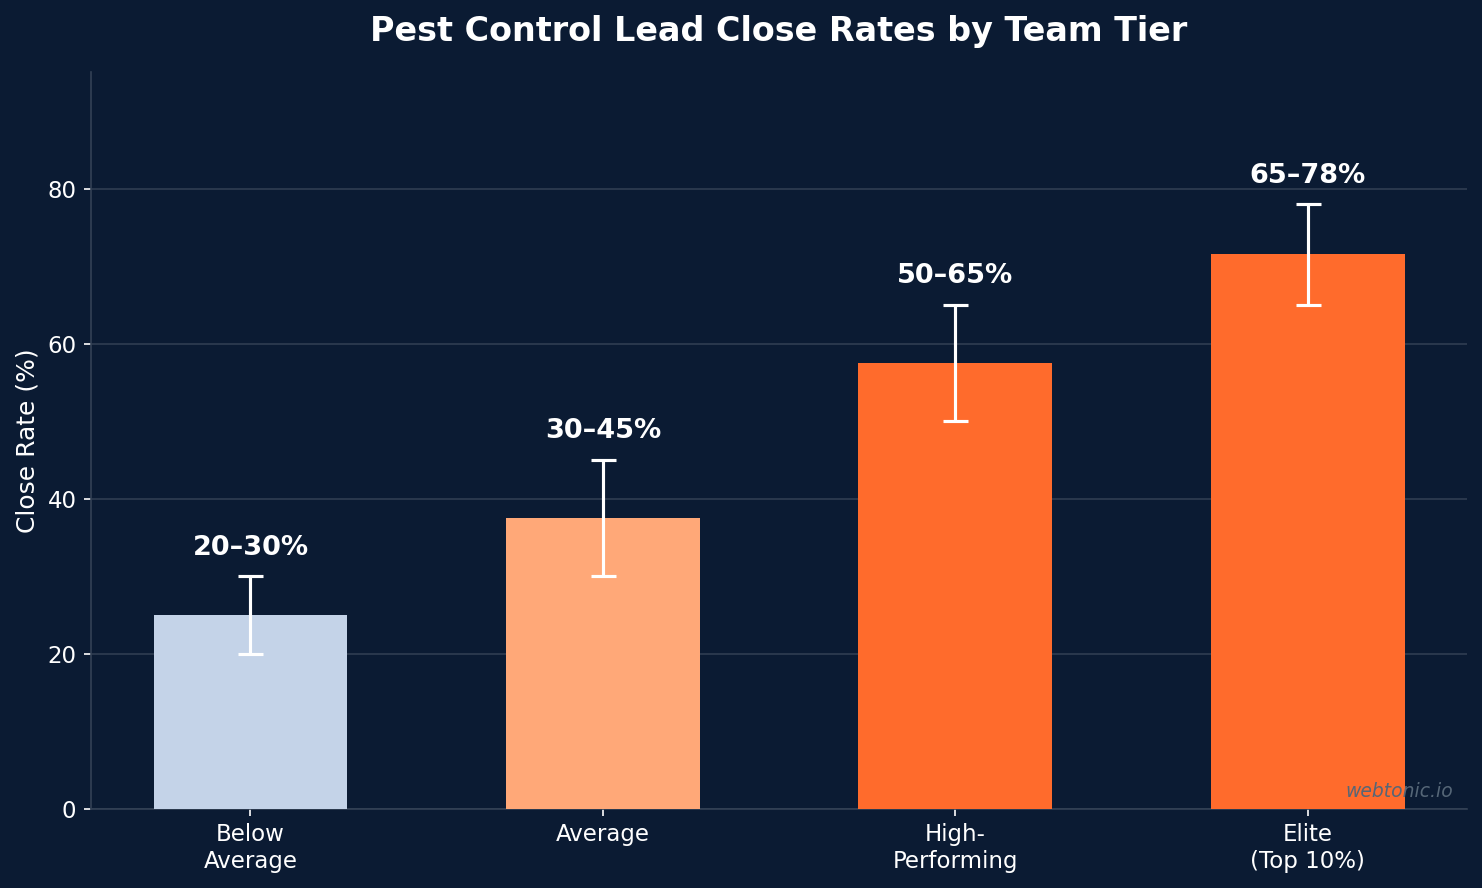
The most striking finding: companies self-report close rates of 55–75%, but actual call data shows the real number is typically 30–45%. The discrepancy comes from how "close rate" is defined — most CRM summaries count only leads that reached a quote stage, while actual call analysis includes every qualified inbound contact. Elite teams at 65%+ don't just have better scripts; they have faster response times, better call routing, and analytics systems that flag dropped calls before they become permanently lost revenue.
The Attribution Blind Spots Costing Pest Control Operators
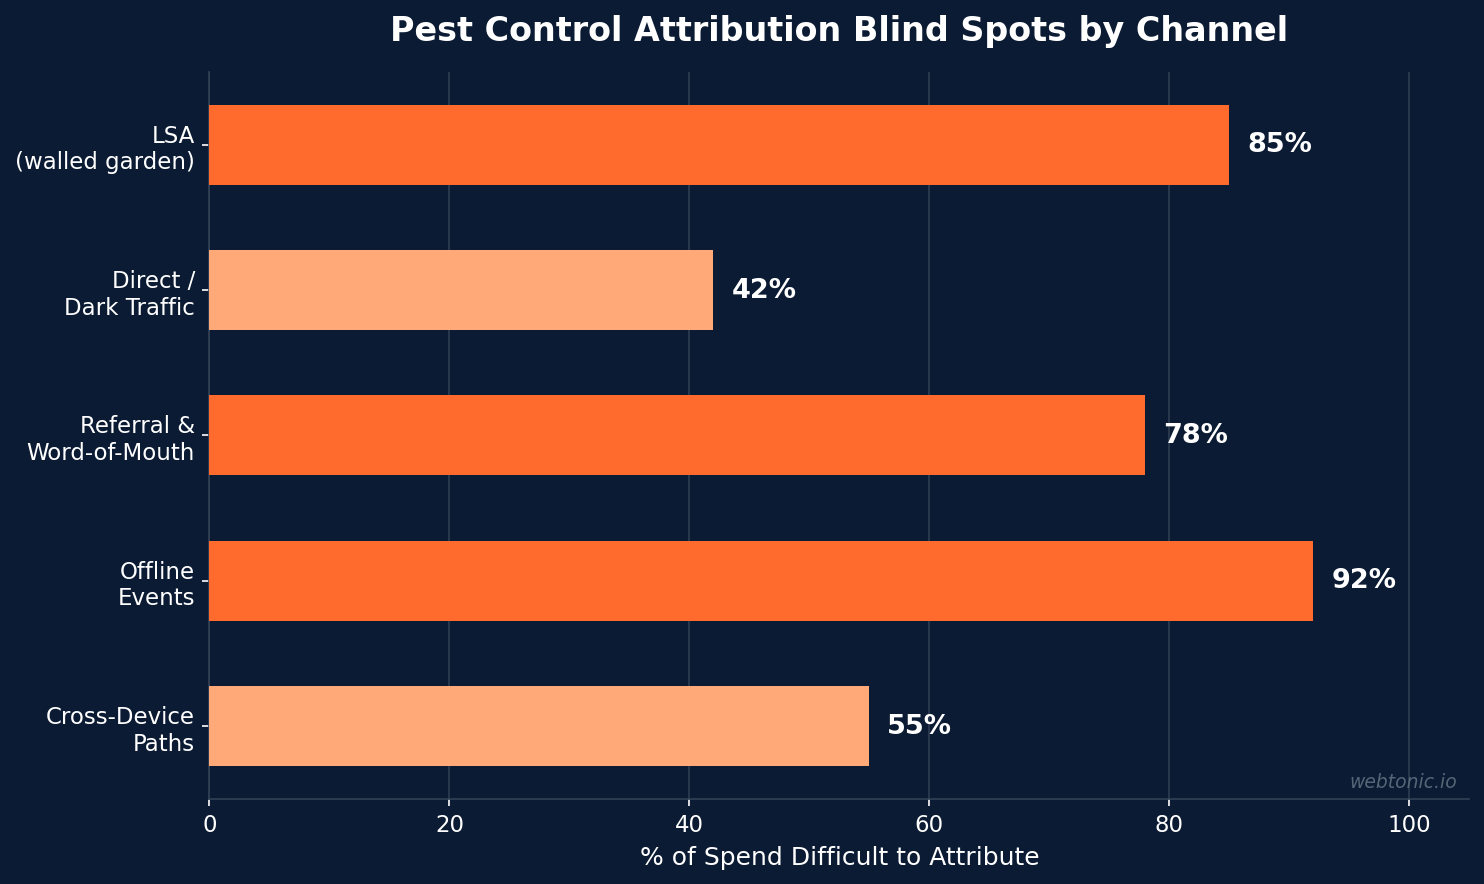
Mid-size pest control operators running $1M–$2.5M in revenue typically manage four or more marketing channels simultaneously: LSA, Google Ads, email, social, and referrals. Without proper attribution, operators routinely cut the channels that are working and double down on the ones that aren't. The two biggest blind spots are the LSA walled garden — where calls bypass the website entirely and never touch GA4 — and "direct" traffic in analytics, which hides the real source behind a catch-all label representing 30–40% of total sessions.
The fix for the LSA blind spot is straightforward: assign a dedicated tracking number exclusively to LSA that differs from every other channel. When that number rings, the lead came from LSA regardless of whether the caller ever visited the website. For "direct" traffic, dynamic number insertion on the website combined with UTM-tagged campaign URLs resolves most of the ambiguity within 30 days of implementation.
Essential KPIs for Pest Control Marketing
Operators who track the right metrics weekly separate growing companies from stagnant ones. Pest Badger's founder, running a $10M+ operation, checks his data dashboard ten times daily and attributes the company's growth directly to knowing every ad's cost and conversion rate in real time. Most pest control companies, by contrast, have no idea what their click-through rate, cost per conversion, or per-channel ROI actually looks like.
| KPI | Frequency | Benchmark | Why It Matters |
|---|---|---|---|
| Cost per Lead (CPL) | Weekly | $50–$200 (channel-dependent) | Identifies which channels waste budget |
| Close Rate | Weekly | 30–45% avg, 65%+ elite | Separates sales from marketing problems |
| Customer Acquisition Cost | Monthly | Varies by service tier | True cost including sales labor |
| Lead Response Time | Daily | Under 5 minutes ideal | 78% hire the first responder |
| After-Hours Call Capture | Weekly | 57% of calls are after-hours | Missed calls equal lost revenue |
| Revenue per Marketing Dollar | Monthly | 6x–7x for top performers | The only ROI metric that matters |
Call Tracking and After-Hours Analytics
57% of pest control calls happen after business hours according to MarketingLTB's industry analysis. For a company generating 200 inbound leads per month, that means 114 calls arrive when no one is answering unless after-hours capture is in place. Chatbots increase after-hours lead capture by 29%, but phone-based solutions — answering services, AI call handling, and smart voicemail — capture higher-intent leads who are calling because they have an active pest problem right now and cannot wait until morning for a callback.
Dynamic number insertion solves the parallel problem of channel attribution. By assigning unique tracking numbers to each marketing channel — Google Ads, LSA, organic landing pages, direct mail — operators can finally see which channel drove each call and match call outcomes to marketing spend at the campaign level. The investment is minimal: most call tracking platforms start at $45 per month for basic features including call recording, source tracking, and missed-call alerts that trigger automatic callback workflows.
Pest Control Software and Analytics ROI
Pest control software produces 2x–4x ROI for typical multi-truck operators through four measurable levers: office labor saved, revenue recovered from missed calls, cancellations prevented, and route density gains. The recovered-call and churn reduction levers usually dominate — AI-powered solutions report up to 30% fewer cancellations and approximately 25% more revenue compared to manual operations. The subscription cost, whether $49 per month or a six-figure enterprise platform, usually turns out to be the smallest number in the ROI calculation.
- Office labor saved: Hours eliminated from scheduling, follow-ups, reporting, and data entry multiplied by loaded hourly cost across 52 weeks.
- Recovered missed calls: After-hours and overflow calls captured multiplied by average job value and close rate.
- Churn prevention: Customers retained through automated reminders and proactive re-engagement multiplied by annual contract value.
- Route optimization: Additional stops per truck per day multiplied by average ticket size — a growth lever that compounds as the fleet scales.
The CRM Data Accuracy Problem
Self-reported metrics in pest control are consistently inflated. The Plaibook analysis found that most companies claim 55–75% close rates, but actual call recordings show 30–45%. The gap comes from three measurement errors:
- Denominator manipulation — excluding "bad leads" before calculating close rate inflates the number by 15–20 percentage points.
- Stage-gate bias — measuring only leads that reached the quote stage ignores everyone who dropped off during the initial phone call.
- Attribution double-counting — crediting the same closed deal to multiple channels simultaneously inflates every channel's apparent ROI.
The fix is straightforward but requires discipline: measure close rate as booked appointments divided by total qualified inbound calls, excluding only wrong numbers, vendor calls, and existing customer service requests. This gives operators the honest baseline they need to identify whether underperformance is a marketing problem or a sales problem — two issues that require completely different interventions.
The most disciplined operators schedule monthly "data audits" — a 30-minute review where they compare CRM-reported close rates against call recording samples. Even auditing just 20 calls per month catches the denominator inflation early and keeps the entire team accountable to accurate performance data rather than flattering but misleading summaries.
Website Analytics: Bounce Rate and Conversion Signals
The average pest control website has a 47% bounce rate — meaning nearly half of all visitors leave without taking any action. For paid traffic at $6.88 per click (home services CPC, up 22.6% year-over-year), every bounced visitor represents direct budget waste. Landing page conversion rates average 6–12% for pest control, meaning that even on well-optimized pages, 88–94% of visitors leave without converting. The gap between the 6% and 12% conversion rate — a 2x difference — typically comes down to page speed, mobile optimization, and the prominence of click-to-call buttons above the fold.
Pest control operators should track three website-level analytics weekly: bounce rate by traffic source (paid traffic bouncing above 55% signals a landing page or targeting mismatch), time on site by device type (mobile sessions under 30 seconds indicate page speed or UX issues), and conversion rate by landing page (identifying which pages convert at 12% versus which lag at 6% reveals exactly where to focus optimization effort).
Related reading
- Pest Control SMS Marketing Statistics, 2026
- Pest Control Email Marketing Statistics: Benchmarks & ROI Data (2026)
- Pest Control Marketing Attribution Statistics: The Phone-Call Blind Spot in 2026
- Marketing Analytics services at Web Tonic
Frequently Asked Questions
What is a good close rate for pest control sales?
Average pest control teams close 30–45% of qualified inbound leads. High-performing teams hit 50–65%, and elite operations in the top 10% exceed 65%. If your CRM shows a close rate above 60%, verify the denominator — most companies inadvertently exclude leads that dropped off early, inflating the reported number by 15–25 percentage points compared to actual call data.
How much does a pest control attribution stack cost?
A minimum viable attribution stack runs $30–$50 per month: Google Analytics 4 (free), a call tracking tool like CallRail ($45 per month for basic), a UTM spreadsheet (free), and CRM lead-source fields. Enterprise platforms with AI-powered attribution run $500–$2,000+ per month but are unnecessary until marketing spend exceeds $15,000–$20,000 monthly.
Why do pest control companies overestimate their close rates?
Three reasons: they exclude "bad leads" from the denominator, they measure only leads that reached the quote stage rather than all qualified inbound calls, and CRM entries often reflect what the rep logged rather than what the call recording captured. Independent call analysis consistently shows a 15–25 point gap between self-reported and actual close rates across the industry.
What percentage of pest control calls happen after hours?
57% of pest control calls happen outside standard business hours. This makes after-hours call capture — through answering services, AI call handling, or smart voicemail with callback workflows — one of the highest-ROI investments a pest control company can make. A company receiving 200 monthly leads loses up to 114 potential customers without proper after-hours coverage in place.
What KPIs should pest control companies track weekly?
The six essential weekly KPIs are cost per lead by channel, close rate (booked appointments divided by qualified calls), lead response time, after-hours call capture rate, revenue per marketing dollar, and customer acquisition cost. Companies tracking these metrics weekly grow faster because they catch underperforming channels within days rather than discovering problems months later in quarterly reviews.
Sources
Cube Creative — How Pest Control Owners Can Track Marketing ROI
Plaibook — Pest Control Close Rate Benchmarks from Real Call Data
Ardenus — Pest Control Software ROI: 2026 Framework
Pest Control Millionaires — Marketing KPIs That Matter
MarketingLTB — Pest Control Marketing Statistics 2026
BaaDigi — Pest Control Marketing Benchmarks 2026
PipelineOn — Home Service Marketing Benchmarks 2026


