Table of contents
Between 70% and 80% of pest control conversions arrive by phone, and the person labelling them is a customer service representative guessing between routes. That is the whole attribution problem in one sentence.
Key Takeaways
- 70–80% of pest control conversions happen by phone, not by web form.
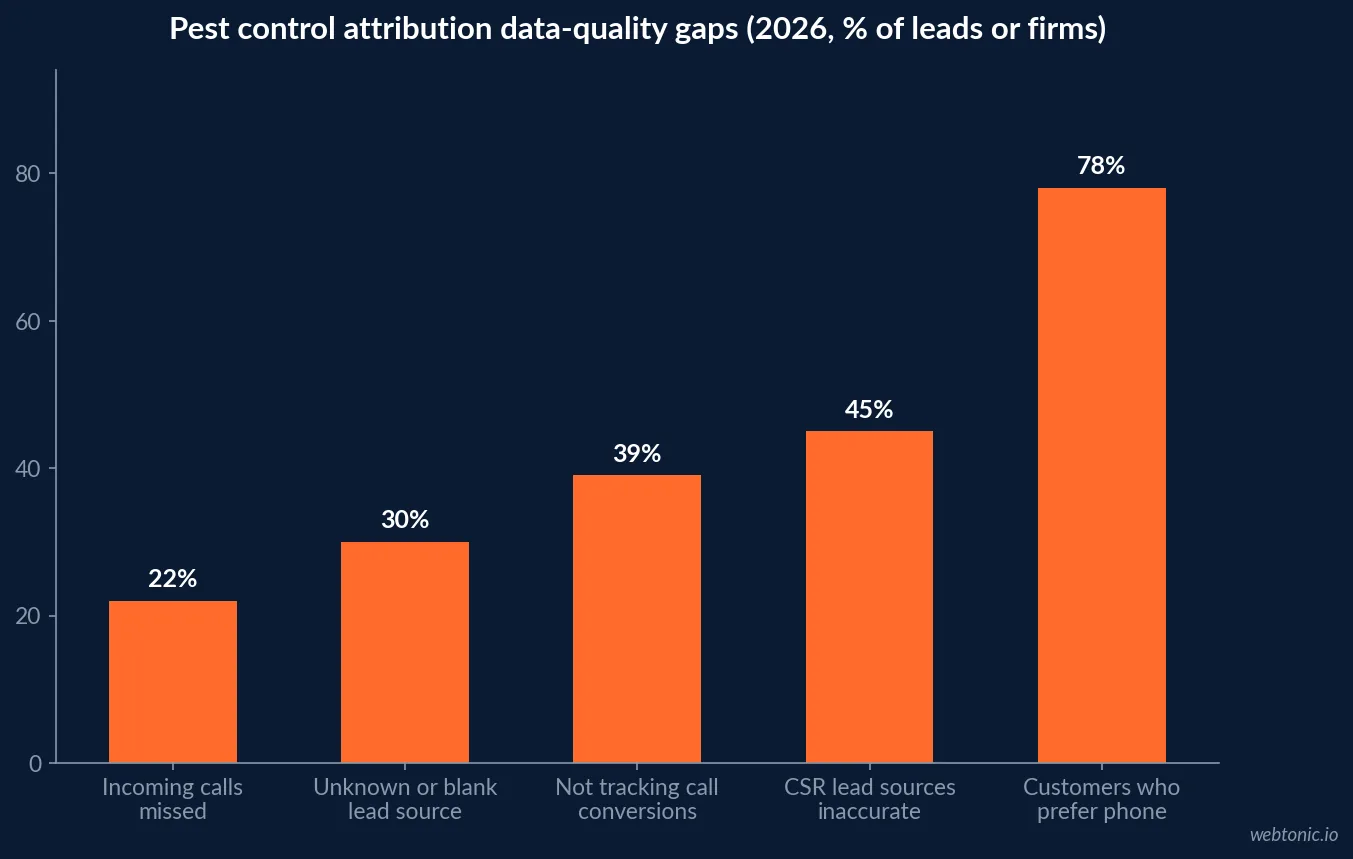
- 78% of pest control customers prefer calling over online booking.
- CSR-reported lead sources are inaccurate 30–50% of the time.
- 39% of businesses fail to track call conversions at all.
- Call tracking improves marketing ROI accuracy by roughly 38%.
- Auto-tagging can lift attribution accuracy from 40–50% to over 90%.
- Home service customers touch 3–7 channels before calling.
- Multi-touch attribution adoption sits at 47%, last-touch at 41%.
- Hybrid multi-touch plus marketing mix modelling is used by 33% of teams.
- Marketing mix modelling adoption tripled from 9% in 2023 to 26%.
- 7% of teams still run no formal attribution model.
- The unattributable “dark funnel” averages 38% of pipeline.
- Cutting awareness spend can drop search leads 30–60 days later.
- “Other” or unknown lead sources represent 20–40% of leads in many CRMs.
- A one-time pest control caller is worth $225; a plan customer is worth $1,620 over three years.
- 70–85% of pest control revenue comes from recurring agreements.
- 55% of pest control calls arrive outside business hours.
- The average pest control business misses 22% of incoming calls.
- 67% of callers will not leave a voicemail.
- Responding within five minutes makes contact 100x more likely.
The Conversion Happens on the Phone
Attribution in this category breaks at the first step, because the conversion is a voice call that no analytics tag can see. Between 60% and 80% of home services leads arrive by phone rather than by web form, so a business measuring only form submissions in analytics is missing the majority of its revenue. In pest control specifically the skew is at the top of that range.
| Channel behaviour | Figure | Attribution consequence |
|---|---|---|
| Pest control conversions by phone | 70–80% | Form-only tracking sees a minority of revenue |
| Customers preferring phone to online booking | 78% | Booking widgets will not close the gap |
| Calls arriving outside business hours | 55% | After-hours source data is often never captured |
| Weekend share of weekly call volume | 35% | Weekday-only tagging skews the mix |
| Calls missed by the average business | 22% | Missed calls are invisible in every report |
| Callers who will not leave a voicemail | 67% | The lead disappears without a trace |
| Businesses not tracking call conversions | 39% | No source data exists to model |
The seasonal spike makes it worse. Spring call volume rises by 47%, summer runs 40% above winter, and emergency calls peak between 6 PM and 9 PM — precisely when the office is closed and the source of the call is least likely to be recorded correctly. April to September attribution data is systematically dirtier than the rest of the year.
Hand-Typed Lead Sources Are Wrong Half the Time
The default fix — asking “how did you hear about us?” — is the largest data quality problem in the trade. CSR-reported lead sources are inaccurate 30–50% of the time, and “other” or unknown entries represent 20–40% of all leads in many CRM implementations. Budget decisions worth thousands a month are being made on data that is wrong nearly half the time.
| Failure | Scale | Who gets over- or under-credited |
|---|---|---|
| CSR mis-tags the source | 30–50% of records | Google over-credited |
| “Other” or blank source field | 20–40% of leads | Everything under-credited |
| Customer answers “Google” by habit | Most branded searches | Social, mail, signage zeroed |
| One source stored per job | Every single-field CRM | 3–7 touchpoints reduced to one |
| Missed call never enters the CRM | 22% of calls | Channel that produced it looks weak |
| No UTM discipline on campaign links | Common | Paid social attributed to direct |
The mechanism is predictable. A homeowner sees a wrapped truck, gets a spring postcard, reads Google reviews, then searches the company name and calls. The customer says “Google” because Google was the last thing they touched. Search captured demand that signage and mail created, and the report says signage and mail produced nothing.
Why Google Looks Like the Only Channel That Works
Last-click logic guarantees this outcome. Home service customers interact with 3–7 touchpoints before calling; a single-source CRM field can credit exactly one. Awareness channels are structurally under-credited and capture channels structurally over-credited, so the report always recommends cutting the top of the funnel.
The consequence is measurable and delayed: contractors who switch off awareness spend often watch search lead volume fall 30–60 days later, having removed the demand that search was harvesting. In a seasonal trade that lag lands exactly one month into peak season.
| Touchpoint | Role in the journey | Typical credit under last-click |
|---|---|---|
| Vehicle wrap / yard sign | Neighbourhood awareness | None |
| Direct mail postcard | Seasonal trigger | None |
| Paid social | Demand creation | Minimal |
| Google reviews / profile | Trust and shortlisting | Partial |
| Branded search | Navigation to the phone number | All of it |
| Local Services Ads | Capture with a badge | All of it, when clicked last |
| Referral from a neighbour | Strongest single driver | Recorded as “Google” |
What Attribution Models Teams Actually Run
Model adoption has moved, and it has moved toward running two models at once. Multi-touch attribution sits at 47% adoption against last-touch at 41%, hybrid multi-touch plus marketing mix modelling at 33%, marketing mix modelling at 26% — tripled from 9% in 2023 — and 7% of teams with no formal model at all, across more than 1,200 surveyed teams.
| Model | Adoption | Fit for a pest control operator |
|---|---|---|
| Multi-touch attribution | 47% | Useful above roughly $15k monthly spend |
| Last-touch attribution | 41% | The default that causes the problem |
| Hybrid multi-touch + mix modelling | 33% | Multi-market and franchise groups only |
| Marketing mix modelling | 26% | Needs 2–3 years of clean spend data |
| First-touch attribution | 19% | Good sanity check on awareness channels |
| Custom rules-based | 18% | Where most home services CRMs land |
| No formal model | 7% | Platform-reported numbers only |
Two cautions apply before a single-market operator buys a model. The unattributable share of pipeline averages 38% even in well-instrumented programmes, so the goal is to shrink the gap, not close it. And a model applied on top of hand-typed source data simply distributes the same errors across more channels. Fix the input first; that sequencing is the core of our data intelligence work.
Measure Plans, Not First Treatments
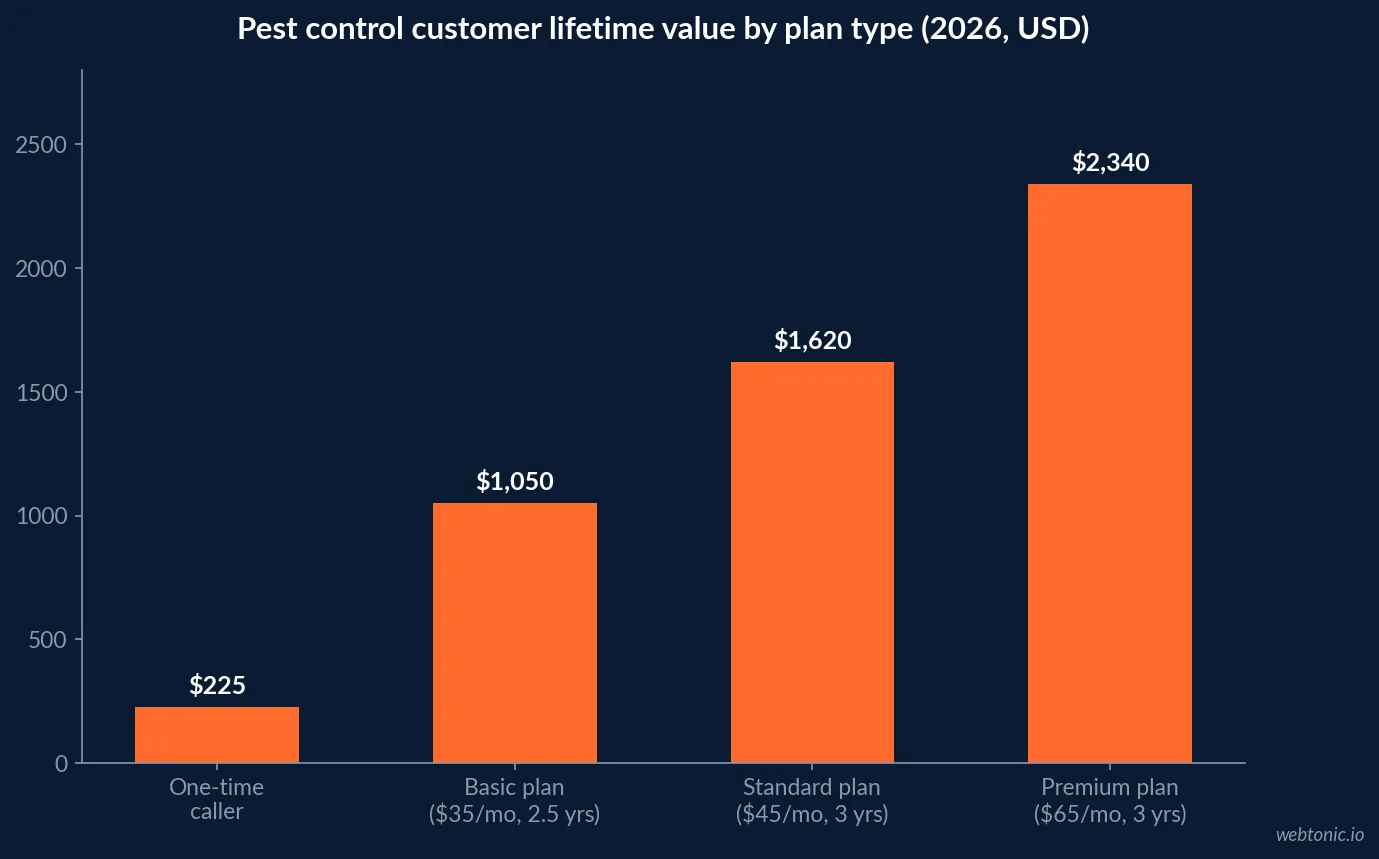
Even perfect source data misleads when the conversion event is wrong. A one-time pest control caller is worth $225 in lifetime value while a recurring plan customer at $45 a month is worth $1,620 over three years, and 70–85% of pest control revenue comes from monthly or quarterly agreements. A channel that produces cheap one-time sprays and never converts to a plan loses money at any cost per lead.
| Metric | Value | Why it beats cost per lead |
|---|---|---|
| One-time caller lifetime value | $225 | The number most reports optimise toward |
| Recurring plan value (3 years, $45/mo) | $1,620 | 7.2x the one-time customer |
| Premium plan value (3 years, $65/mo) | $2,340 | Same acquisition cost, higher return |
| Commercial contract (3 years, $800/mo) | $28,800 | Justifies long-cycle spend |
| Recurring share of revenue | 70–85% | The KPI attribution should track |
| Break-even CPL for a one-time customer | ~$52 | Channels fail only if plans never convert |
The reporting change this implies is small and rarely made: add a plan-conversion field to every lead record and report cost per recurring plan alongside cost per lead. Channels reorder immediately, because the sources that produce panicked one-off wasp calls are not the sources that produce preventive-plan buyers.
Speed Is an Attribution Problem Too
A lead that is never contacted looks identical in a report to a channel that produced nothing. Responding within five minutes makes contact 100x more likely and qualification 21x more likely than waiting 30 minutes, and the average home services contractor loses more than $21,000 a month — over $260,000 a year — to missed calls and slow follow-up.
Layer that onto the phone data and the size of the reporting distortion becomes clear. If 22% of calls are missed and 67% of those callers leave no voicemail, roughly one in seven purchased leads never enters the system at all. The channel that produced them is penalised in the next budget review for a failure that happened in the front office.
Fixes are operational, not analytical: missed-call text-back, an after-hours answering service for the 55% of calls that arrive outside office hours, and a rule that every inbound number is a tracking number. Answered-call rate belongs on the marketing dashboard, not just the operations one — an argument we make in most growth marketing engagements. In paid search specifically, a call-first measurement setup separates a channel that looks expensive from one that is.
The Stack That Fixes It
None of this requires replacing the field service platform. It requires a layer that stitches call data, ad platform data and booked revenue together, so the source field is populated automatically rather than remembered by a CSR mid-call. Industry KPI guidance is blunt about the return: auto-tagging through call tracking and required CRM fields moves attribution accuracy from 40–50% to more than 90%.
| Layer | What it captures | Priority |
|---|---|---|
| Dynamic call tracking numbers | Source of every inbound call | 1 — highest return |
| Required CRM source field | No blank or “other” records | 2 — free to implement |
| UTM parameters on all links | Digital campaign detail | 3 |
| Plan-conversion flag | Recurring versus one-time | 4 — changes channel ranking |
| Offline conversion import | Booked revenue back to the ad platform | 5 |
| Answered-call rate reporting | Leads lost in the front office | 6 |
| Multi-touch or mix model | Credit across 3–7 touchpoints | 7 — only after 1–6 |
Sequencing matters more than tooling. Call tracking alone improves marketing ROI accuracy by about 38%, while 39% of businesses still do not track call conversions and 57% of pest control calls arrive after business hours. Steps one and two capture most of the available accuracy for a few hundred dollars a month.
A Reporting Cadence That Survives Seasonality
Pest control demand swings by 40–47% between seasons, which makes month-over-month channel comparisons close to meaningless. Compare like periods year over year, and judge in-season decisions on weekly answered-call and plan-conversion data instead.
A defensible cadence looks like this: weekly on answered calls, booked jobs and plan conversions; monthly on cost per plan by channel with the unknown bucket reported as its own line; quarterly on budget reallocation using year-over-year comparisons only. The unknown bucket is the single best health metric in the whole report — if it exceeds 10% of leads, tagging is broken and every other number is provisional.
None of this is exotic analytics. It is a tracking number on every campaign, a mandatory source field, a plan flag and an honest unknown column. Get those four in place and the 30–50% error rate collapses; skip them and no attribution model will rescue the data. If it would help to have someone audit the current setup, get in touch.
Frequently Asked Questions
Why is attribution harder in pest control than in e-commerce?
Because the conversion is a phone call and the revenue is a subscription. 78% of pest control customers prefer to call rather than book online, 70–80% of conversions in the category happen by phone, and the value of the customer is a $1,620 three-year plan rather than the first treatment. Web analytics alone sees almost none of that.
How wrong is CSR-reported lead source data?
Research across home service businesses puts CSR-reported lead sources wrong 30–50% of the time, and separate industry data finds 39% of businesses do not track call conversions at all. Auto-tagging through call tracking and required CRM fields can push attribution accuracy from 40–50% to over 90%.
What attribution model should a pest control company use?
A layered one. Across surveyed teams, multi-touch attribution sits at 47% adoption, last-touch at 41%, hybrid multi-touch plus marketing mix modelling at 33%, and 7% run no formal model. For a single-market operator, call tracking plus disciplined CRM source fields delivers most of the value before any model choice matters.
Why does last-click attribution over-credit Google in pest control?
Because Google is where the journey ends. Customers touch 3–7 marketing channels before calling, then search the company name as the final step, so a CRM that stores one source per job credits Google and zeroes everything else. Contractors who cut awareness spend on that basis often see search leads fall 30–60 days later.
What should pest control marketers measure instead of cost per lead?
Cost per recurring plan. 70–85% of pest control revenue comes from monthly or quarterly agreements, and a one-time caller worth $225 becomes worth $1,620 over three years on a $45-a-month plan. Channels should be judged on plan conversion, not on the price of the first spray.
Sources
Skillmammoth — Marketing Attribution for Home Service Contractors
Rivet Ops — Why CRM Reports Don't Match Reality
Digital Applied — Marketing Attribution Statistics 2026
AgentZap — Pest Control Phone Statistics 2026
Cube Creative — Pest Control Phone-to-Close Workflow
PipelineOn — Pest Control Digital Marketing 2026
Marketing LTB — Pest Control Marketing Statistics 2026
CallRail — Home Services Marketing Statistics