



Table of contents
Before/after video ads achieve a 3.7% click-through rate for pest control companies — more than double the static image average of 1.6%. The creative you run determines whether a homeowner calls you or scrolls past. Below are the ad creative benchmarks, format comparisons, and testing frameworks that separate high-performing pest control advertisers from the rest of the pack.
Key Takeaways
- Before/after treatment videos deliver 3.7% CTR — 131% higher than static images at 1.6% (AQuality Pest, 147 ad variations tested).
- Iterative creative testing reduced CPL from $71 to $28 over six months — a 61% cost reduction through systematic variant optimization.
- Headlines capture 80% of a pest control ad's performance — the right hook wins most of the click before body copy registers.
- UGC-style testimonials hit 2.9% CTR — outperforming polished static ads while building trust with skeptical homeowners.
- Safety-first messaging (pet-safe, kid-safe) converts 67% more qualified leads than price-led hooks in pest control verticals.
- Five distinct creative angles prevent ad fatigue — rotating speed/relief, safety, DIY comparison, testimonial, and first-treatment offer hooks.
Pest Control Ad Creative Benchmarks at a Glance
| Metric | Benchmark | Source |
|---|---|---|
| Average display CTR — home services | 0.80% | WordStream / LocaliQ 2025 |
| Before/after video CTR — pest control | 3.7% | AQuality Pest, 147 variants tested |
| UGC testimonial CTR | 2.9% | AQuality Pest case study |
| Static image CTR | 1.6% | AQuality Pest case study |
| Store-spray comparison ad CTR | 3.1% | Zendux AI creative framework |
| Seasonal carousel CTR | 2.4% | AQuality Pest case study |
| CPL after 6 months of testing | $28 | AQuality Pest — BugShield case |
| Lead quality improvement (safety messaging) | +67% | AQuality Pest, BugShield case |
| Headline contribution to performance | 80% | Pest Control Millionaires |
Click-Through Rates by Ad Format
Format selection is the single largest lever in pest control ad creative performance. Analysis of 147 ad variations across a multi-location pest control brand reveals sharp differences between visual formats. Before/after treatment videos led at 3.7% CTR, followed by comparison-style creatives at 3.1% and UGC testimonials at 2.9%. Static single-image ads trailed at 1.6%. The gap reflects how homeowners process pest-related content — video proves the infestation is gone, while static images can only promise it.
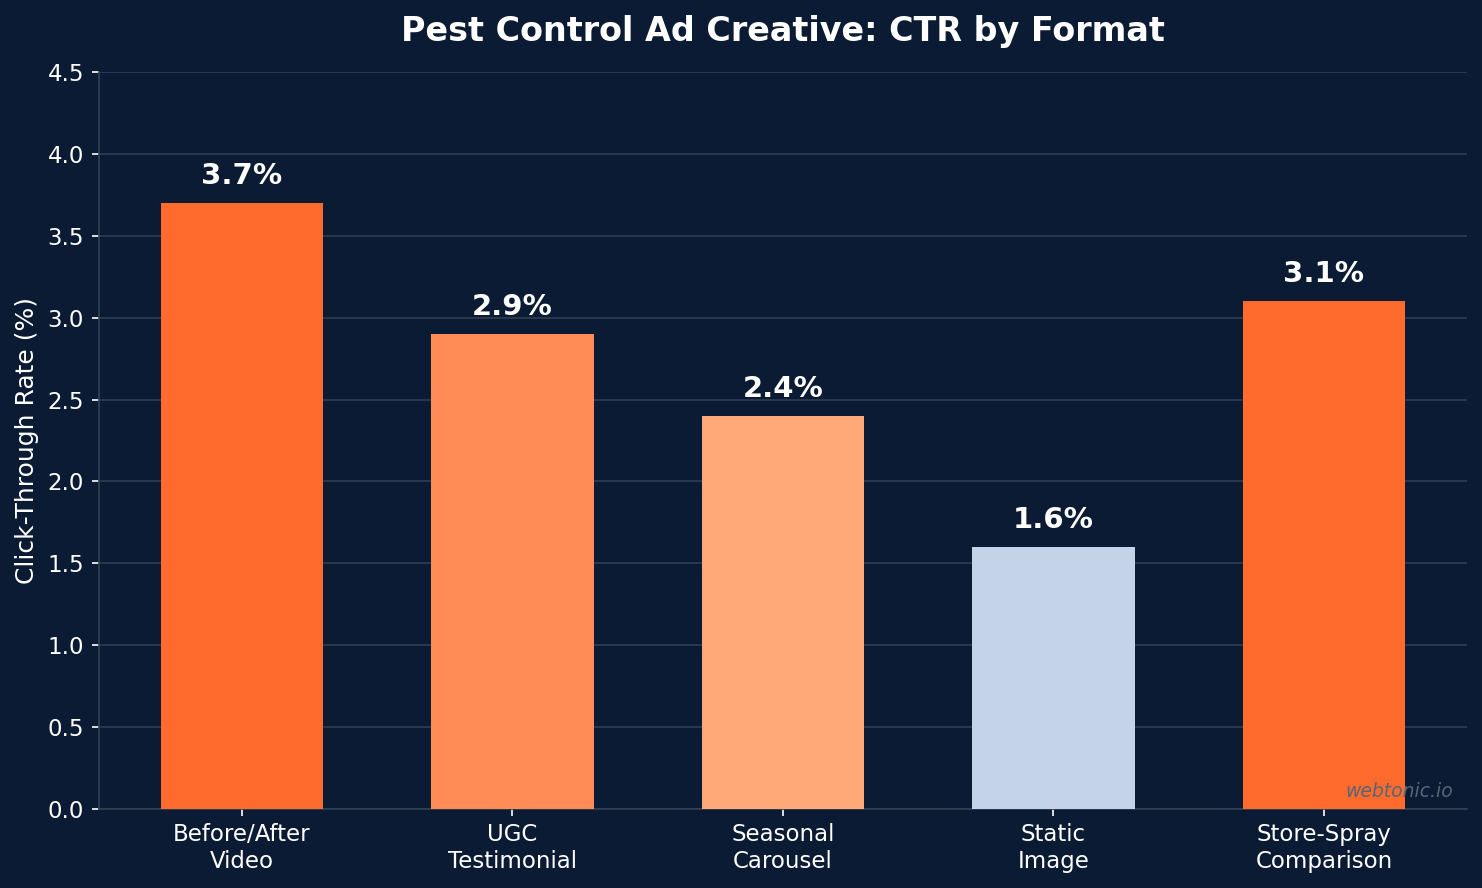
Store-spray comparison ads perform nearly as well at 3.1% because they address the DIY failure that drove the search in the first place. Most homeowners calling a pest control company have already tried over-the-counter solutions and watched them fail. Creative that acknowledges this frustration — showing a can of store spray next to professional-grade results — validates the homeowner's experience and positions the operator as the obvious next step.
Ad Copy Elements That Drive Conversions
Your headline is 80% of the battle in pest control advertising. The body copy, extensions, and landing page matter — but if the headline doesn't grab attention in a mobile-first feed, nothing else gets seen. Winning pest control headlines share three consistent patterns across high-performing campaigns:
- Specificity over cleverness — "Same-Day Ant Removal — Licensed & Insured" outperforms generic "Pest Control Services" by wide margins in testing.
- Speed of relief — "Gone in One Visit" or "24-Hour Response" directly addresses the urgency driving the search query.
- Safety reassurance — "Pet-Safe, Kid-Safe Treatments" answers the second question every homeowner asks right after "can you fix this?"
Google Ads specifically rewards this approach: responsive search ads with multiple headline variations let the algorithm test dozens of combinations against real user behavior. The best pest control advertisers load 12–15 headline variants covering speed, safety, pest type, and offer angle, then let automated testing surface the winners rather than relying on intuition about which messages will resonate with their local audience.
The Creative Testing Framework That Cut CPL 61%
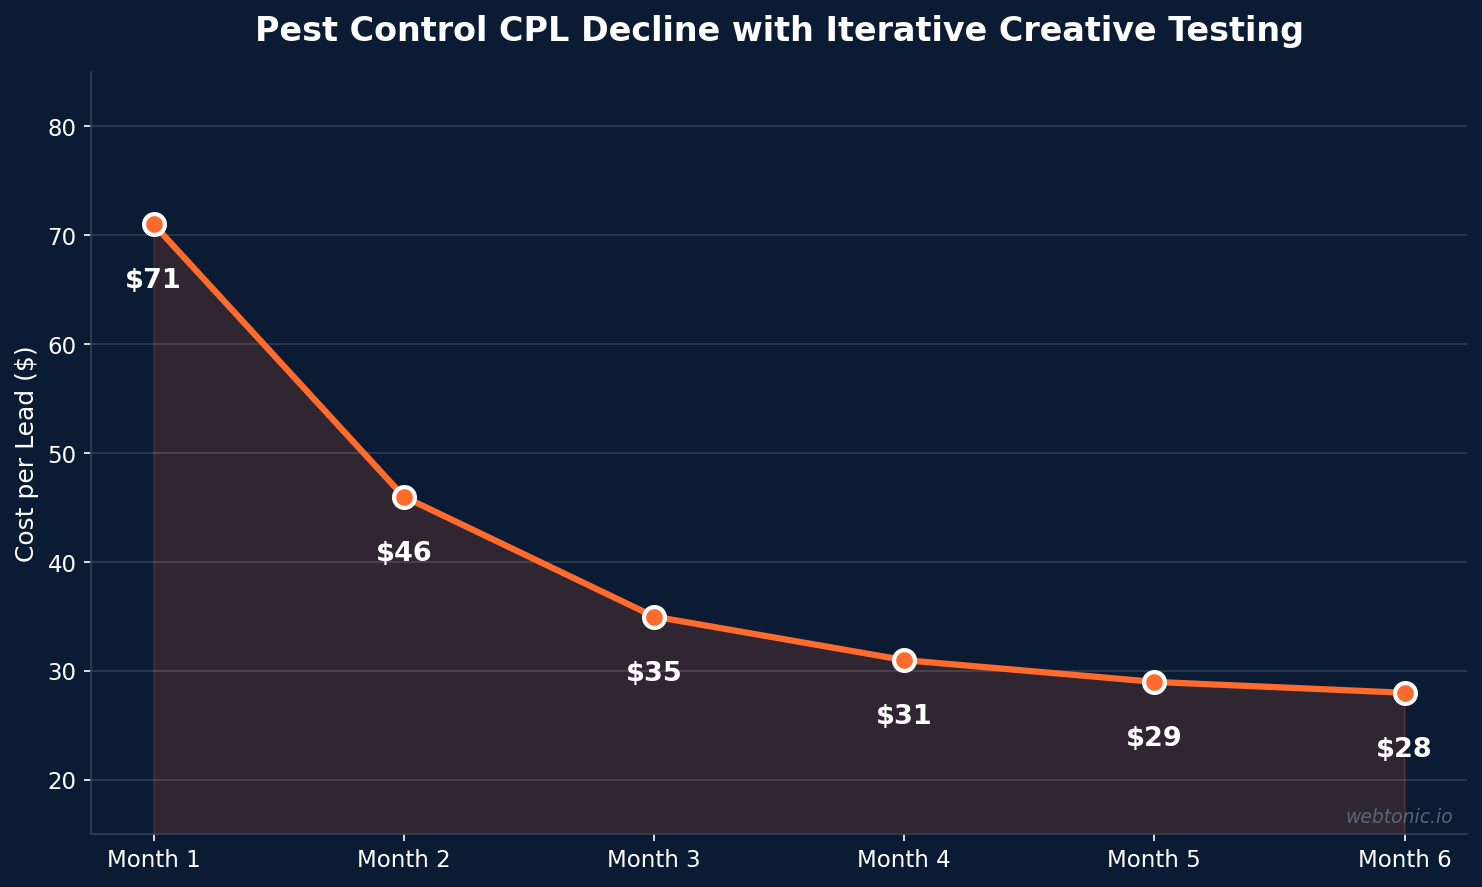
Systematic creative testing is the difference between a $71 cost per lead and a $28 one. The BugShield Defense case study documented this decline across six months of iterative optimization, testing new creative variants weekly while killing underperformers quickly. The sharpest CPL drops came in months two and three, when the team identified the winning hook structure and began testing variations within that framework rather than starting from scratch each cycle. By month six, the cost per lead stabilized at $28, with a 5.4x ROAS that justified continued scaling of the ad budget.
The testing methodology followed a structured hierarchy: first test the creative format (video vs. static vs. carousel), then the message angle (speed, safety, price, social proof), then the specific hook within the winning angle. This layered approach isolated which variable drove the improvement, preventing the common trap of changing everything simultaneously and learning nothing from the experiment.
Five Creative Angles Every Pest Control Advertiser Needs
Running five distinct creative angles prevents ad fatigue and lets platforms match each concept to the right audience segment. Each angle speaks to a different homeowner mindset — from the panicked emergency caller to the prevention-minded planner.
| Angle | Format | Funnel Stage | Best For |
|---|---|---|---|
| Speed / Relief | Before/after video | Cold — reactive | Active infestations, emergency calls |
| Trust / Safety | Service hero image | Cold / warm | Family-focused positioning |
| DIY Comparison | Side-by-side comparison | Warm — frustrated | Converting store-spray failures |
| Social Proof | UGC testimonial | Warm / hot | Building credibility, review-driven |
| First-Treatment Offer | Static with CTA overlay | Hot — price-comparing | Booking fence-sitters, new customers |
Platform-Specific Creative Performance
Ad creative rules differ significantly between Google Ads and Meta Ads for pest control companies. Google's search ads are text-driven — headlines and descriptions carry the conversion weight, with responsive search ads testing up to 15 headline combinations automatically. Meta's visual-first environment rewards video and carousel formats, where the hook must land in the first three seconds before the thumb scrolls past.
| Platform | Top Format | Avg. CTR | Key Creative Rule |
|---|---|---|---|
| Google Search | Responsive Search Ads | 3.5–5.2% | Headline specificity + extensions |
| Google LSA | Review-driven listing | N/A (call-based) | Star rating + response time |
| Meta (Facebook/IG) | Before/after video | 2.9–3.7% | 3-second hook + safety message |
| YouTube | Problem-solution pre-roll | 0.5–1.2% | Show pest in 2 sec, solution in 5 |
Seasonal Creative Rotation and Ad Fatigue
Seasonal landing pages outperform general pages by 41% in pest control according to MarketingLTB's 93-stat analysis. Ad creative should follow the same seasonal cadence. Spring ant and termite campaigns, summer mosquito and wasp hooks, fall rodent prevention, and winter wildlife exclusion each demand different visuals, copy angles, and urgency levels. Operators running the same general pest control creative year-round leave significant performance on the table because seasonal specificity is what makes the ad feel relevant at the exact moment a homeowner notices a problem.
Ad fatigue sets in faster in pest control than in most home services verticals because the audience is narrow and geographically concentrated. Frequency caps of 2–3 impressions per week and fresh creative every 3–4 weeks prevent the performance cliff that hits when the same homeowners see the same ad repeatedly. The best operators maintain a library of 15–20 active variants, rotating 4–5 into each campaign at any given time so that even repeat viewers see a different angle or offer.
The operators who maintain a dedicated seasonal creative calendar — with launch dates, refresh dates, and retirement dates for each campaign — consistently outperform those who create seasonal ads reactively when they notice a dip in performance. Planning seasonal creative 4–6 weeks ahead ensures assets are ready before demand spikes.
Matching Creative to Audience Segments
Not every homeowner responds to the same message. Emergency callers — people dealing with an active infestation right now — respond to speed and relief hooks. Prevention buyers — homeowners looking for quarterly service plans — respond to safety, family protection, and long-term value messaging. And price shoppers — homeowners comparing multiple quotes — respond to concrete offers and social proof that justifies the investment over a cheaper competitor or a do-it-yourself approach from a hardware store.
The most effective pest control advertisers segment their creative libraries by these three buyer types and serve different ads to each group. Performance creative strategies that align message to mindset consistently outperform one-size-fits-all campaigns, generating higher CTR, better lead quality, and lower cost per acquisition across all three segments simultaneously.
Ad Creative Best Practices for Pest Control
- Lead with the result, not the process — show the pest-free home, not the sprayer. Transformation imagery outperforms treatment footage consistently.
- Avoid gratuitous pest imagery — close-ups of roaches and spiders repel viewers and risk platform content policy violations on Meta and Google.
- Include a concrete offer — "Free Inspection" or "$50 Off First Treatment" gives the click a reason. Generic "Call Now" underperforms offer-led CTAs by 30–40%.
- Test one variable at a time — isolate headline vs. image vs. offer to identify which element drives the lift.
- Use location-specific creative — geo-targeted ads increase CTR by 29%, and city-name insertion in headlines makes the ad feel local.
- Track creative-level ROAS, not just CTR — a 3.7% CTR means nothing if those clicks don't convert to booked jobs. Tie creative variants to downstream revenue attribution.
Related reading
- What Real Estate Ad Creatives Drive Buyer Leads?
- What Home Remodeling Ad Creatives Convert Best?
- Insurance Ad Creative Benchmarks and Performance Trends
- Branding services at Web Tonic
Frequently Asked Questions
What ad format works best for pest control companies?
Before/after treatment videos consistently deliver the highest click-through rates at 3.7%, followed by DIY-comparison creatives at 3.1% and UGC testimonials at 2.9%. Static images trail at 1.6%. The visual proof of a resolved infestation builds more trust than any text-based promise, which is why video formats dominate across both Meta and YouTube placements.
How often should pest control companies refresh their ad creative?
Every 3–4 weeks for Meta and display placements, and whenever Google Ads responsive search ad asset scores drop from "Best" to "Good" or "Low." Pest control audiences are geographically narrow, so fatigue hits faster than in broader consumer categories. Maintain 15–20 creative variants in rotation and introduce 2–3 new variants every testing cycle.
Does safety messaging really outperform price-led ads?
Yes. Safety-first hooks like "Pet-Safe, Kid-Safe Treatments" improved lead quality by 67% compared to price-led messaging in documented A/B tests. Price shoppers tend to churn faster and compare more aggressively, while safety-motivated homeowners convert to recurring quarterly service plans at higher rates.
How many ad variations should a pest control company test?
Start with five distinct creative angles — speed/relief, trust/safety, DIY comparison, social proof, and a first-treatment offer. Within each angle, test 3–4 headline and image variations. The BugShield case study tested 147 variants over six months before finding the optimal combination, but the biggest CPL gains came within the first 50 tests.
What is a good CTR for pest control ads?
The home services display average is 0.80%. For pest control search ads, 3.5–5.2% is competitive. On Meta, anything above 2.5% indicates strong creative-audience fit. Top-performing video creatives reach 3.7%, but CTR should always be evaluated alongside conversion rate and cost per lead — a high CTR that attracts unqualified clicks wastes budget rather than growing it.
Sources
AQuality Pest — BugShield Defense Case Study (147 ad variants)
Pest Control Millionaires — Google Ads Copy: Headlines Win 80%
Zendux AI — Pest Control Ad Examples: 5 Ads That Book Treatments
MarketingLTB — Pest Control Marketing Statistics 2026 (93+ Stats)
WordStream / LocaliQ — Google Ads Industry Benchmarks
Cube Creative — Pest Control Marketing Spend by Company Size
PipelineOn — Home Service Marketing Benchmarks 2026


