Table of contents

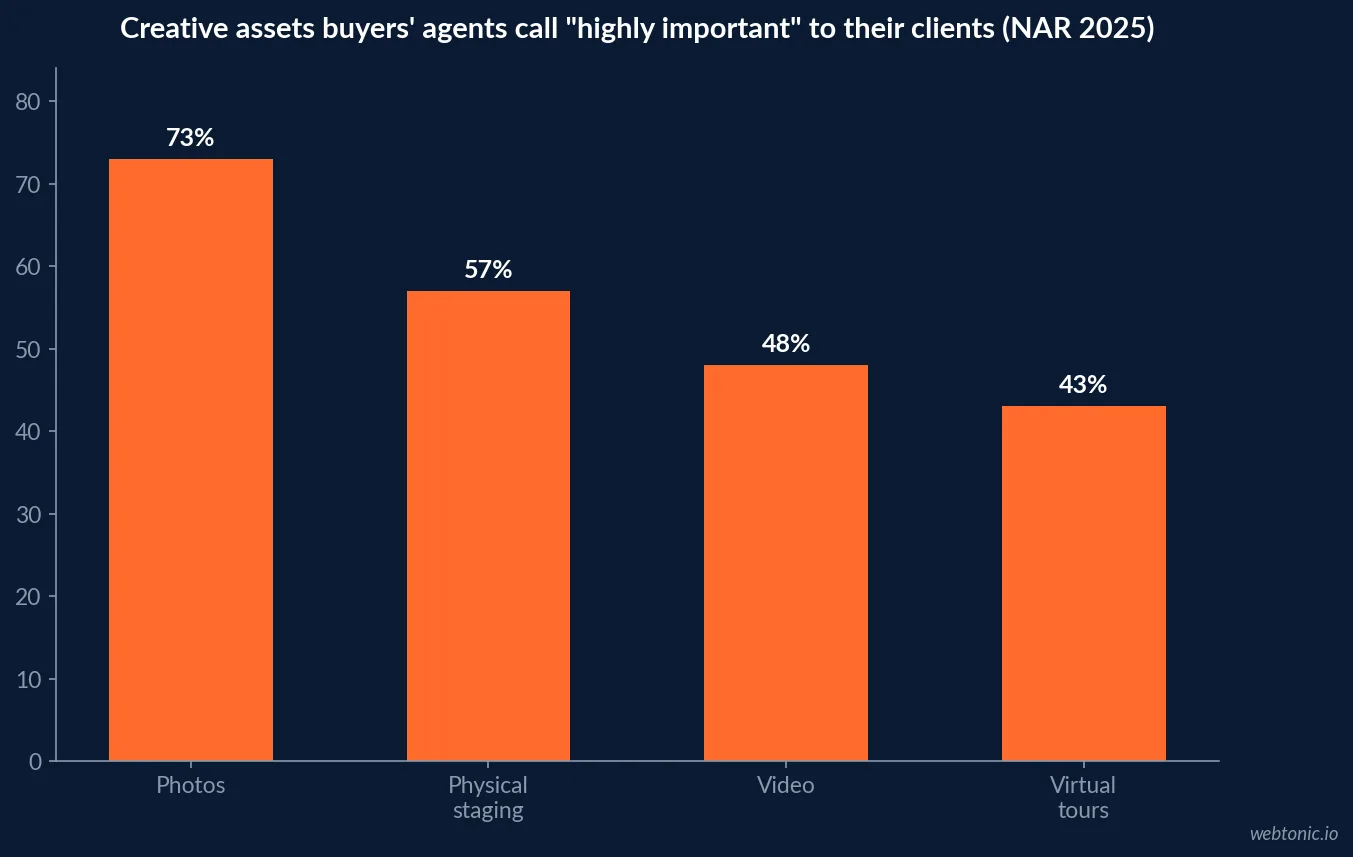
Photos beat every other listing creative asset on both sides of a real estate deal: 73% of buyers' agents and 88% of sellers' agents call them highly important to their clients, according to NAR's own 2025 Profile of Home Staging. This page ranks real estate ad creative by what agents' clients actually respond to - photos, staging, video, virtual tours and drone footage - using NAR's 2025-2026 surveys, and flags the one number in this niche that is repeated everywhere and traceable nowhere.
Key Takeaways
- 88% of sellers' agents call listing photos more or much more important to their clients than other creative.
- 73% of buyers' agents call photos highly important to their clients.
- 57% of buyers' agents rate physical staging highly important; 43% for sellers' agents.
- Video is rated highly important by 47-48% of agents on both sides.
- Virtual tours are rated highly important by 43% of buyers' agents.
- 48% of REALTORS use drone photography or video in 2026.
- 29% use virtual tours as a standard tool.
- 32% use social media scheduling/content tools for listing promotion.
- 26% maintain a personal website with IDX listings.
- Median professional staging cost is USD 1,500, against USD 500 self-staged.
- 17% of buyers' agents saw a 1-5% higher offer on staged versus unstaged comparable homes.
- 91% of sellers' agents stage the living room first; 83% the primary bedroom.
- The "403% more inquiries" video claim traces to no NAR or Zillow study - it is not used here.
- 52% of real estate businesses implemented paid social creative in the past year.
- 49% implemented email creative; 48% implemented video.
- 75% of agents using AI apply it to listing descriptions, the top AI creative use case.
- 56% apply AI to social media posts tied to listings.
Photos still win, by a wide margin
NAR's 2025 Profile of Home Staging, drawn from a February 2025 survey of REALTORS, asked agents directly how important each creative element was to their own clients - not to agents' opinions of good marketing, but to what buyers and sellers reacted to. Photos led every category on both sides of the transaction:
| Creative asset | Buyers' agents: highly important to clients | Sellers' agents: more/much more important |
|---|---|---|
| Photos | 73% | 88% |
| Physical staging | 57% | 43% |
| Video | 48% | 47% |
| Virtual tours | 43% | Not separately broken out on the seller side |
Fact-check: the "403% more inquiries" video claim does not hold up
Search "real estate video statistics" and one figure appears on nearly every list: listings with video supposedly generate 403% more inquiries, usually attributed to NAR or an unnamed real estate body. Independent tracing of the claim finds it does not appear in any NAR report NAR has published, and the trail runs back to a single, uncorroborated agency marketing claim from the early 2010s with no recoverable sample size or methodology. NAR's own 2025 data shows video rated highly important by 47 to 48% of agents - a real, sourced, useful number that does not need an unverifiable multiplier bolted onto it. This page uses the sourced figure and skips the folklore.
A separate teardown of the claim by Machina's listing-video-versus-photography analysis reaches the same conclusion independently: the string does not appear in NAR's 2025 reports, and NAR's own data runs the other way, with a minority of sellers reporting their agent used video at all. Two independent checks landing on the same "unsourced" verdict is a stronger signal than either check alone.
The same discipline applies to budget-setting: Web Tonic's Facebook Ads ROI breakdown works through the same "which claim is actually sourced" test for paid social creative, and is worth the same skepticism agents should apply to any real estate marketing statistic without a named issuer.
Which creative tools agents actually adopted by 2026
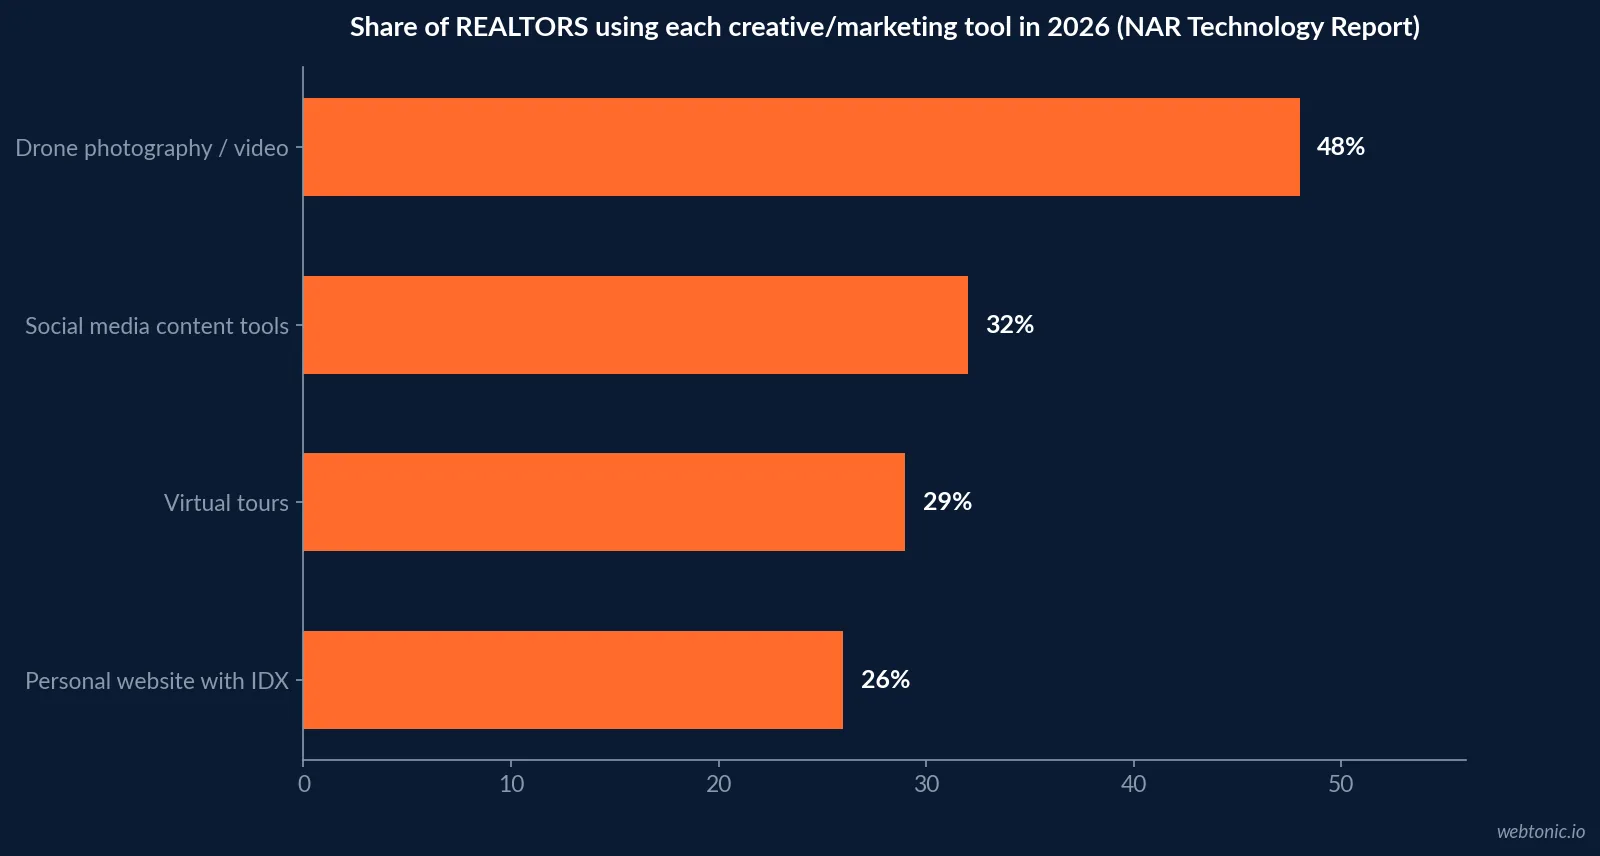
Importance ratings are one thing; actual tool adoption is another. NAR's 2026 REALTORS Technology Report, based on 1,200 agents surveyed in June 2026, shows where creative production tooling landed a year after the staging survey:
| Creative/marketing tool | Share of REALTORS using it in 2026 |
|---|---|
| Drone photography/video | 48% |
| Social media scheduling/content tools | 32% |
| Virtual tours | 29% |
| Personal website using IDX | 26% |
| AI-generated content (ChatGPT, Copilot, Gemini, etc.) | 41% |
Staging economics: what it costs and what it buys
Staging is the creative line item with the clearest dollar data attached. NAR's 2025 survey puts the median cost of a professional staging service at USD 1,500, against USD 500 when the seller's agent stages the home directly rather than hiring a service. On compensation, 26% of sellers' agents say it depends on the situation, 23% personally offer to stage, and 17% say the seller pays for staging before listing.
On outcome, 17% of buyers' agents reported a 1% to 5% increase in the dollar amount offered on staged homes versus comparable unstaged listings. That is a modest, honestly reported lift - not a dramatic one - which is a more credible number than most of the round, viral "staging sells homes for 20% more" claims that circulate without a named source.
| Room | Share of sellers' agents who stage it | Share of buyers ranking it a top staging priority |
|---|---|---|
| Living room | 91% | 37% |
| Primary bedroom | 83% | 34% |
| Dining room | 69% | Not separately ranked by buyers |
| Kitchen | 68% | 23% |
| Guest bedroom | 22% | 7% |
Where the creative budget is actually going in 2026
CallRail's 2026 Marketing Outlook for Real Estate, a survey of 100 US real estate businesses, shows which creative-adjacent tactics agencies implemented over the past year: paid social (52%), email (49%) and video (48%) marketing all saw meaningful adoption, while AI is increasingly doing the first draft: 75% of agents already using AI apply it to listing descriptions, the single most common AI creative use case, ahead of social posts (56%) and follow-up emails (52%).
That AI-drafted-copy trend raises the stakes on the visual side rather than lowering them - if the words are increasingly automated, the photo, staging and video choices become the main place a listing still differentiates itself. Web Tonic's performance creative team applies the same principle to paid listing campaigns: let AI handle variation at scale, and put the human budget into the creative assets buyers' own agents rate highest.
A practical creative order of operations
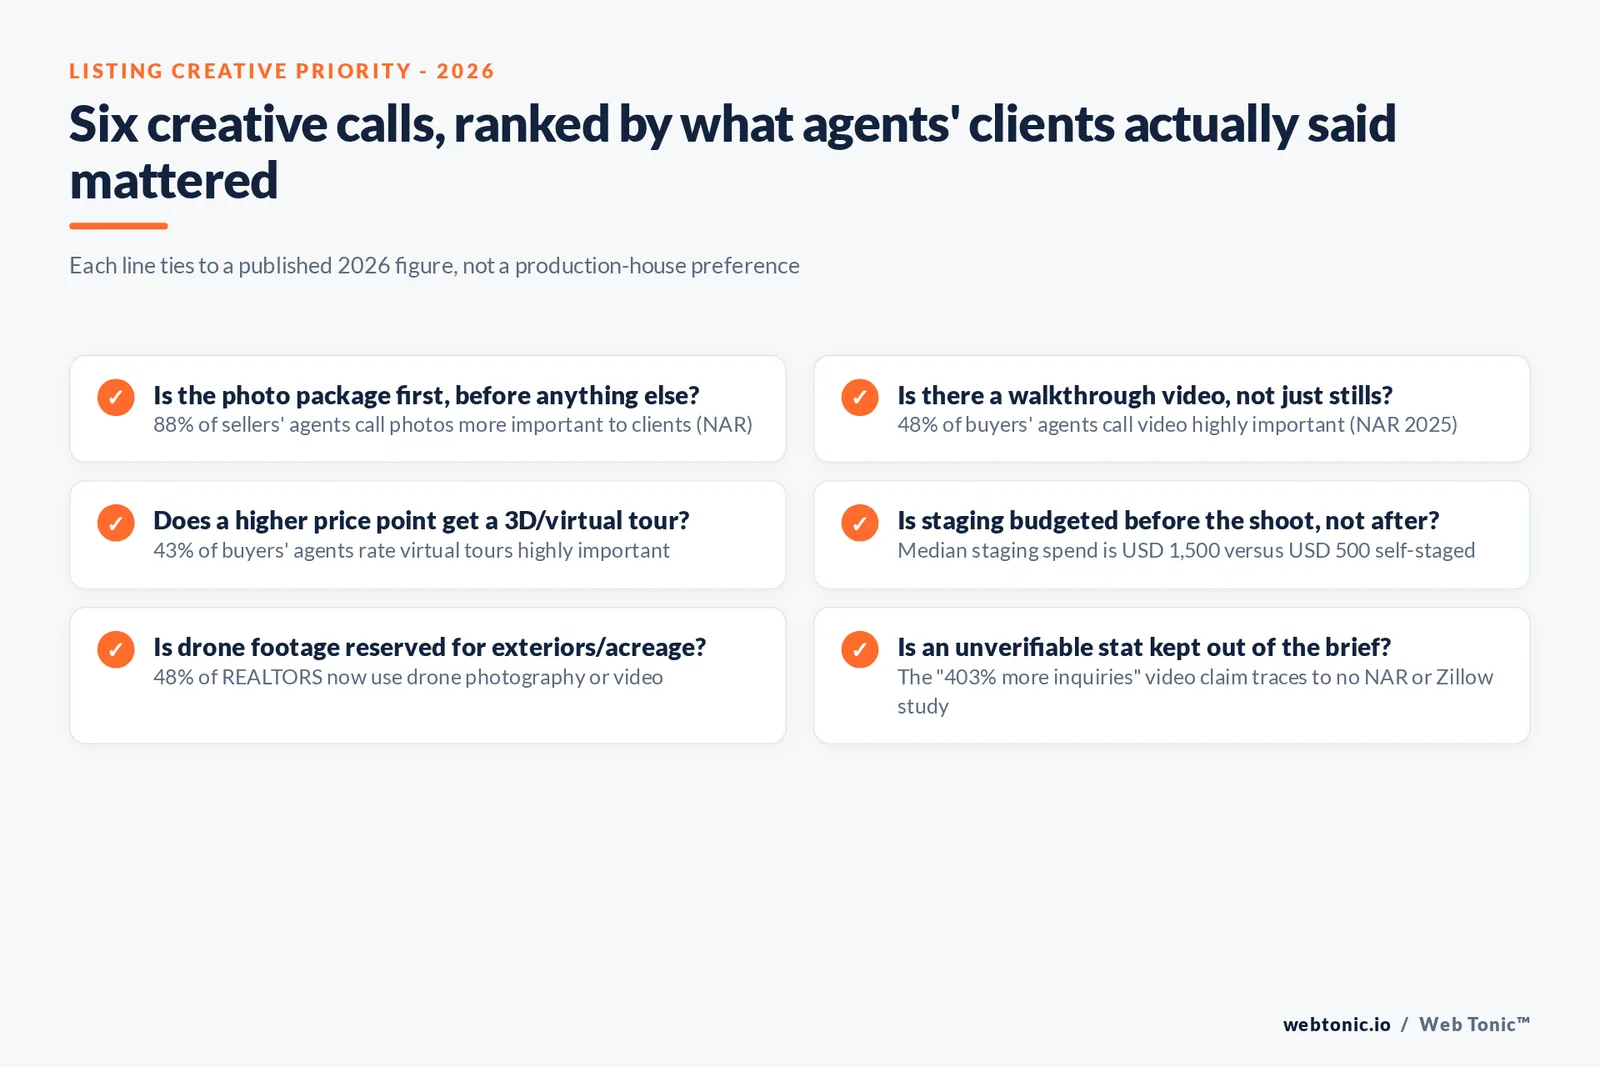
- Budget photos first, every time - 73-88% importance ratings from agents on both sides of the deal make this the one line item with no credible argument to cut.
- Add video on listings where it earns its cost, since 47-48% importance is real but not universal - drone/aerial footage (48% adoption) fits exteriors and acreage better than interior walkthroughs of small units.
- Reserve virtual tours for higher-consideration listings: 29% adoption and 43% importance suggest selective, not blanket, use.
- Budget staging like the data, not like a listicle: USD 1,500 median professional cost against a realistic 1-5% offer lift, concentrated in the living room, primary bedroom and kitchen.
- Drop unverifiable multipliers from the creative brief - if a stat like "403% more inquiries" cannot be traced to NAR, Zillow, or another named issuer, it does not belong next to the sourced numbers above. For a second opinion on a listing creative brief, see how Web Tonic's paid social work is evaluated or reach out directly.
What agencies implemented, versus what agents rated important
There is a gap worth naming between what real estate businesses actually produced in the past year and what agents say their clients value. CallRail's 2026 survey of implemented tactics and NAR's importance ratings, read side by side:
| Tactic | Share who implemented it (CallRail) | Related importance rating (NAR) |
|---|---|---|
| Video | 48% implemented | 47-48% of agents call it highly important |
| Paid social creative | 52% implemented | Not directly rated in NAR's staging survey |
| Email creative | 49% implemented | Not directly rated in NAR's staging survey |
| AI-drafted listing copy | 75% of AI users apply it here | Fastest-growing creative input, not a client-facing asset |
Reading the gap between adoption and importance
Video is the one asset with matching numbers on both sides: about half of agencies produce it, and about half of agents call it highly important to clients - a rare case where supply and demand line up. Paid social and email creative see higher production rates than NAR has data to validate against, which is less a red flag than a reminder that not every channel has a matching "how much did this matter to the client" survey attached. That is exactly the kind of gap Web Tonic's performance creative reviews are built to close: testing which creative variant actually moves a listing's inquiry rate, rather than assuming adoption equals effectiveness.
Frequently Asked Questions
What real estate listing creative actually matters most to buyers, according to agents?
NAR's 2025 Profile of Home Staging, based on a February 2025 survey of REALTORS, found buyers' agents rank photos as highly important to their clients at 73%, ahead of physical staging (57%), video (48%) and virtual tours (43%). On the seller side, agents rank photos even higher, at 88% saying they are more or much more important to clients, with video at 47% and staging at 43%. Photos outrank every other creative asset on both sides of the transaction, which is why a listing photo package is the one creative line item agents should never cut first.
Is it true that real estate listings with video get 403% more inquiries?
No, and this page deliberately does not use that number. The claim is repeated across dozens of real estate marketing blogs, usually attributed to NAR or an unnamed Australian real estate body, but it does not appear in any NAR publication NAR itself has released, and independent write-ups tracing the claim's origin describe it as an uncorroborated agency marketing figure from the early 2010s with no recoverable sample or methodology. NAR's own verifiable 2025 data shows video rated highly important by 47 to 48% of agents, not a 403% inquiry lift - a strong number on its own that does not need an unsourced multiplier attached to it.
Do virtual tours and drone photography actually get used, or are they still niche?
They are mainstream but not universal. NAR's 2026 REALTORS Technology Report found 48% of agents use drone photography or video and 29% use virtual tours as part of their regular toolkit, both well behind photo-driven staples like the MLS (96%) but ahead of niche tools like predictive analytics. 43% of buyers' agents separately rate virtual tours as highly important to their clients, which suggests virtual tours are used selectively - most likely on higher-price or harder-to-visit listings - rather than on every property.
How much does professional staging typically cost, and does it change the offer?
NAR's 2025 Profile of Home Staging puts the median cost of a professional staging service at USD 1,500, versus USD 500 when the seller's agent handles staging directly. On outcome, 17% of buyers' agents reported that staging resulted in a 1% to 5% increase in the dollar amount buyers offered compared to similar unstaged homes, while 21% of sellers' agents said they stage every listing before it goes live and another 51% recommend decluttering or fixing faults instead of full staging.
Which rooms get staged the most, and does that match what buyers say they care about?
Mostly, yes. Sellers' agents most commonly stage the living room (91%), primary bedroom (83%) and dining room (69%), with the kitchen close behind at 68%. On the buyer side, NAR's staging survey found the living room is the room buyers considered most important to stage (37%), followed by the primary bedroom (34%) and kitchen (23%) - so agent staging priorities and buyer preferences line up closely on the top three rooms, with guest bedrooms a distant, commonly-skipped priority on both sides (22% staged, 7% of buyers rating it important).
Sources
NAR, press release on the 2025 Profile of Home Staging
NAR, 2026 REALTORS Technology Report coverage
HousingWire, on NAR's 2026 technology/AI survey findings
CallRail, 2026 Marketing Outlook for Real Estate (n=100 US real estate businesses)
Aktion Productions, on the untraceable origin of the "403% more inquiries" claim
NAR, 2026 REALTORS Technology Report (digital download listing)