



Table of contents
Insurance is one of the biggest advertising categories in the country by spend, and one of the weakest by click-through rate. The industry's own numbers show creative, not budget, is the lever most insurance advertisers are leaving on the table.
Key Takeaways
- Finance and Insurance Facebook traffic CTR is 0.98%, the lowest of every tracked industry.
- Its Facebook traffic CPC is $1.22, the highest of every tracked industry.
- Insurance search CTR is 9.83%, second only to Arts and Entertainment.
- Its search conversion rate is 2.64%, the lowest tracked, despite the strong CTR.
- Geico spent $1.54 billion on US advertising in 2022 and earned $1.22 per dollar spent.
- Progressive spent $1.37 billion the same year and earned $0.04 per dollar spent.
- The top five carriers spent $5.8 billion combined on advertising in 2022.
- The top four carriers cut spend by $1.27 billion from 2022 to 2023.
- Only about 5% of ads spend at least 10x their account's median, cross-industry.
- 84% of Gen Z adults use social media for financial-product research.
- 57% of Gen Z specifically uses TikTok for that research, behind YouTube and Instagram.
- 43% of Gen Z adults already own some life insurance.
- 91% of businesses overall now use video as a marketing tool, cross-industry.
- 51% of video marketers mostly create live-action video over animation or screen-recording.
The category that spends the most but clicks the least
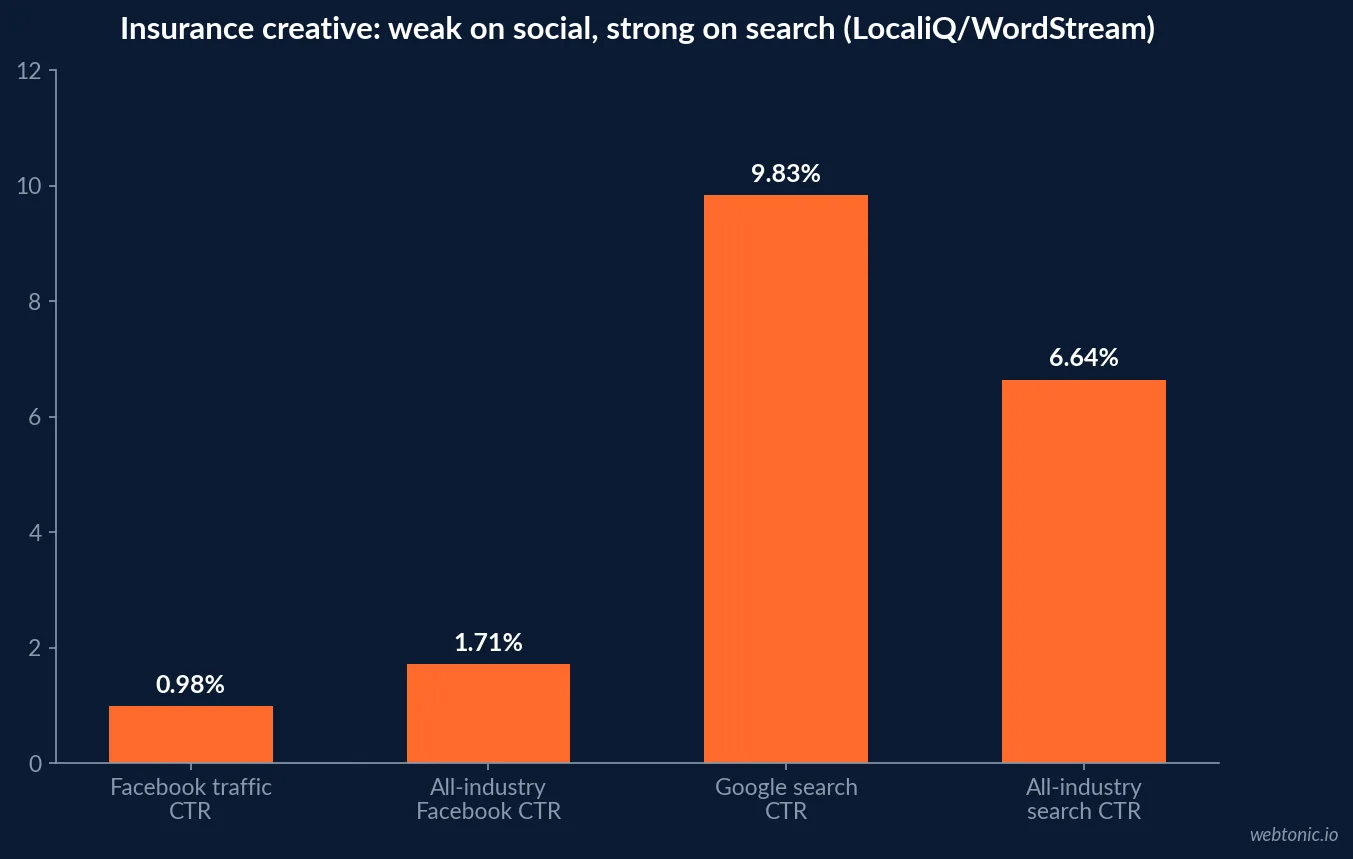
LocaliQ/WordStream's Facebook ads benchmarks, drawn from 1,180 campaigns, put Finance and Insurance traffic-campaign click-through rate at 0.98%, the lowest of every industry measured, against a 1.71% all-industry average - and its cost per click at $1.22, the highest tracked. The report's own read is blunt: "industries such as Automotive - Repair, Services and Parts and Finance and Insurance can't always rely on compelling visuals" the way lifestyle categories can, because most of the audience is not in-market on any given day.
Search tells a different story. The same publisher's 2026 Google Ads benchmarks put insurance search CTR at 9.83%, second only to Arts and Entertainment - people searching for insurance already know they need it, so the creative's job on search is narrower (clear offer, clear price signal) than on social, where it has to manufacture interest from a cold audience first.
| Metric (2025-2026) | Finance & Insurance | All-industry average | Source |
|---|---|---|---|
| Facebook traffic CTR | 0.98% | 1.71% | LocaliQ/WordStream (Facebook 2025) |
| Facebook traffic CPC | $1.22 | $0.70 | LocaliQ/WordStream (Facebook 2025) |
| Google search CTR | 9.83% | 6.64% | LocaliQ/WordStream (Google 2026) |
| Google search conversion rate | 2.64% | 8.18% | LocaliQ/WordStream (Google 2026) |
| Ads spending at 10x median or more (cross-industry) | ~5% | n/a | Motion Creative Benchmarks 2026 |
What the biggest budgets actually bought
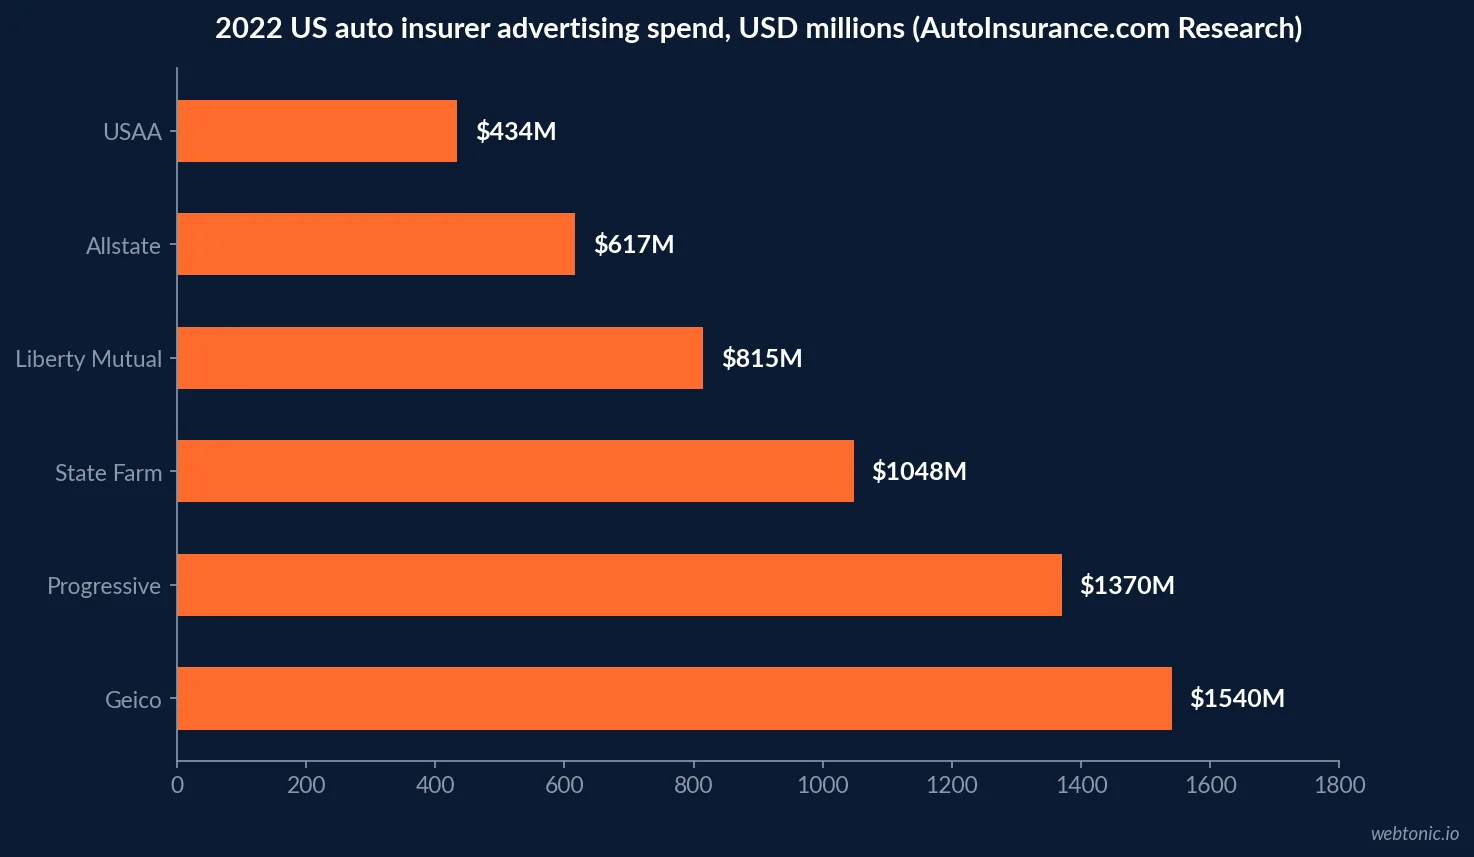
AutoInsurance.com's advertising-spend research found the top five personal auto carriers spent a combined $5.8 billion on US advertising in 2022, led by Geico at $1.54 billion (26% of the group's total) and Progressive close behind at $1.37 billion. Measured against revenue, Geico earned $1.22 for every dollar spent; Progressive earned $0.04, and State Farm and Allstate landed around $0.09. Two carriers spending similar amounts produced wildly different returns - the variable was the creative platform each one built, not the budget behind it.
By 2023, the same four leading carriers had cut combined spend by $1.27 billion, a signal the category itself concluded that raw reach was no longer buying enough. Geico's twenty-year run with a single mascot character is the counter-example: a narrow, repeatable creative system that keeps earning attention without a constant re-invention budget behind it.
| Carrier (2022) | US ad spend | Revenue per ad dollar | Source |
|---|---|---|---|
| Geico | $1.54B | $1.22 | AutoInsurance.com Research |
| Progressive | $1.37B | $0.04 | AutoInsurance.com Research |
| State Farm | $1.05B | $0.09 | AutoInsurance.com Research |
| Liberty Mutual | $815M | n/a | AutoInsurance.com Research |
| Allstate | $617M | $0.09 | AutoInsurance.com Research |
| USAA | $434M | $0.08 | AutoInsurance.com Research |
Where insurance creative can actually win an audience
TikTok is the honest exception to insurance's weak social performance, but only for one buyer segment. LIMRA's 2026 Gen Z research found 84% of Gen Z adults use social media for financial-product information, with 57% specifically using TikTok for it - behind YouTube (66%) and Instagram (58%) but well ahead of Reddit and X (34% each). Only 43% of Gen Z adults currently own life insurance, and 45% report a coverage need-gap, which frames TikTok correctly: it is an acquisition channel for first-time buyers still shopping for their first policy, not a mass-reach substitute for search or Facebook among households that already have coverage.
| Where Gen Z gets financial/insurance information (LIMRA 2026) | Share |
|---|---|
| YouTube | 66% |
| 58% | |
| TikTok | 57% |
| 34% | |
| X | 34% |
| Follow a financial advisor on social | 46% |
| Follow an insurance company on social | 33% |
The format question: video, static, or comparison
Cross-industry, Wyzowl's 2026 State of Video Marketing survey found 91% of businesses now use video as a marketing tool, with 51% of video marketers mostly producing live-action footage versus 23% animated and 19% screen-recorded content. No insurance-specific split is published, but the direction matches what the carrier spend data implies: Geico's mascot-led creative is animated-adjacent and character-driven, while comparison-rate carriers (Progressive's "Flo," direct quote tools) lean live-action and offer-first. Motion's 2026 dataset of more than 550,000 ads, across industries broadly, found roughly 5% of ads account for the outsized majority of efficient spend - the report does not break this out by insurance, so read it as a testing benchmark to beat, not a category-specific number.
| Creative decision | Evidence behind it | Where it applies |
|---|---|---|
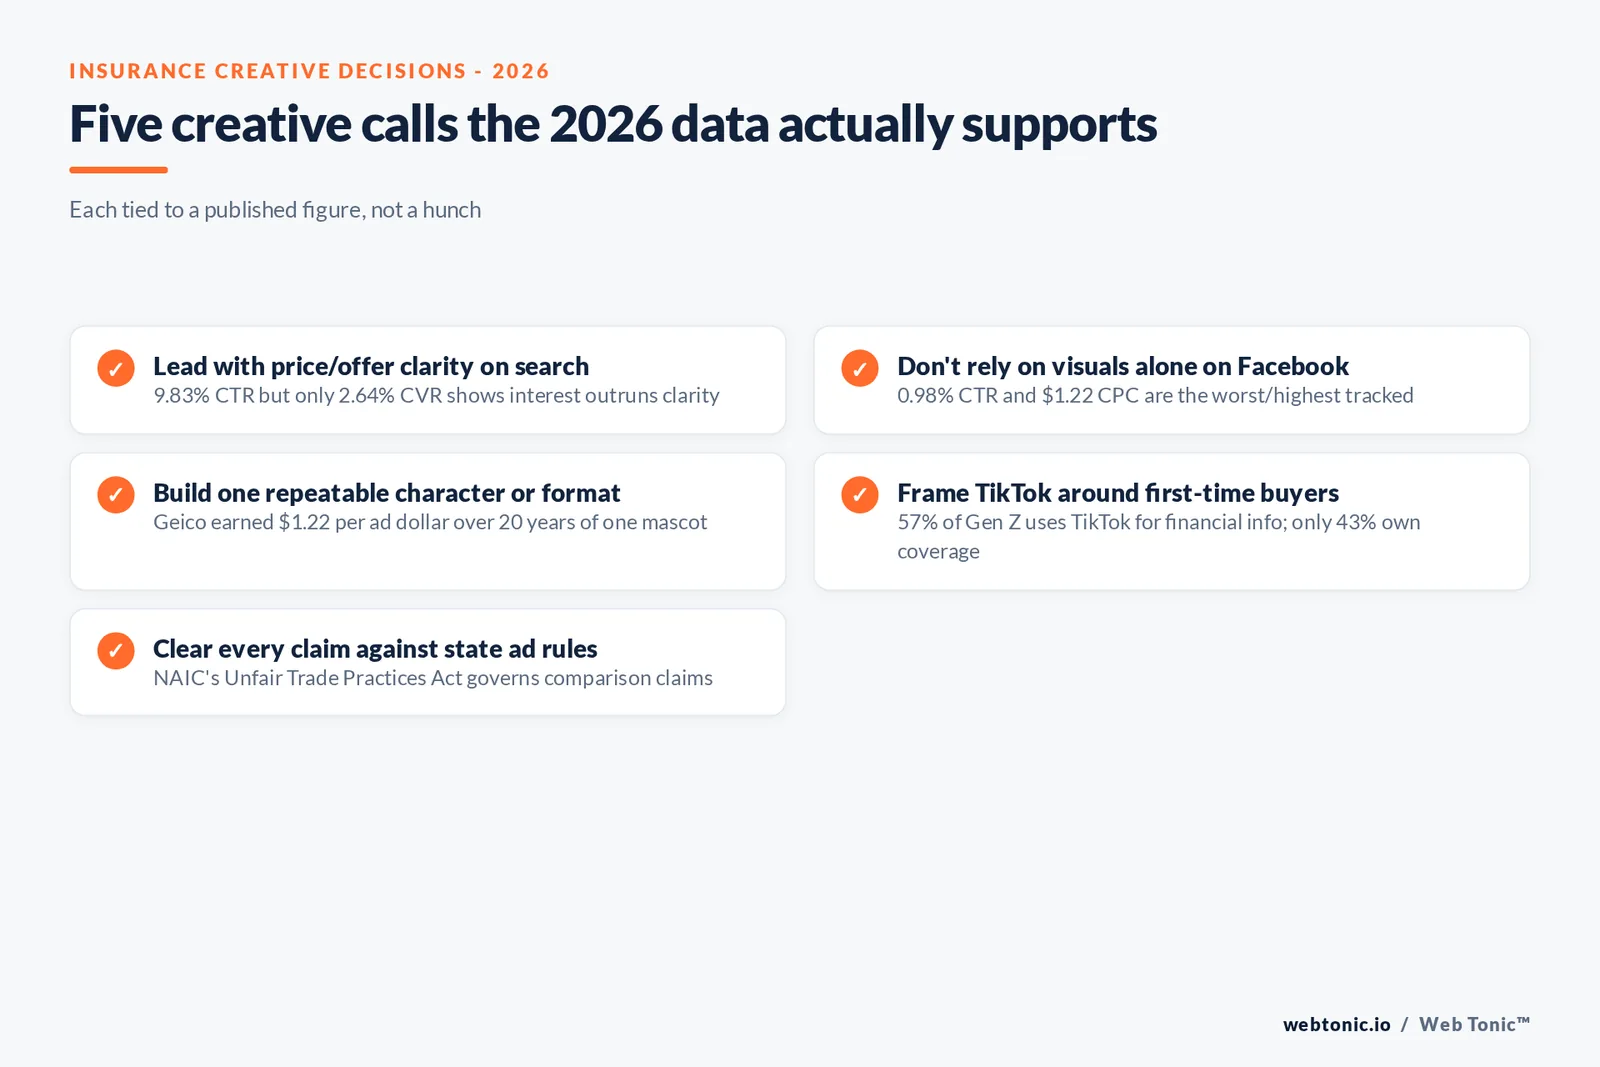
| Lead with price/offer clarity on search | 9.83% CTR but 2.64% CVR shows interest outruns clarity | Google Search |
| Don't rely on visuals alone on Facebook | 0.98% CTR, $1.22 CPC, lowest/highest tracked | Meta feed/traffic campaigns |
| Build one repeatable character or format | Geico: $1.22 revenue per ad dollar over 20 years of one mascot | Brand/awareness budgets |
| Frame TikTok around first-time buyers | 57% of Gen Z uses TikTok for financial info; only 43% own coverage | TikTok, younger acquisition |
| Clear every price or comparison claim against state rules | NAIC Unfair Trade Practices Act applies to ad claims | All paid creative |
The compliance layer creative has to clear
Every claim in the tables above about price, savings or coverage comparison is the exact kind of statement the NAIC's Unfair Trade Practices Act was written to police: it prohibits false or misleading statements about policy benefits, dividends, terms or comparisons in advertising, and it is enforced state by state. On the platform side, Google's Financial Services Verification requires license and registration checks in a growing list of markets before insurance ads run at all - a creative team that ships a new comparison-rate claim without checking it against both layers risks a pulled campaign regardless of how well the creative tests.
| Carrier spend trend, 2022-2023 | Change | Source |
|---|---|---|
| Combined spend cut, top 4 carriers | -$1.27B | AutoInsurance.com Research |
| Geico revenue per ad dollar (2022) | $1.22 | AutoInsurance.com Research |
| Progressive revenue per ad dollar (2022) | $0.04 | AutoInsurance.com Research |
| Insurance Facebook CPC vs. all-industry | $1.22 vs. $0.70 | LocaliQ/WordStream |
Budget cuts are a creative signal, not just a cost signal
The four carriers that cut a combined $1.27 billion in spend between 2022 and 2023 did not do it because insurance stopped needing advertising. Read against the CTR and ROI numbers above, it reads as the category correcting for years of buying reach that a weak click-through rate never converted efficiently. A carrier earning $0.04 per ad dollar has more room to cut spend without losing revenue than one earning $1.22 - which means the brands with the least disciplined creative are also the ones most exposed the next time budgets get reviewed.
That gives independent agents and smaller carriers an opening the biggest budgets don't have: they cannot outspend Geico or Progressive on reach, but they can match the CTR-to-CVR discipline a $9.83% / 2.64% split on search rewards, at a fraction of the media cost.
What this means for the next creative test
Treat search and social as two different creative jobs: search creative should close the gap between a 9.83% CTR and a 2.64% conversion rate with clearer offers, while social creative has to earn attention from an audience that is not actively shopping. Reserve TikTok budget for first-time buyers rather than the whole book of business, and clear every comparative claim against state advertising rules before it ships. None of that requires Geico's budget - it requires Geico's discipline about what one piece of creative is actually supposed to do.
For the media side of that plan, see our take on what Facebook ads actually cost in 2026, our breakdown of when Facebook ads are worth the spend, or talk to us about building the creative testing cadence behind an insurance account.
Frequently Asked Questions
Do insurance ads actually perform worse than other industries?
On paid social, yes, by the numbers. LocaliQ/WordStream's 2025 Facebook benchmarks put Finance and Insurance traffic-campaign click-through rate at 0.98%, the lowest of every industry measured, against a 1.71% all-industry average, while its cost per click is the highest tracked at $1.22. On search, insurance actually over-performs on clicks (9.83% CTR) but under-performs on conversion (2.64%), which points to a landing-page and offer-clarity problem more than a creative-appeal problem.
Why does Geico's advertising outperform Progressive's on ROI despite similar budgets?
AutoInsurance.com's advertising-spend research found Geico earned USD 1.22 in revenue for every advertising dollar spent in 2022, versus USD 0.04 for Progressive, despite Progressive's ad budget being in the same range (USD 1.37 billion versus Geico's USD 1.54 billion). The gap is not spend, it's creative discipline: Geico has run a small number of tightly branded characters (the Gecko) for two decades, while comparison-style insurance creative tends to rotate faster and test more variations.
Is TikTok worth testing for insurance advertisers?
For a specific audience, yes. LIMRA's 2026 Gen Z research found 84% of Gen Z adults use social media for financial-product information, and 57% specifically use TikTok for it, behind only YouTube (66%) and Instagram (58%). That points TikTok at first-time policy buyers in their early-to-mid twenties, not at the broad market - insurance TikTok creative should be framed and budgeted as an acquisition channel for that cohort, not as a mass-reach replacement for search or Facebook.
What creative format wins the most ad spend right now, and does that apply to insurance?
Motion's 2026 Creative Benchmarks report, built from an anonymized dataset of more than 550,000 ads, found that only about 5% of ads spend at least 10 times their account's median - winning creative is rare in every category, including insurance, and larger advertisers see more winners mainly because they test more variations, not because of a superior format. The report is a cross-industry benchmark; no insurance-specific hit-rate figure is published, so treat the 5% figure as a floor to test against, not an insurance number.
What compliance rules constrain insurance ad creative specifically?
State insurance departments enforce the NAIC's Unfair Trade Practices Act, which prohibits false or misleading statements about policy benefits, terms, dividends or comparisons in advertising - a stricter bar than ordinary consumer-advertising law. On top of that, Google's Financial Services Verification policy requires license and registration checks before insurance ads can run in an expanding list of markets, and Meta applies its own financial-products ad review. Creative claiming a specific price, savings percentage or coverage comparison should be checked against the applicable state's advertising rule before it ships, not after a complaint.
Sources
LocaliQ/WordStream - 2025 Facebook ads industry benchmarks
LocaliQ/WordStream - 2026 Google Ads industry benchmarks
AutoInsurance.com Research - Car Insurance Company Ad Spending
LIMRA - Facts About Life Insurance, Gen Z (2026)
Wyzowl - Video Marketing Statistics 2026
Motion - Creative Benchmarks 2026
NAIC - Unfair Trade Practices Act
Google Ads Help - Financial Services Verification


