



Table of contents

Legal advertisers spent more than USD 2.5 billion on ads in 2024, and streaming now holds 49.0% of US TV time, yet no public study benchmarks personal injury connected TV on its own. This page puts the legal ad-spend record, the viewing shift and the published platform floors side by side.
Key Takeaways
- More than USD 2.5 billion was spent on legal-services ads in 2024 (ATRA / Vivvix).
- Those dollars bought more than 26.9 million ads across analyzed media.
- Legal ad spend rose about 39% from 2020 to 2024 while ad counts fell about 4%.
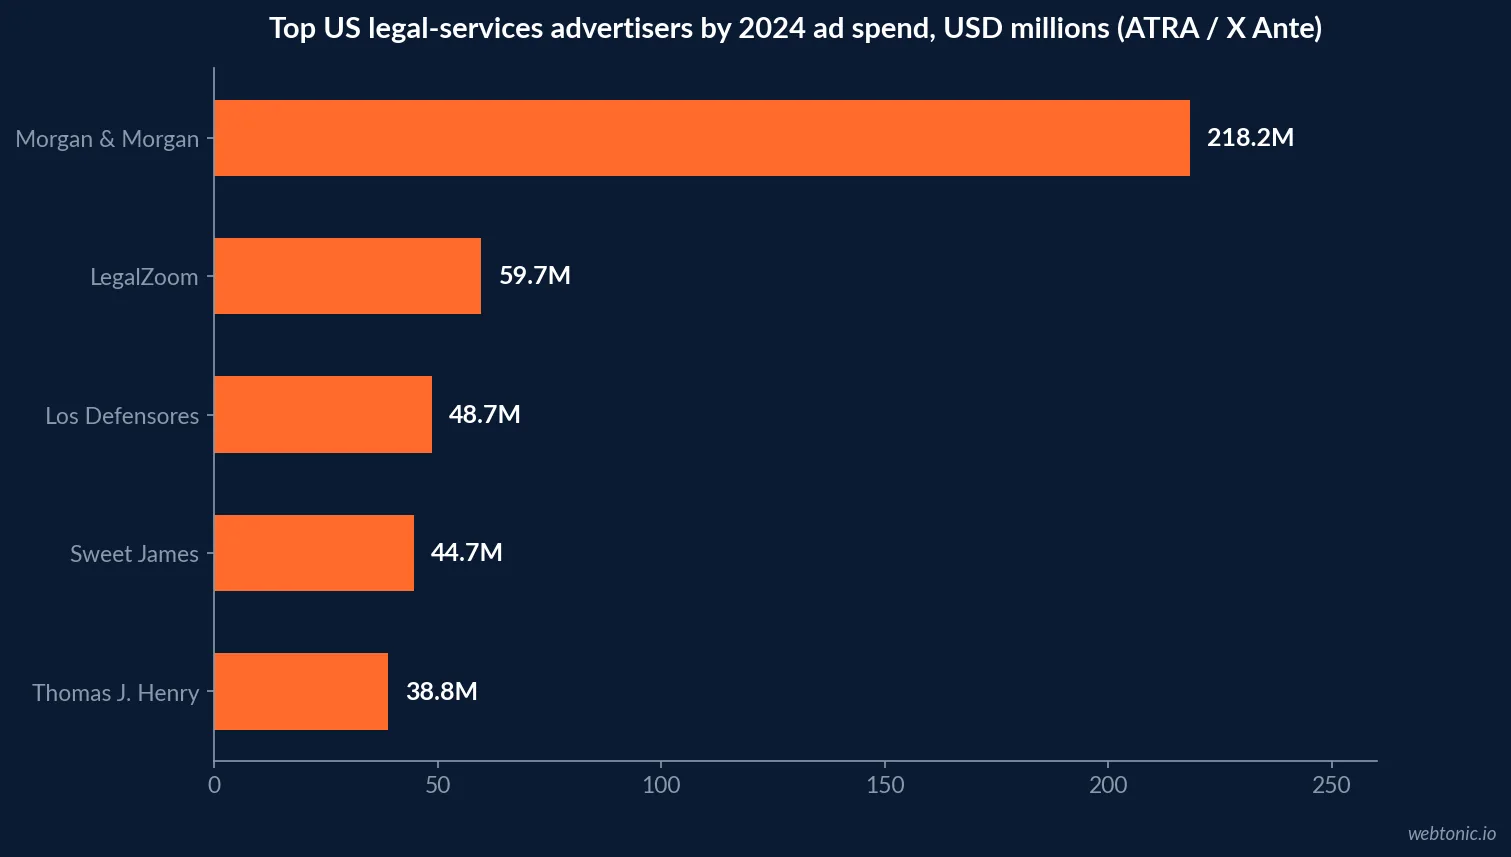
- Morgan & Morgan spent an estimated USD 218.2 million, or 8% of all legal ads.
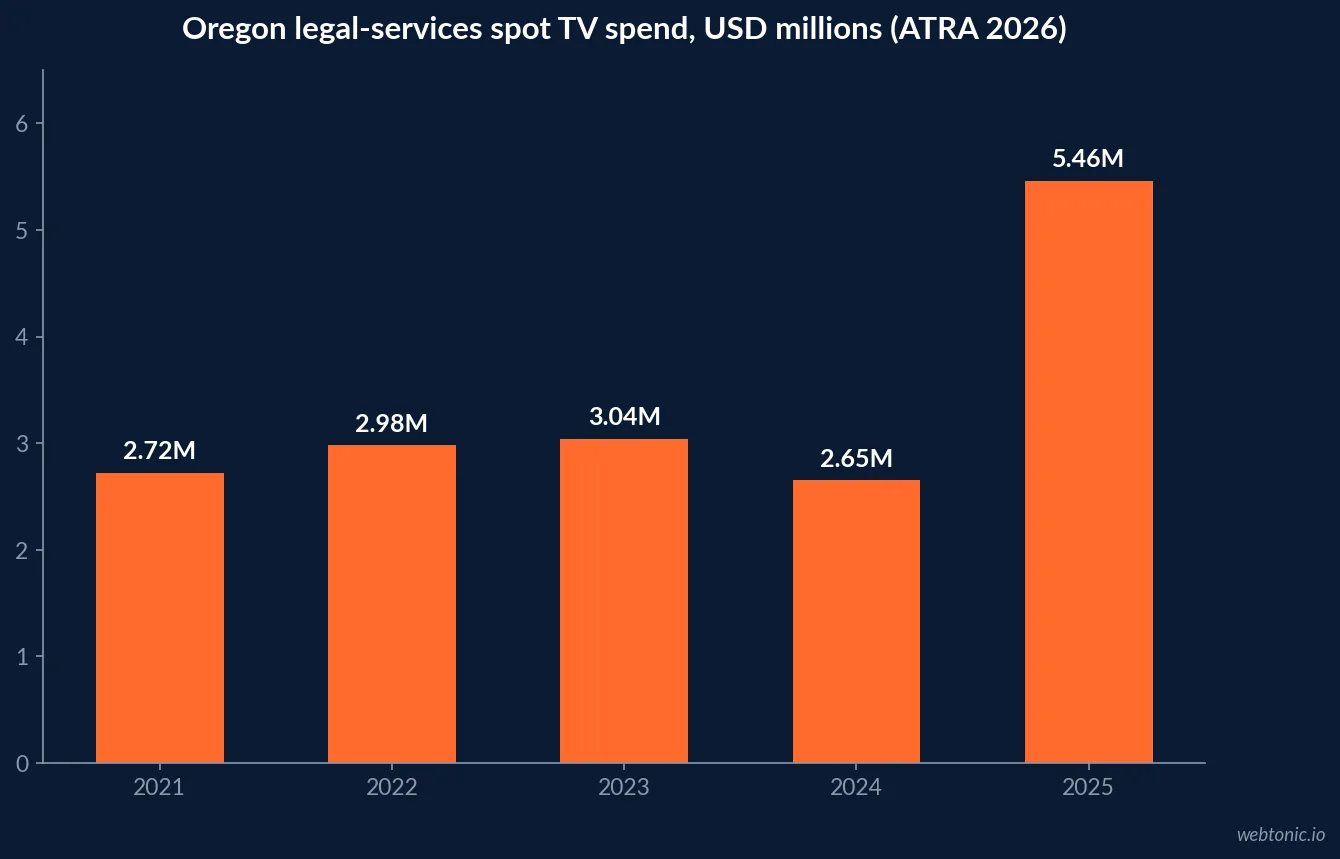
- Oregon legal spot TV spend doubled to USD 5.46 million in 2025.
- Streaming reached 49.0% of US TV time in Nielsen's July 2026 Gauge.
- US digital video ad spend is projected to pass USD 80 billion in 2026 (IAB).
- 18% of US open programmatic CTV traffic was invalid in Q3 2025 (Pixalate).
- Roku's self-serve floor is a USD 500 lifetime budget.
Legal TV spending at a glance
The best public record of lawyer advertising is the American Tort Reform Association (ATRA), a tort-reform advocacy group, whose reports are built on Vivvix ad-monitoring data. Its 2017-2024 national report estimates more than USD 2.5 billion spent on 26.9 million legal-services ads in 2024. For scale, ATRA notes pizza restaurants spent USD 1.1 billion on 4.1 million ads over the same period. ATRA campaigns against lawsuit advertising, so read its framing with that in mind; per the report's methodology, the spend estimates come from Vivvix ad-monitoring data (Adthena for paid search).
| Metric (2024 unless stated) | Figure | Source | What it tells a PI firm |
|---|---|---|---|
| Legal-services ad spend | More than USD 2.5 billion | ATRA / Vivvix | TV-heavy category, crowded breaks |
| Legal-services ads placed | More than 26.9 million | ATRA / Vivvix | High frequency is the norm |
| Spend change 2020-2024 | About +39% | ATRA / Vivvix | Price per placement is rising |
| Ad count change 2020-2024 | About -4% | ATRA / Vivvix | Fewer, costlier spots |
| Largest advertiser | USD 218.2 million, Morgan & Morgan | ATRA / Vivvix | National firms set the bar |
Who outspends whom
The same ATRA report lists the heaviest national spenders. Morgan & Morgan bought an estimated 2,470,854 ad units for USD 218,208,800, followed by LegalZoom at USD 59.7 million, Los Defensores at USD 48.7 million, Sweet James at USD 44.7 million and Thomas J. Henry at USD 38.8 million. A regional firm cannot match that weight on broadcast, which is one reason household-level streaming buys, where a firm pays only for the ZIP codes it serves, get attention from smaller practices.
That is a planning argument, not a measured result: no dataset we found compares signed cases from streaming against broadcast for law firms.
| Advertiser | 2024 spend | 2024 ad units | Type |
|---|---|---|---|
| Morgan & Morgan | USD 218.2 million | 2,470,854 | Personal injury firm |
| LegalZoom | USD 59.7 million | 69,255 | Legal services platform |
| Los Defensores | USD 48.7 million | 158,264 | Attorney network |
| Sweet James | USD 44.7 million | 191,795 | Personal injury firm |
| Thomas J. Henry | USD 38.8 million | 613,050 | Personal injury firm |
A state-level view: Oregon's shift to TV
ATRA's February 2026 Oregon report tracks seven markets reaching Oregonians. Total legal-services spend climbed from roughly USD 4.4 million in 2021 to more than USD 8.6 million in 2025, while ad counts fell from 196,327 to 180,784. Spot TV spend went from USD 2,716,555 to USD 5,460,312 and spot TV units from 72,037 to 114,478. Tracked digital units collapsed from 107,785 to just 885. The report excludes social media, and it does not split out streaming, so this is a linear-TV signal, not a CTV one.
| Medium (Oregon) | 2021 ad units | 2025 ad units | Direction |
|---|---|---|---|
| Spot TV | 72,037 | 114,478 | Up about 59% |
| Radio | 16,505 | 65,421 | Up roughly fourfold |
| Digital (excl. social) | 107,785 | 885 | Nearly gone |
| All tracked media | 196,327 | 180,784 | Fewer, costlier ads |
Where the audience watches now
Nielsen's July 2026 Gauge put streaming at 49.0% of total TV, broadcast at 19.5% and cable at 18.7%. YouTube alone reached a record 14.2% of TV time. Injury ads have historically leaned on local news and daytime broadcast; with broadcast under a fifth of viewing in that month, a plan that ignores streaming misses about half of TV time. Nielsen measures viewing, not ad effectiveness, so this is reach context rather than a performance claim.
CTV market size and growth
IAB's 2026 Digital Video Ad Spend report projects US digital video past USD 80 billion in 2026, up 11%, with CTV growing 11% and social video 13%. Its prior-year edition estimated CTV at USD 26.6 billion for 2025. These are all-advertiser totals; the legal category's slice is not reported.
Linear versus streaming: the cost gap
Most injury firms already buy linear TV, so the useful question is how streaming prices compare. Tatari's analysis of its own client data from 2019 to 2023 found streaming CPMs typically three to four times higher than linear, at about USD 9.50 against USD 2.50. Tatari adds that its streaming rates already sit below market because of direct publisher deals, so open-market streaming can cost more. Its 2025 planning note reports that the average streaming CPM for a 30-second spot fell 16.7% in 2024.
These are cross-industry figures from one buying platform's clients, not law-firm rates. They still frame the trade-off: a streaming impression costs more, but it can be limited to the households inside a firm's service area, while a broadcast spot is paid for across the whole designated market area, including counties where the firm does not take cases. Whether the tighter targeting offsets the higher CPM is something only a firm's own intake data can settle.
| Cost signal | Figure | Source and scope | Caveat |
|---|---|---|---|
| Streaming CPM, Tatari clients 2019-2023 | About USD 9.50 | Tatari own client data | Below open-market rates |
| Linear CPM, Tatari clients 2019-2023 | About USD 2.50 | Tatari own client data | Market-wide reach |
| Streaming vs linear multiple | 3 to 4 times | Tatari own client data | Cross-industry |
| Streaming 30-second CPM change, 2024 | -16.7% | Tatari 2025 planning note | Average, all categories |
| Roku CPM model | Dynamic, max bid optional | Roku help center | No fixed rate card |
What streaming platforms charge to start
Entry costs are published by the platforms themselves. Roku's help center requires a lifetime budget of USD 500 or more per campaign. Amazon Ads lists a USD 10K recommended minimum for self-service streaming TV and USD 50K for managed service. MNTN says small businesses can run for as little as USD 2,000. None of these is a law-firm rate; they are the doors, and delivered cost depends on geography and competition.
| Platform | Published entry point | Pricing basis | Source type |
|---|---|---|---|
| Roku Ads Manager | USD 500 lifetime minimum | Dynamic CPM | Platform help page |
| MNTN Performance TV | From USD 2,000 | Dynamic CPM | Vendor page |
| Amazon streaming TV, self-service | USD 10K recommended | Programmatic | Platform page |
| Amazon streaming TV, managed | USD 50K minimum | Managed service | Platform page |
Fraud and supply risk on CTV
For a firm paying for local households, invalid traffic is a direct leak. Pixalate's Q3 2025 North America benchmarks measured 18% invalid traffic on US open programmatic CTV and 20% in Canada. Pixalate is a fraud-detection vendor and the figure covers open programmatic supply, not direct deals, but it is the clearest public measure of the risk.
Bar rules that travel with the spot
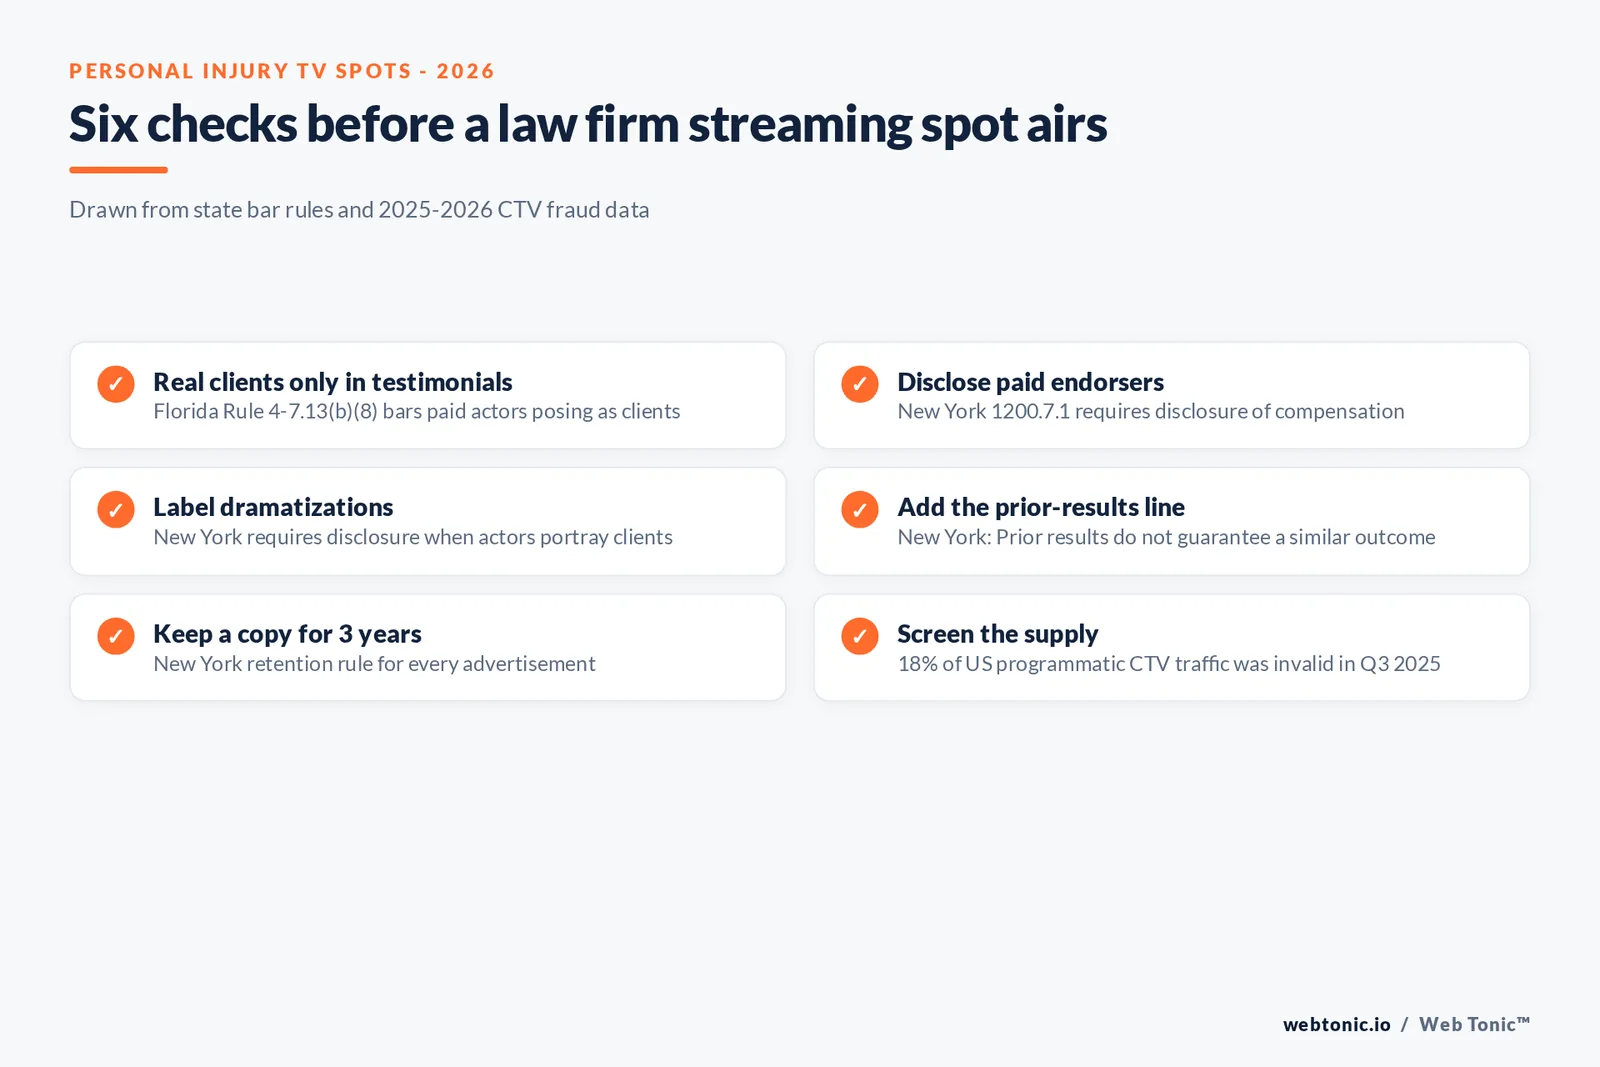
Streaming does not change the ethics rules. California's Rule 7.1 bars false or misleading communications and Rule 7.2 permits advertising through any recorded or electronic medium. The Florida Bar's advertising committee found two TV ads misleading under Rule 4-7.13(b)(8) because paid actors portrayed client testimonials. New York's Rule 1200.7.1 requires disclosing paid endorsements and actors, a "Prior results do not guarantee a similar outcome" disclaimer where results are cited, and retention of each ad for 3 years.
| Rule | Jurisdiction | Requirement | CTV implication |
|---|---|---|---|
| Rule 7.1 | California | No false or misleading communication | Same test for streaming spots |
| Rule 4-7.13(b)(8) | Florida | Testimonials from real, unpaid clients | No actors posing as clients |
| Rule 1200.7.1(c) | New York | Disclose paid endorsers and actors | On-screen disclosure needed |
| Rule 1200.7.1(e) | New York | Prior-results disclaimer | Add to results-based spots |
| Rule 1200.7.1(k) | New York | Retain ads 3 years | Archive every CTV creative version |
What the data does not show
There is no verified public benchmark for law-firm CTV cost per lead, cost per signed case, completion rate or CPM. Any number presented that way should come with a named dataset. What the evidence supports is narrower: legal buyers are paying more per placement, TV remains their dominant medium, streaming now accounts for about half of viewing, and platform floors are low enough to test one market at a time.
It also cannot tell you which injury types respond to streaming. Motor-vehicle, workplace and premises cases have different claimant profiles, and the public data aggregates all legal advertisers, including mass-tort aggregators and legal-services platforms that are not law firms. Treat the national totals as a measure of how contested TV inventory is, and treat your own call logs, signed-case counts and cost per retained client as the only benchmark that matters for your practice. Where a vendor offers a law-firm case study, ask for the sample size, the market and the measurement window before relying on it.
How to set up a case-intake test
- Pick one market where you already sign cases and know your intake volume.
- Start at a published floor, for example Roku's USD 500 lifetime minimum, and fix a flight window.
- Use a dedicated call-tracking number and landing page for the streaming creative.
- Ask for app-level and device-level delivery and exclude supply you cannot verify.
- Compare intake calls in exposed ZIP codes against matched unexposed ones.
- Clear every creative against your state bar rules before launch.
For wider context see our streaming media statistics, the broader advertising statistics roundup, and the personal injury SMS marketing data on following up the calls TV produces. Our performance creative team builds TV-length edits that stay inside bar rules.
Frequently Asked Questions
How much do personal injury firms spend on TV advertising?
The American Tort Reform Association, using Vivvix data, estimates that more than USD 2.5 billion was spent on more than 26.9 million legal-services ads across analyzed media in 2024. Morgan & Morgan alone spent an estimated USD 218.2 million. These figures cover all legal advertisers and all analyzed media, not connected TV only; no public dataset isolates personal injury CTV spend.
Is there a connected TV benchmark for law firms?
Not a published one. No issuer we could verify reports a law-firm CPM, completion rate or cost per signed case on connected TV. Use cross-industry CTV data such as Pixalate's invalid-traffic benchmarks and Nielsen's streaming share, labelled as cross-industry, and measure your own intake calls by market.
What is the minimum budget to test streaming TV for a law firm?
Published floors start low. Roku Ads Manager requires a lifetime campaign budget of at least USD 500, MNTN states no minimums and markets entry from USD 2,000, and Amazon recommends USD 10,000 for self-service streaming TV campaigns and requires USD 50,000 for managed service.
Do state bar rules apply to streaming TV ads?
Yes. Advertising rules apply to any medium. Florida Rule 4-7.13(b)(8) bars testimonials unless they come from real clients who were not paid, New York's Rule 1200.7.1 requires disclosure of actors and paid endorsers, and California Rule 7.1 prohibits false or misleading communications. Check your own state before airing.
How much connected TV traffic is fraudulent?
Pixalate measured 18% invalid traffic on US open programmatic CTV in Q3 2025 and 21% globally in Q4 2025. Buying through direct or curated supply, and checking delivery reports by app and device, reduces exposure.
Sources
ATRA / Vivvix - Legal Services Advertising Report 2017-2024
ATRA - Oregon 2021-2025 Legal Services Advertising Report
Nielsen - July 2026 The Gauge
IAB - 2026 Digital Video Ad Spend report
Pixalate - Q3 2025 North America IVT benchmarks
Roku - Campaign budget and schedule
Amazon Ads - Streaming TV ads
Tatari - What is driving down linear CPMs
Tatari - How to plan and budget for TV in 2025
MNTN - Go Big small business program
State Bar of California - Rules 7.1-7.5
The Florida Bar - Advertising update
Cornell LII - 22 NYCRR 1200.7.1


