



Table of contents
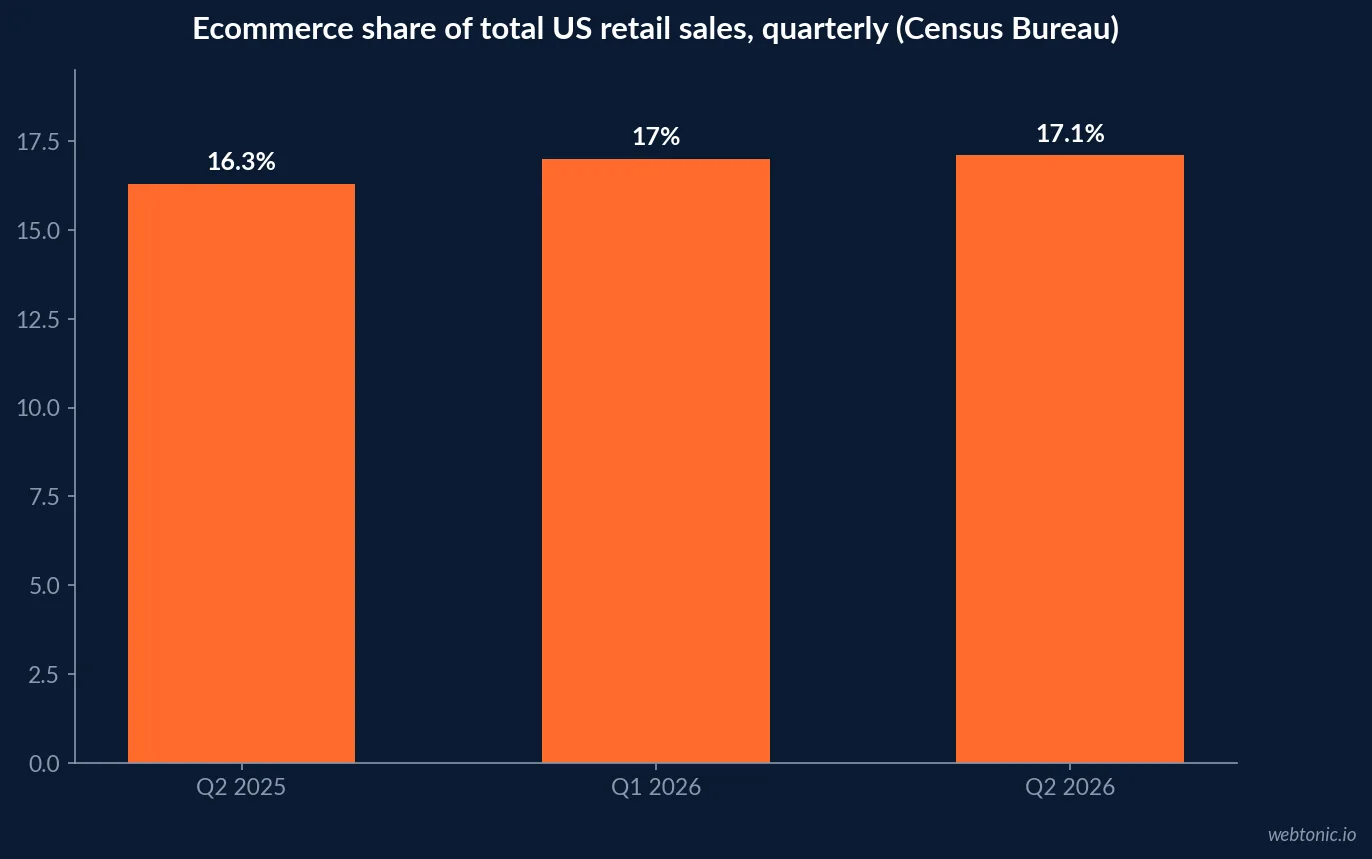
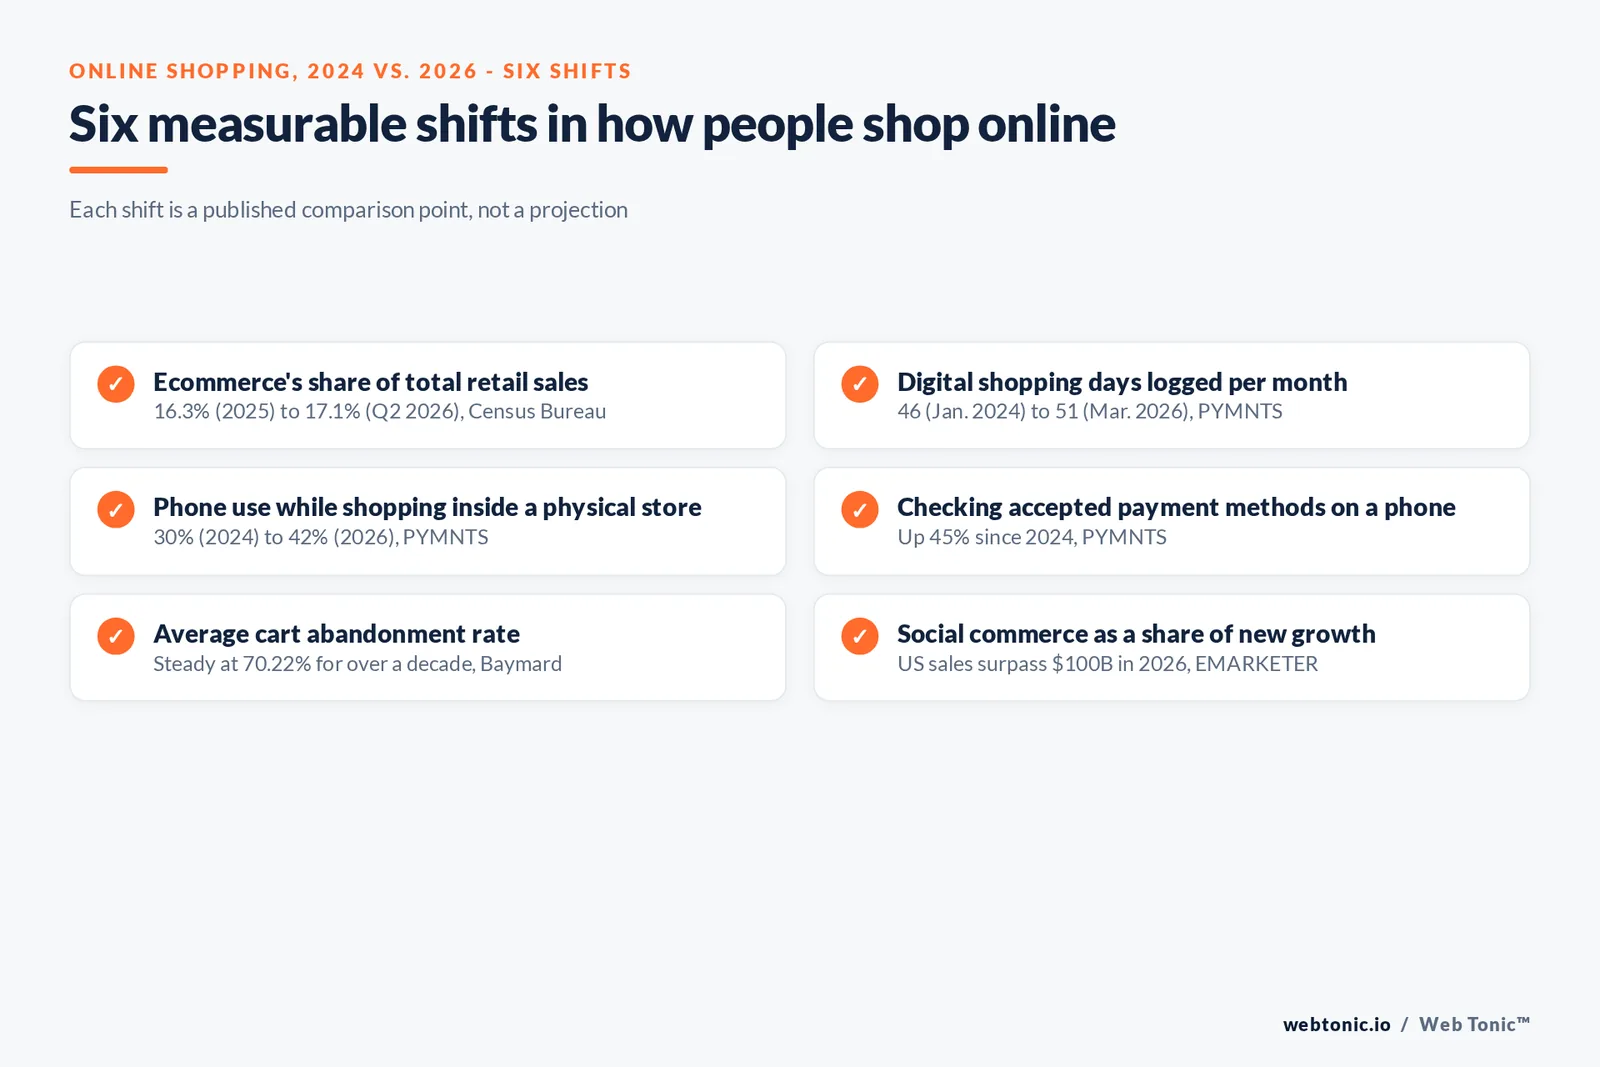
US ecommerce sales hit $340.2 billion in the second quarter of 2026, 17.1% of all retail spending, while the typical shopper now logs 51 digital shopping days a month, up from 46 in early 2024. The two-year shift is less about people buying online for the first time and more about existing digital shoppers using more fulfillment modes at once.
Key Takeaways
- US ecommerce sales reached $340.2 billion in Q2 2026.
- Ecommerce is now 17.1% of total US retail sales.
- That share was 16.3% just one year earlier.
- Ecommerce sales grew 12.2% year over year in Q2 2026.
- Total retail sales grew a slower 6.7% over the same period.
- Shoppers log 51 digital shopping days a month, up from 46 in 2024.
- Buy-online-pick-up-in-store days rose from 8 to 9 a month.
- Phone use while shopping in-store rose from 30% to 42% since 2024.
- Checking payment acceptance on a phone rose 45% since 2024.
- The average cart abandonment rate sits at 70.22%.
- 40% of fixable abandonment is caused by extra costs at checkout.
- $260 billion in US and EU orders are recoverable through better checkout design.
- US social commerce sales will surpass $100 billion in 2026.
- Social commerce sales grow by nearly $50 billion more over 3 years.
- TikTok Shop is projected to reach $23.41 billion in US sales in 2026.
- 60% of shoppers want price matching; only 47% of merchants offer it.
Online shopping benchmarks at a glance
| Metric | 2026 figure | Comparison |
|---|---|---|
| US ecommerce sales, Q2 2026 (seasonally adj.) | $340.2 billion | +12.2% YoY |
| Ecommerce share of total retail sales | 17.1% | 16.3% a year earlier |
| Total retail sales growth, Q2 2026 | +6.7% YoY | vs. +12.2% for ecommerce |
| Average cart abandonment rate | 70.22% | Stable for over a decade |
| Digital shopping days per month | 51 | 46 in January 2024 |
The Census Bureau's Quarterly Retail E-Commerce Sales Report is the government benchmark behind these top-line numbers, and PYMNTS Intelligence's analysis of it makes the two-year trend explicit: online sales keep growing roughly twice as fast as retail overall, which mechanically raises ecommerce's share of the total every quarter even without a single new digital-first shopper entering the market.
The 2024-to-2026 shift, quarter by quarter
| Period | Ecommerce share of retail | Seasonally adj. sales |
|---|---|---|
| Q2 2025 | 16.3% | n/a |
| Q1 2026 | 17.0% | n/a |
| Q2 2026 | 17.1% | $340.2 billion |
Digital shopping days: every fulfillment mode grew
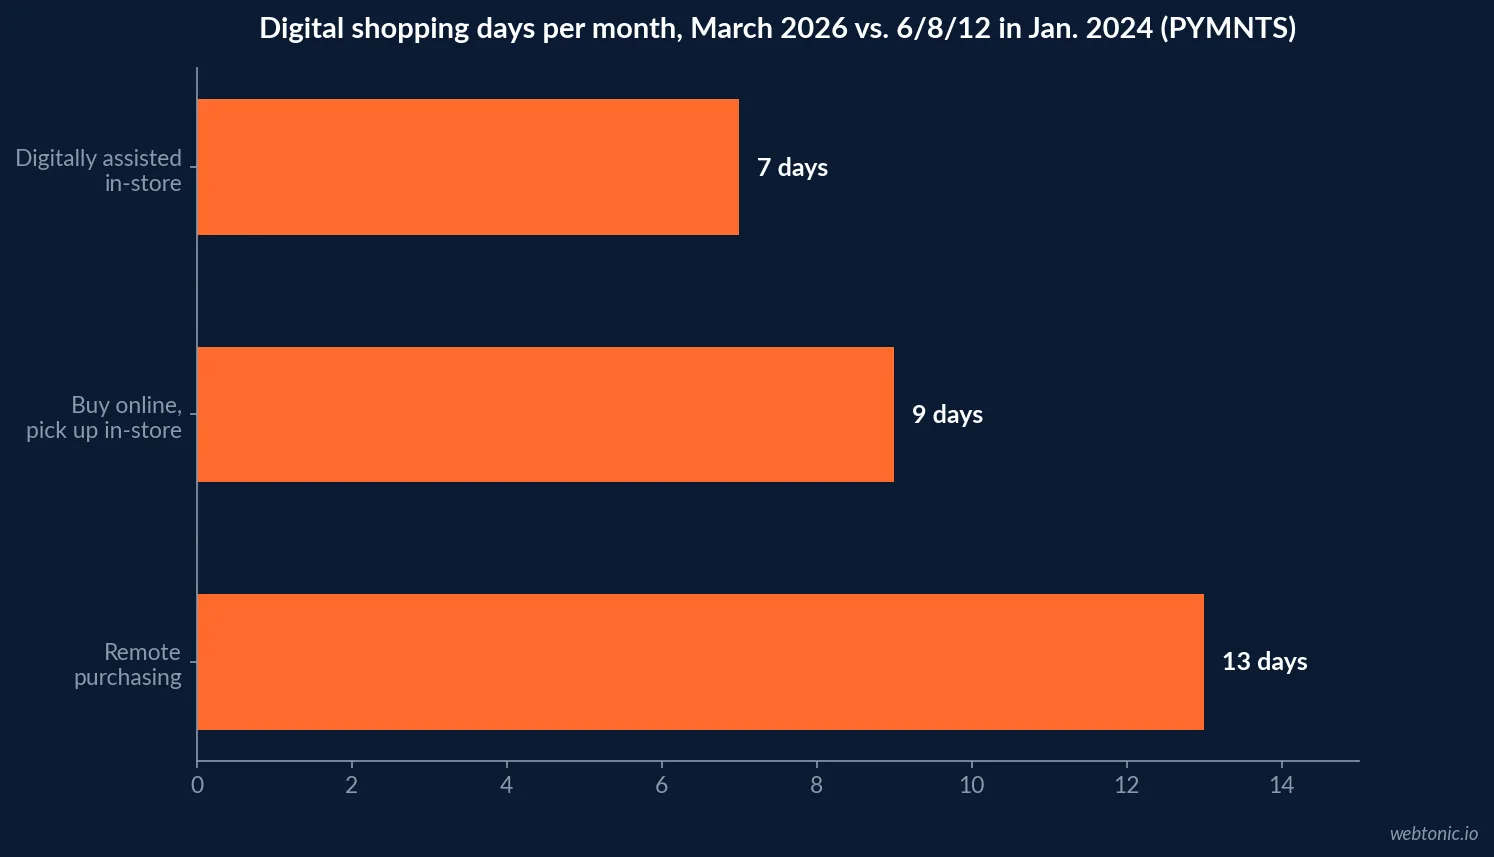
The 2026 Global Digital Shopping Index: US Playbook, a joint PYMNTS Intelligence and Visa Acceptance Solutions study, tracked how shoppers split their digital shopping days across modes between January 2024 and March 2026. Every mode measured grew - remote purchasing, buy-online-pick-up-in-store, and digitally assisted in-store shopping all gained a day per month on average, which is the clearest evidence that 2024-to-2026 growth is about intensity of use, not new adoption.
| Shopping mode | Jan. 2024 (days/mo.) | Mar. 2026 (days/mo.) |
|---|---|---|
| All digital shopping days | 46 | 51 |
| Remote purchasing | 12 | 13 |
| Buy online, pick up in-store | 8 | 9 |
| Digitally assisted in-store shopping | 6 | 7 |
The phone changed what "in-store" means
The same PYMNTS research shows the physical store has been quietly absorbed into the digital journey. Phone use while shopping in a physical store rose from 30% of consumers in January 2024 to 42% in March 2026. Inside that shift: reading product reviews in-store rose 30% since 2024, price comparison rose 18%, and checking which payment methods a merchant accepts rose 45%. Pricing sensitivity is a live gap - 60% of shoppers want price matching, but only 47% of merchants offer it, the largest demand-versus-availability gap the study measured.
| In-store phone behavior | Change since Jan. 2024 |
|---|---|
| Any phone use while shopping in-store | 30% → 42% |
| Reading product reviews in-store | +30% |
| Comparing prices in-store | +18% |
| Checking accepted payment methods | +45% |
| Product research on mobile | +14% |
Cart abandonment: still the biggest leak in the funnel
Baymard Institute's running average across 50 published studies puts cart abandonment at 70.22%, a figure that has barely moved in over a decade. Of the share that is not simply window-shopping, 40% cite extra costs (shipping, tax, fees) being too high, ahead of slow delivery (20%), payment trust concerns (19%) and forced account creation (18%). Baymard estimates $260 billion in combined US and EU orders is recoverable purely through better checkout design.
| Fixable abandonment cause | Share of shoppers citing it |
|---|---|
| Extra costs too high (shipping, tax, fees) | 40% |
| Delivery was too slow | 20% |
| Didn't trust the site with card information | 19% |
| Site required account creation | 18% |
| Checkout too long or complicated | 17% |
The recoverable revenue behind checkout design
Baymard's $260 billion recoverable-orders estimate is not a projection of new demand; it is the value of purchases that were already in a cart when the shopper walked away. The institute's checkout-flow testing found that an ideal flow needs as few as 12 to 14 form elements, yet the average US checkout still displays 23.48 form elements by default. Cutting that down measurably reduces the 17% of shoppers who cite a "too long or complicated" checkout as their reason for abandoning - the single most fixable line in the abandonment table above, because it does not require a pricing or shipping-policy change, only a shorter form.
Even mature ecommerce operators leave this on the table: Baymard's audits of large retailers running established checkout-optimization programs still surface an average of 39 potential improvements per site, evidence that this gap does not close on its own even after a company has already invested in the problem once.
| Checkout benchmark | 2026 figure | Source |
|---|---|---|
| Average US checkout form elements shown by default | 23.48 | Baymard Institute |
| Form elements in an ideal, tested checkout flow | 12-14 | Baymard Institute |
| Average conversion rate gain from better checkout design | 35.26% | Baymard Institute |
| Average improvement opportunities found per audited site | 39 | Baymard Institute |
Mobile crossed the majority line in 2025
Mobile's share of pure online purchasing hit a milestone the same season PYMNTS was tracking in-store phone use: Adobe Analytics data on the 2025 US holiday season found 56.4% of online transactions happened on a smartphone, up from 54.5% in 2024 - the first holiday season mobile carried a clear majority of online purchases outright. The mobile share ran even higher on specific days: 66.5% of Christmas Day online sales and 61.6% of Thanksgiving Day sales were mobile, both up on 2024. Total holiday online spend reached a record $257.8 billion, up 6.8% year over year, with 25 separate days crossing $4 billion in online spend versus 18 days in 2024.
| Mobile / online shopping signal (2025 holiday season) | 2025 figure | 2024 comparison |
|---|---|---|
| Mobile share of all online transactions | 56.4% | 54.5% |
| Mobile share, Christmas Day | 66.5% | 65% |
| Mobile share, Thanksgiving Day | 61.6% | 59.3% |
| Total US holiday online spend (Nov. 1-Dec. 31) | $257.8B (+6.8% YoY) | n/a |
| Days with $4B+ in single-day online spend | 25 days | 18 days |
Why the phone is now a price-comparison tool inside the store
The 42% in-store phone-use figure is worth unpacking by what shoppers are actually doing, not just whether they are doing it. PYMNTS' breakdown shows the growth is concentrated in trust- and cost-related tasks: reading reviews (+30% since 2024), comparing prices (+18%), and checking accepted payment methods (+45%), while coupon-hunting was flat to down. That pattern matters for merchants: shoppers are not primarily hunting for a discount code on their phone anymore, they are removing uncertainty before committing to a purchase they were already fairly likely to make - which is a different problem to solve for than a pure price-war response.
The price-matching gap PYMNTS measured - 60% of shoppers want it, only 47% of merchants offer it - is the largest demand-versus-availability mismatch in the study, and it sits squarely inside this in-store, phone-in-hand moment rather than at the point of online checkout.
| In-store phone task | Change since Jan. 2024 | What it signals |
|---|---|---|
| Reading product reviews | +30% | Trust-building, not discount-hunting |
| Comparing prices with other retailers | +18% | Price transparency expectation |
| Checking accepted payment methods | +45% | Friction removal before checkout |
| Coupon hunting | Flat to down | Not the primary driver of phone use |
Merchants that read the in-store phone purely as a threat - a tool for finding a cheaper price elsewhere - are solving for the wrong behavior. The data shows shoppers are mostly trying to remove doubt about a purchase they are already fairly likely to make: whether the reviews hold up, whether the price is fair, and whether their preferred payment method will work at checkout. Investing in visible, accurate in-aisle information answers that doubt faster than a price-match policy alone.
That same logic extends to the record holiday mobile numbers above: a retailer whose product pages, reviews and payment options render poorly on a phone is losing sales at exactly the moment - in the aisle, card in hand - when the shopper is most ready to buy. Given that mobile now carries the majority of online holiday transactions outright, a slow or cluttered mobile checkout is no longer a secondary experience problem; it is the primary one.
Social commerce: the fastest-growing new line item
EMARKETER's 2026 social commerce forecast projects US retail social commerce sales will surpass $100 billion this year and add nearly $50 billion more over the following three years. Inside that total, TikTok Shop alone is projected to reach $23.41 billion in US ecommerce sales in 2026, up 48% year over year - a bigger US ecommerce business than several established big-box retailers. For teams building the media plan around this shift, our data intelligence team ties checkout and fulfillment data back to the campaigns driving it, and our Facebook Ads cost breakdown is a useful next read for budgeting the social side of this growth. Questions on your own ecommerce funnel can go to our team directly.
Frequently Asked Questions
What share of US retail sales is now ecommerce?
17.1% in the second quarter of 2026, according to the Census Bureau's Quarterly Retail E-Commerce Sales Report, up from 17.0% in the first quarter of 2026 and 16.3% a year earlier. Seasonally adjusted ecommerce sales reached $340.2 billion that quarter, a 12.2% increase year over year, while total retail sales grew a slower 6.7%.
How much has online shopping behavior changed since 2024?
PYMNTS Intelligence and Visa Acceptance Solutions found the typical US shopper now logs 51 digital shopping days a month, up from 46 in January 2024. Remote purchasing rose from 12 to 13 days a month, buy-online-pick-up-in-store rose from 8 to 9 days, and digitally assisted in-store shopping rose from 6 to 7 days - every fulfillment mode grew, not just one.
How much has phone use changed while shopping in physical stores?
Sharply. PYMNTS data shows phone use while shopping in a physical store rose from 30% of consumers in January 2024 to 42% in March 2026. Within that, reading product reviews in-store rose 30% since 2024, price comparison rose 18%, and checking which payment methods a merchant accepts rose 45% - the phone is now a store-navigation tool, not just a research device used before leaving home.
What is the average cart abandonment rate in 2026?
70.22%, per Baymard Institute's running average across 50 published studies. The single largest recoverable cause is cost transparency: 40% of shoppers who abandon a cart for a fixable reason cite extra costs (shipping, tax, fees) being too high, ahead of slow delivery (20%) and checkout trust concerns (19%).
Is social commerce a meaningful share of online shopping yet?
Yes and growing fast. EMARKETER forecasts US retail social commerce sales will surpass $100 billion in 2026 and grow by nearly $50 billion more over the following three years. TikTok Shop alone is projected to reach $23.41 billion in US ecommerce sales in 2026, a 48% year-over-year increase.
Sources
US Census Bureau - Quarterly Retail E-Commerce Sales Report
PYMNTS - eCommerce Takes 17.1% of Retail Sales
Baymard Institute - 50 Cart Abandonment Rate Statistics
EMARKETER - The Next Era of Social Commerce
EMARKETER - FAQ on Social Commerce
Adobe Analytics - 2025 Holiday Shopping Season Report


