Table of contents

Online marketplace marketing is the work of growing two customer bases at once: sellers who supply the inventory and buyers who purchase it. Everything that makes a single-brand online store campaign work still applies, but the budget has to be split across both sides and judged against a take rate of roughly 8% to 17% of each sale.
Key Takeaways
- A marketplace earns a commission, not a full margin. Amazon's referral fees run 8% to 17% in most categories, with a $39.99/month professional account fee on top, so a marketplace's own customer acquisition cost has to clear a far lower ceiling than a retailer's.
- eBay booked $79.6 billion of GMV in 2025 and $11.1 billion of revenue — a blended take rate near 14%. That ratio, not raw GMV, is what your marketing budget is drawn from.
- Marketplace advertising is now a profit centre in itself: eBay's ad products produced $544 million in Q4 2025 alone, equal to 2.6% of GMV.
- Liquidity beats reach. A marketplace with fewer than 3 sellers per category converts badly no matter how much traffic you buy, so supply-side and demand-side spend must be sequenced, not run in parallel at equal weight.
- Product feed quality is a hard technical gate. Google requires product images of at least 500 x 500 pixels from January 31, 2027, allows up to 10 additional images per item and descriptions up to 5,000 characters.
- Paid search on a marketplace still pays the market rate: $5.42 average CPC and a 6.64% CTR across industries, which means content marketing and SEO carry the long-term unit economics.
Types of online marketplaces, and what each one changes about marketing
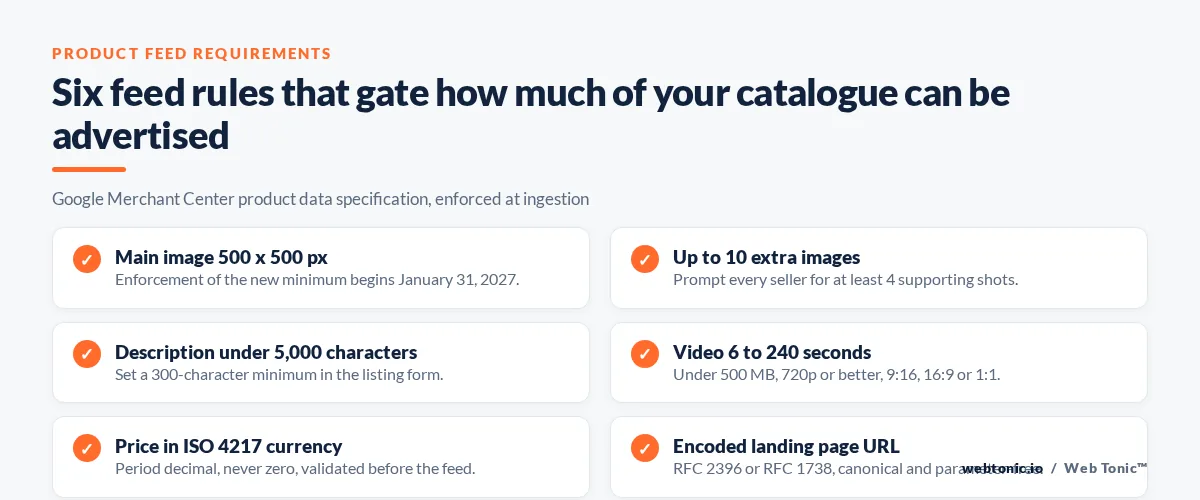
Before you pick channels, name the model. The marketing strategy for a horizontal multi vendor marketplace has almost nothing in common with a vertical services marketplace, because the buyer's decision, the seller's incentive and the repeat rate all differ.
| Marketplace type | Examples | Buyer behaviour | Marketing priority |
|---|---|---|---|
| Horizontal (everything) | Amazon, Walmart, Rakuten, Mercado Libre | Search-led, price-led, high repeat | Search engine optimization on category pages plus retention email |
| Vertical (one category) | Zalando, ASOS Marketplace, Etsy | Browse-led, taste-led, medium repeat | Content marketing, social media, curated collections |
| Services / bookings | Home services, tutoring, trades platforms | Local, urgent, low repeat | Local SEO plus paid search on high-intent queries |
| B2B wholesale | Alibaba, industrial distributors | Long cycle, quote-driven, very high repeat value | Lead capture, sales enablement, ERP and catalogue integrations |
| Resale and rental | eBay pre-loved, peer-to-peer rental | Deal-seeking, supply-constrained | Seller acquisition first, buyer demand second |
| Embedded (inside a network) | Facebook Marketplace, Instagram and Pinterest shopping surfaces | Impulse, feed-driven, local pickup | Catalogue feed hygiene and creative volume |
Rule 1 — one marketplace strategy per model. If your platform spans two of the rows above, run two marketing plans with separate budgets and separate liquidity targets rather than one averaged plan.
The take-rate math that sets your marketing budget
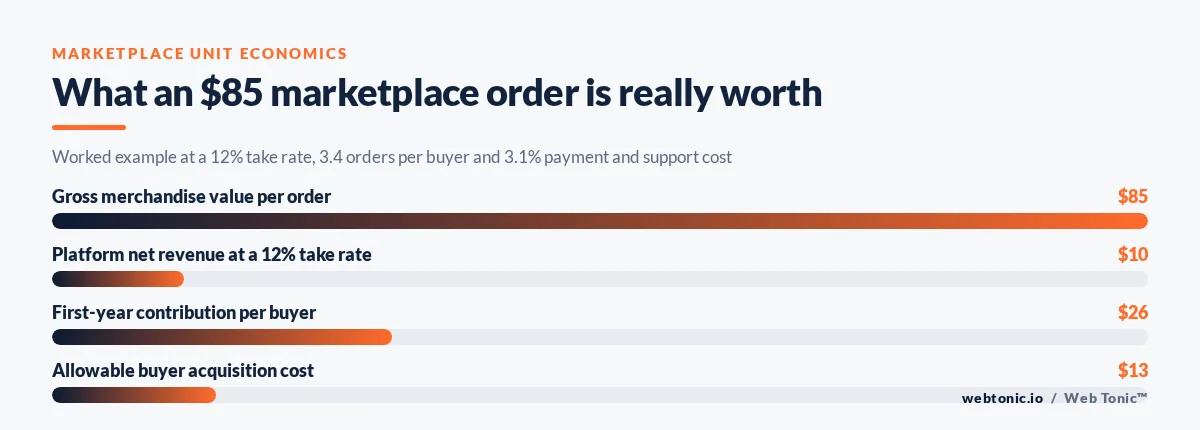
Marketplace economics are unforgiving in a specific way: you market a full basket but bank a slice of it. Amazon's published fee schedule is the clearest public reference — 15% of the sales price up to $300 in most categories and 8% above it, 20% on the first $100 of some proceeds, 16% up to $1,500 then 3% in others, plus a $1.80 per-item closing fee on media. Model your own take rate the same way, then work backwards.
| Input | Worked example | Why it constrains marketing |
|---|---|---|
| Average order value | $85 | Sets the ceiling on every paid channel |
| Take rate | 12% | Net revenue per order is $10.20, not $85 |
| Orders per buyer, year one | 3.4 | First-year gross profit per buyer is about $35 |
| Payment and support cost | 3.1% of GMV | Cuts contribution to roughly $26 |
| Allowable buyer CAC | $13 at a 2.0 payback ratio | Rules out most cold paid social prospecting |
| Allowable seller CAC | $180 per active seller | Justifies sales-assisted onboarding |
Limit 2: a marketplace can rarely afford a buyer CAC above 40% of first-year contribution. That single number decides whether your growth comes from paid acquisition or from organic and product-led loops.
The supply side: attracting sellers to an online marketplace
Sellers are a B2B audience with a spreadsheet. They compare your take rate, your traffic and your payout speed against Amazon, Walmart and their own online store, and they do it in one sitting. Marketplace marketing on this side looks like enterprise demand generation, not ecommerce.
| Seller acquisition channel | Best for | Typical effort | What proves it works |
|---|---|---|---|
| Outbound to existing third party sellers | Cold-start categories | High, sales-led | Listings live within 14 days of signup |
| Search ads on "sell on {category}" queries | Established platforms | Medium | Cost per activated seller under your allowable CAC |
| Seller handbook and content marketing | Long-term compounding | Medium | Organic signups with no touch |
| Migration tooling and ERP or catalogue imports | Multi vendor marketplace scale | Engineering-heavy | Median SKUs per seller rising |
| Fee promotions and launch credits | Filling thin categories fast | Low | Retention after the promotion ends |
| Seller referral loops | Craft and resale niches | Low | Referred sellers exceed 15% of new supply |
Rule 3 — measure activated sellers, not signups. A seller with zero live listings costs you support time and adds nothing to buyer conversion, so treat first-listing-live as the acquisition event.
Amazon's own seller pitch is instructive: it advertises over $50,000 in new seller incentives because the cost of a cold category is higher than the cost of a subsidy. Web Tonic's growth marketing team models these subsidies as an acquisition line, not a discount line.
The demand side: attracting buyers without overpaying
Buyer acquisition on a marketplace lives or dies on whether the category is deep enough to convert the visit. Send paid traffic into a category with three listings and you have bought a bounce. Sequence it instead: reach a supply floor, then open the taps.
| Marketing channel | Role in the buyer funnel | Cost profile | Liquidity requirement |
|---|---|---|---|
| Search engines (organic) | Captures existing category demand | Fixed content and engineering cost | 20+ live listings per category page |
| Paid search and shopping ads | Converts high-intent product queries | $5.42 average CPC across industries | In-stock feed, competitive pricing |
| Paid social prospecting | Creates demand for unique supply | Cheap clicks, expensive conversions | Visually distinctive products |
| Email marketing | Drives repeat purchase and reactivation | Lowest cost per order on the list | Enough new supply to justify a send |
| Marketplace-native ads (seller funded) | Monetises existing traffic | Revenue positive for the platform | Several sellers bidding per keyword |
| Affiliate and comparison sites | Captures late-stage comparison | Pay per sale, low risk | Stable pricing and stock |
Limit 4: below 20 live listings in a category, spend on supply, not on buyer traffic. Above roughly 200 listings, extra supply stops improving conversion and buyer demand becomes the binding constraint.
Search engine optimization for an online marketplace
Marketplaces win search through templates, not through articles. One well-built category template can rank thousands of pages, which is why technical structure matters more here than in almost any other online marketing strategy. Product page SEO fundamentals apply, but the leverage sits in how the template handles thin, duplicate and out-of-stock inventory.
| Page template | Ranks for | Common failure | Fix |
|---|---|---|---|
| Category | Head terms and modifiers | No unique copy, infinite facets indexed | Index only facets with search volume and 20+ items |
| Product detail | Long-tail model and brand queries | Seller-supplied duplicate descriptions | Enforce minimum content rules at listing time |
| Seller storefront | Brand and "brand + reviews" | Orphaned, no internal links | Link storefronts from every listing |
| Location or service area | Local intent | Thin pages with no live supply | Publish only where supply exists |
| Editorial guides | Research-stage queries | Not linked to inventory | Embed live listing modules |
| Out-of-stock listings | Residual demand | 404s that lose accumulated equity | Keep the URL, surface alternatives |
Rule 5 — every indexed page must contain live, buyable supply. Structured data is the second half of the job: mark listings up with Google's product structured data so price and availability appear in the results, and keep the same data flowing into your shopping feed.
Feed quality: the unglamorous core of marketplace marketing
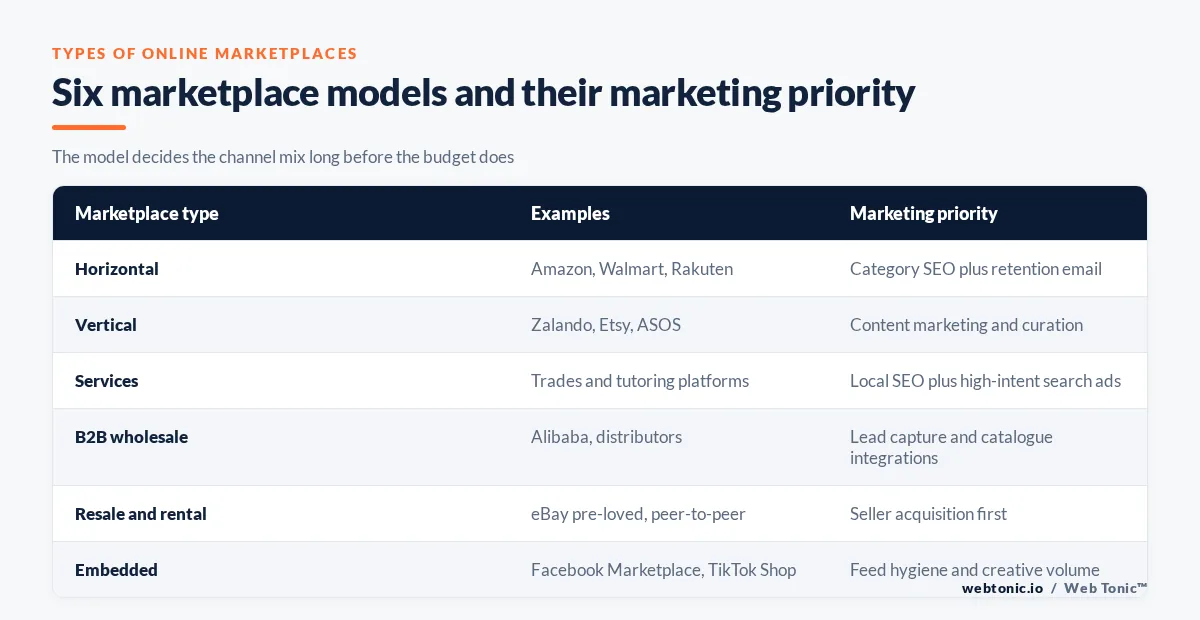
A marketplace's feed is its advertising inventory. Google's product data specification sets hard limits that quietly decide how much of your catalogue can be advertised at all.
| Feed attribute | Requirement | Marketplace implication |
|---|---|---|
| Main image | At least 500 x 500 px, enforced from January 31, 2027 | Reject low-resolution seller uploads at ingestion |
| Additional images | Up to 10 per product | Prompt sellers for 4 or more |
| Description | Maximum 5,000 characters | Set a 300-character minimum in your listing form |
| Video | 6 to 240 seconds, under 500 MB, 720p or better | Video-eligible SKUs get their own promotion tier |
| Price | ISO 4217 currency, period decimal, never zero | Validate seller pricing before it reaches the feed |
| Landing page URL | Encoded per RFC 2396 or RFC 1738 | Canonical, parameter-free listing URLs |
Limit 6: feed rejection rates above 5% mean your listing form, not your ad account, is the problem. Fixing ingestion rules once beats fixing feed errors every week, and it is usually a data engineering job rather than a marketing one.
Paid ads for online marketplaces: where the money actually goes
Marketplace paid media splits into three jobs — buying buyers, buying sellers and selling ads to your own sellers. The third one is why mature platforms look profitable: eBay's advertising offerings generated $544 million of revenue in Q4 2025, or 2.6% of GMV, with first-party ad products up 19% year on year.
| Paid channel | Objective | Benchmark to hold it to | Notes |
|---|---|---|---|
| Shopping ads | Buyer purchase | ROAS above your inverse take rate | Feed-driven, needs clean stock data |
| Brand search | Defend the marketplace name | CPC well under the $5.42 all-industry average | Cheapest volume you will ever buy |
| Non-brand search | Category demand capture | 6.64% CTR as the floor | Only where supply is deep |
| Paid social prospecting | Demand creation | Contribution-positive within 30 days | Works for distinctive, visual supply |
| Retargeting | Cart and browse recovery | Incremental, not last-click, lift | Cap frequency to protect margin |
| Seller-funded sponsored listings | Platform revenue | Ad load under 3% of GMV | Too much ad load degrades buyer trust |
If you are a brand selling through marketplaces rather than running one, the equation flips: you buy visibility inside someone else's auction with tools such as Amazon Sponsored Products, and your comparison set is Google Shopping ads on your own store. Rule 7 — never run the same product at the same price on both without modelling the fee difference.
Content and email marketing that fits a two-sided platform
Content marketing on a marketplace has to serve two readers. Seller-facing content reduces support load and drives organic supply; buyer-facing content captures research-stage demand that category pages cannot reach. Standard ecommerce marketing playbooks cover the buyer half well and the seller half barely at all.
| Asset | Audience | Job | Cadence |
|---|---|---|---|
| Seller handbook | Sellers | Onboarding and activation | Evergreen, reviewed quarterly |
| Category buying guides | Buyers | Capture research queries | 2 to 4 per month |
| New supply digest email | Buyers | Repeat purchase | Weekly |
| Performance report email | Sellers | Retention and upsell to ads | Monthly |
| Price and demand data studies | Both, plus press | Links and authority | Quarterly |
| Abandoned browse flow | Buyers | Recover intent | Triggered |
Limit 8: if a buyer email cannot show at least 12 new or restocked listings, do not send it. Frequency without novelty is the fastest way to burn a marketplace list.
Social media and embedded marketplace surfaces
Social platforms are simultaneously marketing channels and competing marketplaces. Facebook Marketplace, Instagram shopping, Pinterest and TikTok Shop all let a seller transact without you. Treat them as distribution you syndicate to and measure, not as an existential threat.
| Surface | Use it for | Risk |
|---|---|---|
| Facebook Marketplace | Local, high-volume resale categories | Off-platform transactions you cannot monetise |
| Taste-led vertical supply and creator content | Attribution gaps on browse-led demand | |
| Home, craft and wedding categories | Long lag between save and purchase | |
| TikTok | Impulse products and seller storytelling | Creative volume requirement is high |
| YouTube | Seller education and category explainers | Slow production cycle |
| Marketplace-owned communities | Seller support and retention | Moderation cost scales with supply |
One legal note that catches platforms out: if you feature customer reviews or creator endorsements to promote listings, the FTC's endorsement guidance applies to the marketplace as well as to the seller. Rule 9 — disclose incentivised reviews and remove ones you know are fake.
Marketplace growth strategies by stage
The single most common mistake in online marketplace marketing is running a mature-platform channel mix on a cold-start platform. The right strategy changes at least three times on the way to scale.
| Stage | Signal you are here | Where the budget goes | Metric that matters |
|---|---|---|---|
| Cold start | Fewer than 100 sellers, thin categories | 80% supply, 20% demand, one city or niche | Listings live per category |
| Single-market liquidity | Search-to-purchase rate rising | 50/50 with paid search switched on | Percentage of searches with a purchase |
| Category expansion | Core category profitable | Supply-led again in each new category | Time to liquidity per new category |
| Geographic expansion | Repeatable playbook | Local SEO plus regional seller sales | Contribution margin per market |
| Monetisation | Sellers competing for visibility | Ad platform and premium seller tiers | Ad revenue as a share of GMV |
| Defence | Competitors bidding on your name | Brand search, retention, loyalty | Repeat purchase rate |
Limit 10: no more than one stage transition at a time. Platforms that expand category and geography together usually lose liquidity in both.
Metrics for measuring marketplace marketing effectiveness
Retail dashboards mislead marketplace operators because they report GMV, which you do not keep. These are the numbers to run the review on. US ecommerce totals from the Census Bureau's quarterly ecommerce series give you the market context; the rest are yours.
| Metric | How to calculate it | Healthy direction |
|---|---|---|
| Search-to-purchase rate | Purchases divided by internal searches | The core liquidity measure — rising |
| Blended take rate | Net revenue divided by GMV | Stable or rising with ad revenue |
| Buyer CAC payback | CAC divided by 12-month contribution | Under 6 months |
| Seller activation rate | Sellers with a live listing divided by signups | Above 60% |
| Supply concentration | Share of GMV from the top 10 sellers | Falling below 40% |
| Repeat purchase rate | Buyers with 2+ orders in 90 days | Rising, cohort by cohort |
Rule 11 — report net revenue beside every GMV number. A campaign that grows GMV while diluting take rate is a cost, not a win.
Common challenges in marketing online marketplaces
Each of these has a marketing answer, and none of them is "spend more".
| Challenge | What it looks like in the data | Response |
|---|---|---|
| Cold-start categories | High traffic, near-zero conversion | Pause demand spend, subsidise supply |
| Leakage off-platform | Messages up, transactions flat | Make on-platform payment the better deal |
| Seller churn | Listings decline month on month | Monthly performance emails and payout speed |
| Duplicate and thin content | Indexed pages far exceed ranking pages | Ingestion rules plus selective indexing |
| Fraud and fake reviews | Review spikes without order spikes | Verified-purchase gating and enforcement |
| Competing with Amazon and Walmart | Losing head terms, winning long tail | Compete on curation and niche depth, not price |
Walmart's own seller marketplace programme is a useful benchmark for what sellers now expect as table stakes: fast onboarding, transparent fees and demand visibility before they commit inventory.

A 90-day marketplace marketing plan
| Window | Supply side | Demand side | Proof point |
|---|---|---|---|
| Days 1 to 14 | Audit categories against the 20-listing floor | Brand search only | Liquidity map by category |
| Days 15 to 30 | Outbound to 200 target sellers | Fix feed rejections below 5% | Activated sellers, feed pass rate |
| Days 31 to 45 | Launch the seller handbook | Category page template rebuild | Organic impressions on templates |
| Days 46 to 60 | Referral loop live | Shopping ads on the 3 deepest categories | ROAS versus inverse take rate |
| Days 61 to 75 | Monthly seller performance email | Weekly new-supply digest | Repeat purchase rate by cohort |
| Days 76 to 90 | Premium seller tier test | Retargeting with frequency caps | Net revenue per buyer |
Limit 12: 90 days is enough to prove liquidity in one category, not to scale five. If you want that plan run against your own numbers, talk to us, or read more platform teardowns on the Web Tonic blog.
FAQ
What are the best marketing strategies for online marketplaces?
Sequence them. Fix supply depth first, then capture existing demand through search engine optimization and shopping ads, then add email marketing for repeat purchase, and only then layer paid social prospecting. The best marketplace marketing strategy is whichever one raises search-to-purchase rate at your current stage.
How do you attract sellers and buyers at the same time?
You usually should not weight them equally. Constrain the problem to one niche or one city, get to roughly 20 live listings per category with 80% of the budget on supply, then flip the ratio as conversion rises. Trying to grow both sides uniformly across a broad catalogue is how most multi vendor marketplaces stall.
What marketing channels work best for scaling an online marketplace?
Organic search and email carry the unit economics, because a 12% take rate rarely supports a $5.42 CPC on cold traffic. Paid search works where supply is deep and margins are above average. Seller-funded sponsored listings become the largest lever once several sellers compete per keyword.
How is marketplace marketing different from ecommerce marketing?
An online store keeps the full gross margin on each sale; a marketplace keeps a commission, typically 8% to 20%. That single difference lowers the allowable customer acquisition cost, raises the importance of repeat purchase, and adds an entire second audience — sellers — that a retailer never has to market to.
Which metrics prove marketplace marketing is working?
Search-to-purchase rate, seller activation rate, blended take rate, buyer CAC payback and repeat purchase rate. GMV growth on its own proves nothing, because it can rise while net revenue per order falls.
Sources
Amazon Seller Central selling fee schedule and new seller incentives · eBay Inc. Q4 and full-year 2025 results · Google Merchant Center product data specification · Google Search Central product structured data documentation · US Census Bureau quarterly ecommerce report · WordStream ecommerce marketing and Google Shopping ads guides · Ahrefs product page SEO guide · Amazon Ads Sponsored Products · TikTok Shop for business · Walmart Marketplace · FTC endorsement guides FAQ. Figures current as of August 2026.