Table of contents
Webflow passes all three Core Web Vitals on 68.9% of sites against 49.3% for WordPress — a real 19.6-point platform advantage. Mortgage landing pages convert at 2.80% while well-built lender pages reach 8–15%. The platform gap is smaller than the conversion gap, and only one of them is a rebuild.
Key Takeaways
- Field data shows 68.9% of Webflow origins pass all three Core Web Vitals versus 49.3% of WordPress origins.
- Good-TTFB share is 55.5% on Webflow against 24.8% on WordPress.
- Webflow ships the lightest combined mobile payload of the four major builders: 918 KB JavaScript plus 855 KB images.
- Wix leads default CWV pass rate at 80.7% and Squarespace at 70.2% — Webflow is third, not first.
- A separate 2026 analysis reports the same gap at 58% versus 42%, with median mobile INP of 190ms on Webflow.
- Webflow holds roughly 1.2% of identified-CMS share and 1.5% among the top one million sites; WordPress holds 59.1%.
- Webflow powers about 822,550 active websites, roughly 0.8% of all sites.
- Mortgage landing pages convert at 2.80% versus a 4.02% all-industry average.
- Mortgage Google Ads conversion rate is 3.40% against 4.40% all-industry.
- Typical mortgage landing pages convert at 2–4% on cold paid traffic; strong ones reach 8–15%.
- Every 1-second LCP improvement corresponds to a +8.4% conversion lift across 184 page-speed A/B tests.
- Pages with LCP under 2.5s convert 34.2% better than pages over 4s; mobile INP under 200ms adds +22%.
- Financial services website redesigns average 295% ROI with a 9.1-month break-even and 32% conversion lift.
- Webflow’s May 2026 pricing update set Premium at 20,000 CMS items and 40 Collections.
- The $2,500/month Team plan raises Collections to 100 but keeps the 20,000 item ceiling.
- One documented site runs 15,600 items across 24 Collections — 78% of the Premium item ceiling — with five automated collections holding ~90%.
- Real estate and mortgage account for roughly 3% of ADA website lawsuits, with typical settlements of $25,000–$100,000+.
- 19 of 38 of the largest US bank homepages had at least one automated WCAG 2.1 AA violation.
The Platform Gap Is Real — and Webflow Is Not First
The cleanest 2026 evidence comes from Chrome UX Report field data via the HTTP Archive May 2026 crawl, aggregated across every origin detected on each platform. It rewards Webflow against WordPress and complicates the usual sales pitch.
| Metric (mobile) | Webflow | WordPress | Squarespace | Wix |
|---|---|---|---|---|
| CWV pass rate (all three) | 68.9% | 49.3% | 70.2% | 80.7% |
| Good TTFB share | 55.5% | 24.8% | 80.8% | 66.9% |
| Median JavaScript weight | 918 KB | 692 KB | 1,571 KB | 1,707 KB |
| Median image weight | 855 KB | 1,029 KB | 1,111 KB | 185 KB |
| Optimisation ceiling | Medium–high | Very high | Low | Low |
| SEO capability | Good | Best in class | Basic | Basic |
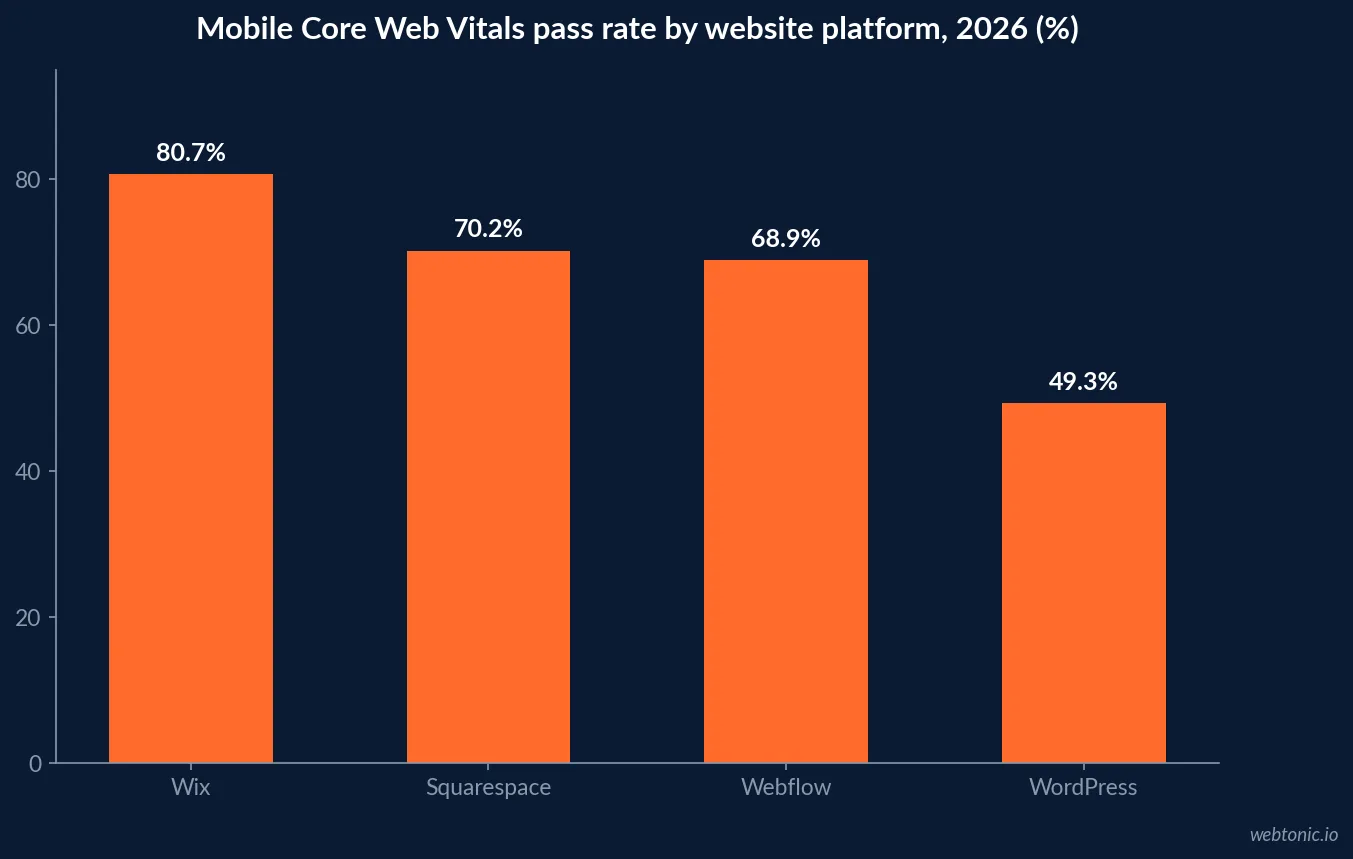
Three honest readings. First, the Webflow-over-WordPress gap is 19.6 points in this dataset, which is large. Second, Webflow is third of four — Wix and Squarespace beat it on default pass rate, so “fastest platform” is not a defensible claim. Third, WordPress ships the lightest JavaScript of the four and trails mainly because it is deployed across a far wider range of hosting quality. A different 2026 analysis reports the same direction at 58% versus 42% with a median mobile INP of 190ms on Webflow; both agree on the ranking and disagree on magnitude, which is what you would expect from different crawl samples and dates.
For a lender the useful framing is risk reduction, not speed maximisation. A Webflow build removes plugin sprawl, unmanaged hosting and the deferred-maintenance failure mode that produces the numbers in our mortgage WordPress statistics and our mortgage technical SEO statistics.
The Conversion Gap Is Bigger Than the Platform Gap
This is the part that decides whether a rebuild pays for itself. Mortgage benchmarks sit below all-industry averages on every conversion metric.
| Metric | Mortgage benchmark | All-industry average | Gap |
|---|---|---|---|
| Landing page conversion rate | 2.80% | 4.02% | −30% |
| Google Ads conversion rate | 3.40% | 4.40% | −23% |
| Google Ads CTR | 2.64% | 3.17% | −17% |
| Email open rate | 21.2% | 21.5% | Level |
| Well-built lender landing page | 8% – 15% | — | 3–5x the industry norm |
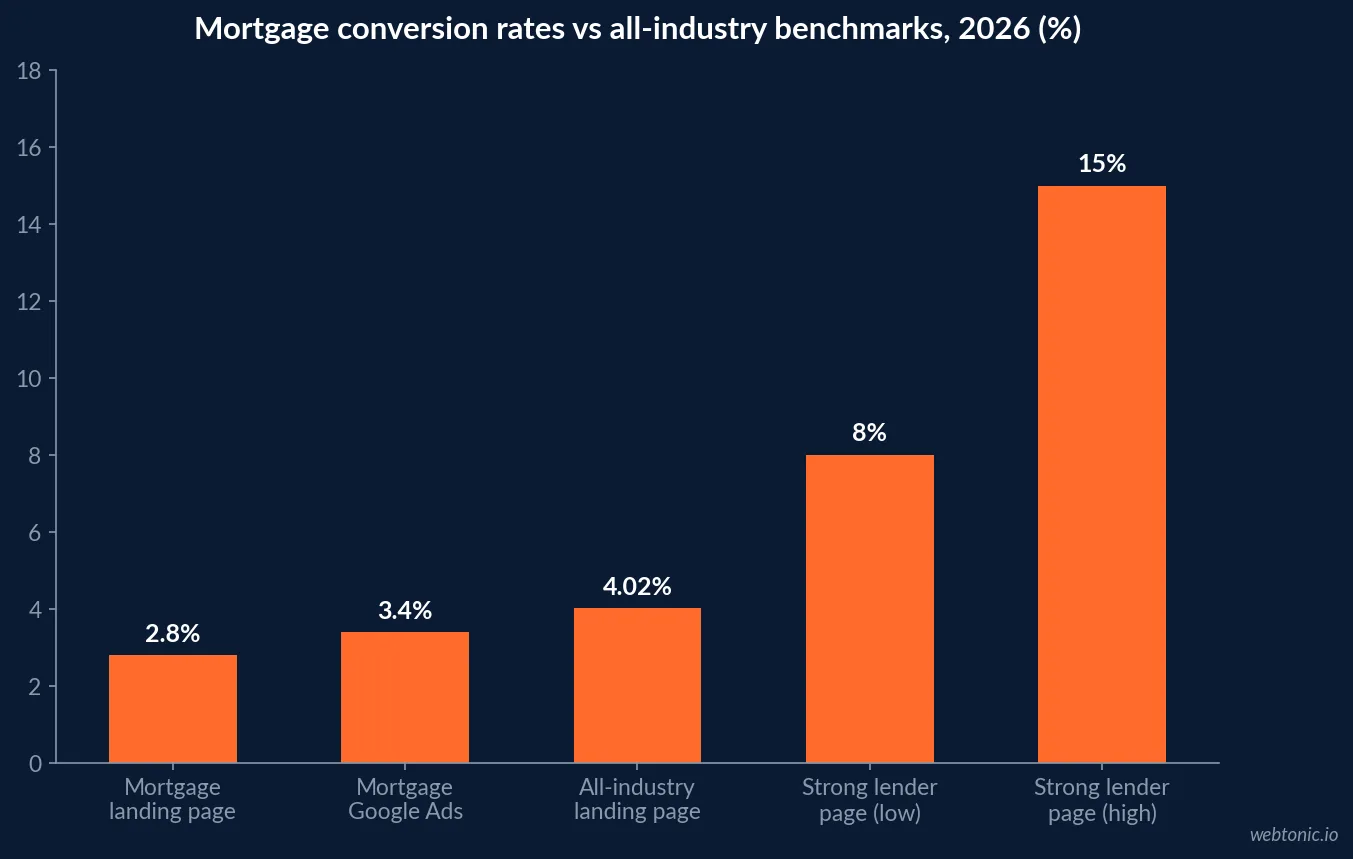
Read the last row against the first. The distance between an average mortgage page at 2.80% and a well-built one at 8–15% is far larger than the 19.6-point platform difference. The elements credited with that gap are a message-matched headline, the loan officer’s photo, a three-field form, TCPA consent language, specific social proof and a calculator lead magnet — plus sub-five-minute first contact. Every one of those is content, structure and operations. Webflow makes them faster to ship; it does not supply them.
Speed still carries measurable value on top. Across 184 page-speed A/B tests, each one-second LCP improvement corresponded to a +8.4% conversion lift, pages under 2.5 seconds converted 34.2% better than pages over four seconds, and mobile pages with INP under 200ms converted +22% above slower pages. Combine that with the funnel economics in our mortgage landing page statistics and the business case writes itself in applications rather than Lighthouse points.
What a Rebuild Returns in Financial Services
Vendor-published redesign benchmarks should be read as directional, but the sector ordering is consistent across sources.
| Sector | Average ROI | Break-even | Lead-quality improvement | Conversion lift |
|---|---|---|---|---|
| Legal services | 485% | 6.2 months | 58% | 41% |
| Healthcare | 378% | 7.8 months | 45% | 35% |
| Real estate | 312% | 7.9 months | 49% | 31% |
| Financial services | 295% | 9.1 months | 38% | 32% |
| B2B SaaS | 265% | 10.4 months | 61% | 45% |
| E-commerce | 189% | 5.6 months | 34% | 22% |
Financial services averages 295% ROI over a 9.1-month break-even — the longest payback of the high-ROI sectors, because lending cycles are long and lead quality improves before funded volume does. The same dataset puts the optimal investment band at $22,000–$45,000, where conversion-focused UX, technical SEO, page speed and content are all addressed without enterprise complexity, and reports that pairing design work with a structured content strategy delivered up to 70% higher total ROI than design-led projects alone. For a brokerage, that is an argument for shipping the loan-program and city page system in the same project, not a phase two.
Where Webflow Sits in the Market
Platform choice is also a hiring and longevity decision, so the market numbers matter. W3Techs puts Webflow at roughly 1.2% of sites with an identified CMS, rising to 1.5% among the top one million, while WordPress holds 59.1% overall and 49.4% of the top million.
| Market signal | Figure | Implication for a lender |
|---|---|---|
| Webflow share of identified CMS | ~1.2% | Smaller talent pool than WordPress |
| Webflow share, top 1M sites | ~1.5% | Over-indexed among larger sites |
| WordPress share of identified CMS | 59.1% | Default hiring market |
| Active Webflow sites | ~822,550 | Mature enough for a regulated business |
| Webflow share of all websites | ~0.8% | Growth from ~0.4% in 2021 |
| Most common Webflow vertical | Business and finance | Precedent exists in the sector |
Around 822,550 active sites and roughly 0.8% of all websites put Webflow well past experimental, and CMS market analysis notes adoption concentrated in B2B SaaS, agencies and design-led brands. Two cautions for a mortgage decision-maker: the flattering share figures come from small-base growth rates, and a smaller ecosystem means fewer contractors who can take over the build later. Negotiate handover documentation into the contract.
The CMS Ceilings a Lender Will Actually Hit
Webflow simplified plans on 13 May 2026, raising CMS limits and removing item add-ons. Most articles describing Webflow limits predate that change.
| Plan | CMS items | Collections | Notes |
|---|---|---|---|
| Premium | 20,000 | 40 | The practical tier for a lender site |
| Team ($2,500/mo) | 20,000 | 100 | Buys Collections, not items |
| Enterprise | Negotiated | Negotiated | Includes localisation and AEO features |
Practitioner analysis of the new ceilings makes the distinction that matters: item count stops tracking editorial effort the moment a pipeline is involved. A documented client site runs 15,600 items across 24 Collections — 78% of the Premium item ceiling — with five automated collections holding about 90% of the total, while its human-written collections hold three news posts, nine testimonials and nineteen FAQs.
Mortgage sites reach these ceilings through the exact strategy that works for them: metro × loan-program pages, rate tables, branch directories and licensing pages. Three planning rules follow. Flatten any taxonomy that does not need its own URL into an option field, because Collections often bind before items on editorial sites. Model bandwidth as well as items — on data-heavy sites bandwidth typically bites first, and the in-product remedy is a sales call. And remember that upgrading from Premium to Team buys Collections, not items, so an item-constrained site gains nothing from $2,500 a month. That structural planning is the same discipline behind our mortgage local SEO statistics.
Accessibility Is a Lending-Specific Liability
One risk category is materially higher for mortgage than for most Webflow buyers, and it is rarely in the proposal. Real estate and mortgage account for roughly 3% of ADA website lawsuits, with mortgage calculators, property search interfaces and document upload portals named as the recurring barrier sources — and lenders carry additional Fair Housing Act exposure that extends the legal theory beyond the ADA alone.
| Exposure | 2026 data point | Where it shows up on a lender site |
|---|---|---|
| Share of ADA web lawsuits | ~3% real estate / mortgage | Calculators, search, upload portals |
| Typical settlement range | $25,000 – $100,000+ | Plus remediation and legal fees |
| Large-bank homepage audit | 19 of 38 had a WCAG 2.1 AA violation | Contrast on rate tables, unlabeled fields |
| Applicable standard | WCAG 2.1 / 2.2 Level AA | The practical compliance benchmark |
| Additional statute for lenders | Fair Housing Act | Broader than ADA Title III alone |
A scan of 38 of the largest US bank homepages found exactly half — 19 — with at least one automated WCAG 2.1 AA violation, most commonly colour contrast on rate tables and unlabeled form fields. A rebuild is the cheapest moment in a site’s life to fix that: contrast tokens, labelled inputs, keyboard-navigable calculators and focus states cost hours at design time and thousands after a demand letter.
How to Decide
The data supports a narrow, defensible recommendation rather than a platform allegiance.
- Choose Webflow if the constraint is publishing speed. A 68.9% versus 49.3% pass rate and no plugin maintenance is worth real money to a marketing team without developers.
- Stay on WordPress if you have engineering. It has the highest optimisation ceiling and the best SEO tooling; the field gap is a deployment artefact, not a verdict.
- Fix the page before the platform. 2.80% to 8–15% is a bigger prize than any migration.
- Model CMS capacity first. 20,000 items and 40 Collections on Premium, with bandwidth as the likely first ceiling.
- Budget in the $22,000–$45,000 band and expect a 9.1-month break-even in financial services.
- Ship accessibility with the build. WCAG 2.1 AA on calculators and forms, before a demand letter arrives.
- Instrument funded loans, not sessions. Our data intelligence practice ties site changes to funded volume, which is the only ROI number a principal will accept.
- Negotiate handover documentation. A ~1.2% CMS share means a smaller pool of contractors able to inherit the build.
Migrating platforms is a legitimate decision with a measurable payoff, and it is the second-most valuable thing most lender sites could do. The first is the conversion work described in our mortgage digital marketing statistics — which Webflow will help you ship faster and will not do for you.
Frequently Asked Questions
Is Webflow faster than WordPress for a mortgage website?
In field data, yes — measurably but not decisively. Chrome UX Report data via the HTTP Archive May 2026 crawl shows 68.9% of Webflow origins pass all three Core Web Vitals versus 49.3% of WordPress origins, with good-TTFB share of 55.5% against 24.8%. Webflow also ships the lightest combined mobile payload of the four major builders (918 KB JS plus 855 KB images). A separate 2026 analysis reports the same direction with different absolute numbers — 58% versus 42%. The caveat every honest comparison includes: a lean WordPress site on good hosting beats a bloated Webflow site with heavy custom code.
What conversion rate should a mortgage website expect?
Industry benchmarks put mortgage landing page conversion at 2.80% against a 4.02% all-industry average, and Google Ads conversion rate at 3.40% versus 4.40%. Purpose-built lender pages perform far better: typical mortgage landing pages convert at 2–4% on cold paid traffic while strong ones reach 8–15%. The six elements credited with the difference are a message-matched headline, the loan officer’s photo, a three-field form, TCPA consent, specific social proof and a calculator lead magnet — plus sub-five-minute first contact. None of those are platform features.
What are Webflow's CMS limits after the May 2026 pricing change?
Webflow simplified plans on 13 May 2026 and raised CMS ceilings while removing item add-ons. The Premium plan now includes 20,000 CMS items and 40 Collections; the Team plan at $2,500/month raises Collections to 100 but keeps the same 20,000 item ceiling. For a lender the binding constraint is usually Collections rather than items — blog, authors, categories, loan programs, locations, team, testimonials, FAQs and job listings consume the allowance quickly. On data-heavy sites bandwidth typically bites before either limit.
Does Webflow work for programmatic mortgage location pages?
Yes, and that is where the item ceiling becomes real. Templated city, county and loan-program pages are a legitimate SEO strategy that consumes CMS items at a rate no editorial calendar matches — one documented client site sits at 15,600 items across 24 Collections, 78% of the Premium ceiling, with five automated collections accounting for about 90% of the total. If a lender plans metro × program pages, model both item count and bandwidth up front, flatten taxonomies that do not need their own URL, and consider rendering non-URL data outside the CMS.
What is the ROI of rebuilding a mortgage website?
Industry redesign benchmarks put financial services at 295% average ROI with a 9.1-month break-even, a 38% lead-quality improvement and a 32% conversion-rate lift; real estate sits at 312% and 7.9 months. Page-speed testing adds a mechanism: across 184 A/B tests, every one-second LCP improvement corresponded to a +8.4% conversion lift, and pages under 2.5 seconds converted 34.2% better than pages over four seconds. Treat those as directional vendor benchmarks and validate against your own funded-loan data.
Sources
PageSpeed Matters — WordPress vs Webflow vs Squarespace vs Wix (CrUX, May 2026)
The Stacc — WordPress vs Webflow for SEO 2026
W3Techs — WordPress vs Wix vs Webflow Usage, July 2026
Popupsmart — Webflow Statistics 2026
Visionary Marketing — CMS Market Share Report 2026
Webflow — Simplified Plans and Updated Pricing 2026
The Small Square — Webflow CMS Limits 2026
Benchmarketing — Mortgage Marketing Benchmarks 2026
BNTouch — Mortgage Landing Pages That Convert 2026
Siana — Website Redesign ROI Statistics 2026
Visionary Marketing — Conversion Benchmark Report 2026
Scrutia — Industries Targeted by ADA Website Lawsuits 2026