Table of contents

The average mortgage and loan website takes 10.5 seconds to render its main content — 8 seconds past Google’s threshold — while 71% of lender sites score below 70 on PageSpeed and finance ranks last of eight verticals on Core Web Vitals at 38.9%. Technical SEO is the cheapest unbought advantage in this industry.
Key Takeaways
- Across 284 mortgage and loan websites, average Largest Contentful Paint is 10.5 seconds against a 2.5-second “good” threshold.
- Average First Contentful Paint is 4.09 seconds, versus a 1.8-second bar.
- The average mortgage site scores 58/100 on PageSpeed performance, 86 on SEO and 84 on accessibility.
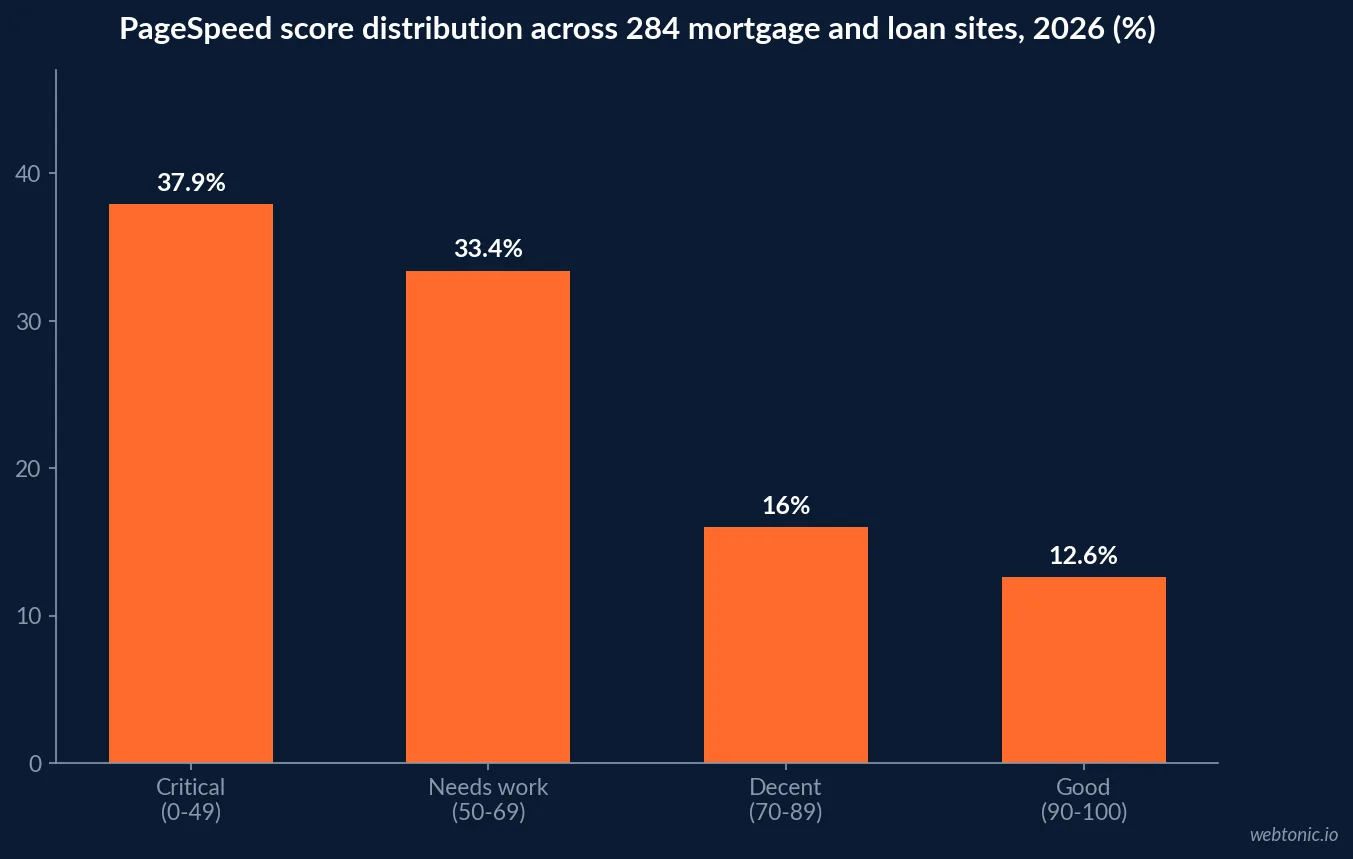
- 71% of lender sites score below 70 on PageSpeed; 37.9% land in the critical 0–49 band.
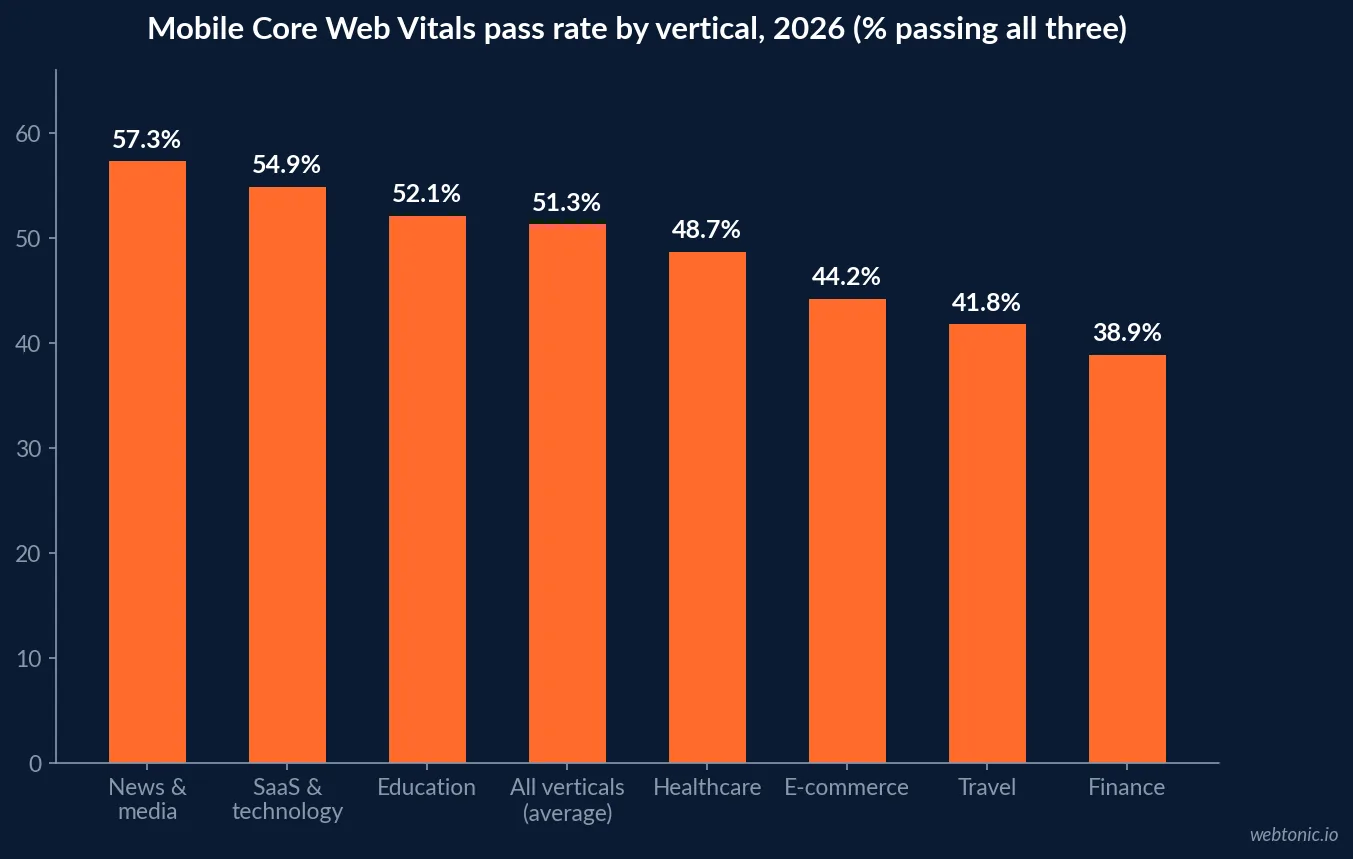
- Finance passes all three Core Web Vitals on mobile at just 38.9% — last of eight verticals and 12 points below the 51.3% average.
- Mobile pass rates by metric run 63.7% LCP, 71.2% INP and 78.9% CLS; desktop reaches 67.8% on all three.
- Slow main content affects 75.9% of mortgage sites and duplicate titles 70.3%.
- 45.5% of lender sites have no sitemap and 37.8% have no robots.txt.
- Structured data appears on only 56.6% of mortgage sites; canonical tags on 60.5%.
- 23 of the 284 sites audited still run without SSL.
- Roughly 94% of crawler fetches are HTML and only 5.62% JavaScript — most crawlers never execute your application.
- Only 45.9% of crawler requests across the web return a 200; 403 Forbidden is the largest non-200 bucket at 20.6%.
- Verified AI bots get a 200 back 73.0% of the time versus 33.3% for non-AI bots.
- Bounce rate climbs from 34.9% at a 1–2 second load to 67.2% beyond 10 seconds.
- Core Web Vitals pass rates collapse by connection: 58.2% on 4G, 31.7% on 3G, 8.3% on 2G.
- 71% of sites deploy schema but only 22% pass the Rich Results Test cleanly across every type.
- A 2-second delay is associated with a 15–25% reduction in conversion rate on lending sites.
- Sites passing all three Core Web Vitals see roughly 24% fewer bounces.
The Mortgage Industry’s Technical Baseline
A full diagnostic crawl of 284 US mortgage and loan websites produces the clearest picture of where the industry actually stands. It is not flattering, and that is the opportunity: almost every competitor in a given metro shares the same defects.
| Metric | Mortgage & loan average | Google threshold | Gap |
|---|---|---|---|
| Largest Contentful Paint | 10.5s | 2.50s | 8.0s over |
| First Contentful Paint | 4.09s | 1.80s | 2.3s over |
| Cumulative Layout Shift | 0.06 | 0.10 | Passing |
| Time to First Byte | 0.09s | 0.80s | Passing comfortably |
| PageSpeed performance score | 58/100 | 90+ | 32 points below |
| PageSpeed SEO score | 86/100 | 90+ | 4 points below |
The shape of that data is diagnostic. Time to First Byte averages a healthy 0.09 seconds and layout shift passes at 0.06, so servers and CSS are not the problem. The failure sits between the first byte and the main content — render-blocking scripts, unoptimised hero imagery, rate-engine embeds and tag sprawl. That is a front-end problem, and front-end problems are fixable in weeks rather than quarters.
Finance Is Last on Core Web Vitals — and That Is Structural
Vertical-level CrUX analysis ranks finance dead last: 38.9% of mobile origins pass all three Core Web Vitals, against a 51.3% average and 57.3% for news and media. The cited causes are compliance scripts, authentication flows and security widgets that load ahead of content — and in lending, several of those really are non-negotiable.
Independent measurement agrees on the direction while differing on the sample. One 2026 industry study puts banking and finance at 38.9% LCP pass with a 2.2-second median LCP and 200ms INP, while another dataset notes that 43% of all websites still fail the 200ms INP bar and that finance is the highest-impact vertical for performance work — roughly 24% of top US finance URLs would gain from passing Core Web Vitals.
| Metric | Mobile pass rate | Desktop pass rate | Where mortgage sites usually fail |
|---|---|---|---|
| LCP | 63.7% | 78.4% | Hero images, rate widgets, web fonts |
| INP | 71.2% | 89.1% | Calculator scripts, chat, tag managers |
| CLS | 78.9% | 82.3% | Late-loading banners and disclosures |
| All three | 51.3% | 67.8% | The mobile gap is the whole problem |
Note the 16-point mobile-to-desktop gap. Since mortgage research is overwhelmingly mobile-first, a lender optimising on a desktop Lighthouse run is measuring the version of the site that already passes. Field data on real devices and real connections is the only number that matters, and connection-level data shows pass rates falling from 58.2% on 4G to 31.7% on 3G and 8.3% on 2G.
What Speed Costs a Lender in Applications
Speed arguments fail in mortgage because they are made in milliseconds instead of applications. The bounce-by-load-time curve converts it into something a sales leader can act on.
| Load time | Desktop bounce rate | Mobile bounce rate | Relative increase |
|---|---|---|---|
| 1–2 seconds | 34.9% | 38.7% | +13% |
| 2–3 seconds | 38.5% | 43.2% | +25% |
| 3–4 seconds | 44.7% | 50.1% | +45% |
| 4–6 seconds | 49.3% | 55.8% | +60% |
| 6–10 seconds | 60.8% | 67.4% | +97% |
| Over 10 seconds | 67.2% | 74.1% | +118% |
The industry average of 10.5 seconds sits in that bottom row. Mortgage-specific benchmarking across 38 lending firms puts the conversion cost of a 2-second delay at 15–25%, and sites passing all three Core Web Vitals record roughly 24% fewer bounces. Applied to a lender doing 1,000 monthly visits at a 2.8% landing-page conversion rate, moving from the 6–10 second band to the 2–3 second band recovers enough sessions to add several applications a month without a dollar of extra media. The same arithmetic underpins our mortgage landing page statistics.
Crawlers Do Not Wait, and Most Never Run JavaScript
This is the finding that has changed technical SEO priorities most in 2026. Crawl-log analysis in the 2026 SEO benchmarks report shows roughly 94.38% of crawler fetches are HTML against only 5.62% JavaScript. Crawlers are overwhelmingly reading server-rendered markup, not executing applications. Google’s own crawling documentation confirms that rendering is a separate, later, resource-limited step with a 2MB per-resource cap.
Major AI crawlers do not render JavaScript at all. So a lender whose rate table, branch directory or program pages are client-side rendered is invisible to the systems that increasingly answer borrower questions. The AI crawler ecosystem now splits roughly into Google’s AI crawlers at 24.9%, ClaudeBot at 20.0%, Meta-ExternalAgent at 10.2% and GPTBot at 9.6% of AI crawl volume.
| Client type | 200 OK rate | 403 rate | Share of requests |
|---|---|---|---|
| Mixed-purpose bots | 73.4% | 5.2% | 3.3% |
| Verified AI bots | 73.0% | 13.5% | 5.7% |
| Human traffic | 54.5% | 12.9% | 42.5% |
| Non-AI bots | 33.3% | 29.2% | 48.5% |
| All requests (blended) | 45.9% | 20.6% | 100% |
The crawl waste data carries a warning for lenders with aggressive bot management: only 45.9% of crawler requests web-wide return a 200, 403 Forbidden is the largest non-200 bucket at 20.6%, and the refusals land hardest on non-AI bots — the same class as your rank tracker and uptime monitor. Verified AI bots see a 73.0% success rate. If a security team “blocked the AI crawlers,” check what the rule actually caught.
The Cheap Wins Most Lender Sites Have Not Made
Ranked by prevalence across the 284-site sample, these are the defects that recur — and none of them requires a redesign.
| Issue | Share of mortgage sites affected | Impact | Typical fix effort |
|---|---|---|---|
| Main content takes too long to appear | 75.9% | High | Weeks |
| Duplicate page titles | 70.3% | Medium | Hours |
| No sitemap found | 45.5% | High | Hours |
| Broken links | 38.5% | Medium | Hours |
| No robots.txt found | 37.8% | High | Minutes |
| Missing structured data | 43.4% | Medium | Days |
| Missing canonical tag | 39.5% | Medium | Hours |
| Missing meta description | 35.3% | Low–medium | Hours |
Two of those deserve emphasis for lenders specifically. Missing robots.txt and sitemap on roughly four in ten sites is a crawl-efficiency problem in an industry that publishes large volumes of location and program pages — exactly the templates covered in our mortgage local SEO statistics. And duplicate titles on 70.3% of sites are usually generated by templated city or loan-type pages, which means one templating fix resolves hundreds of URLs at once.
Structured Data: Deployed Is Not the Same as Valid
Only 56.6% of mortgage sites publish JSON-LD at all. Across the broader web, a 5,000-site schema audit pattern repeats everywhere: 71% of sites deploy at least one schema type but only 22% pass Google’s Rich Results Test cleanly across every detected type. The gap between deployed and valid is the most under-priced lever in technical SEO right now.
On the AI question, be honest about the disagreement. One 2026 study reports AI Overview citations running 3.1x higher on schema-valid pages with FAQPage at 3.4x, while other analyses argue the AI-citation uplift has failed replication and only rich-result gains are established. The defensible position for a lender: implement Organization, LocalBusiness, BreadcrumbList, Article and FAQPage correctly for rich results, validate everything, and treat any AI benefit as upside rather than the business case.
A Technical SEO Sequence for a Mortgage Site
Given the baseline above, priority order matters more than the checklist. This sequence puts the highest-yield work first for a typical lender or brokerage site.
- Fix the render path before anything else. With LCP averaging 10.5 seconds and TTFB already at 0.09s, the wins are in image formats and sizing, font loading, deferred third-party tags and lazy-loaded rate widgets.
- Serve content server-side. If rate tables, calculators, location pages or program details are client-rendered, pre-render or move them to SSR — 94% of crawl fetches never run your JavaScript.
- Restore crawl basics. Publish a real sitemap and robots.txt, fix broken links, and confirm bot rules are not refusing legitimate crawlers with 403s.
- De-duplicate templated titles. One templating change usually clears the 70.3% duplicate-title problem across every city and loan-type page.
- Measure on mobile field data. The mobile-to-desktop gap is 16 points; optimise the version borrowers actually use, on 4G and 3G.
- Validate structured data, then extend it. Move from deployed to valid before adding new types.
- Protect trust signals. SSL everywhere — 23 of 284 lender sites still trigger a browser warning on pages that collect personal financial data.
- Instrument the outcome. Tie speed work to applications started and completed, not to Lighthouse scores; our data intelligence practice models this against funded volume.
Technical work of this kind compounds with content rather than competing with it. The same crawl efficiency that helps Googlebot index a new city page faster also determines whether an AI engine can read it at all, which is why we sequence it ahead of publishing volume in our mortgage SEO statistics guidance and platform notes in our mortgage WordPress statistics.
Frequently Asked Questions
How fast should a mortgage website load in 2026?
Largest Contentful Paint must land under 2.5 seconds to count as “good,” and the average mortgage and loan site measured across 284 production websites takes 10.5 seconds — 8 seconds over the threshold. First Contentful Paint averages 4.09 seconds against a 1.8-second bar. The business cost is measurable rather than theoretical: bounce rate climbs from roughly 34.9% at a 1–2 second load to 67.2% beyond 10 seconds, and each additional second of load time is associated with a 7–12% drop in conversions. For a lender, a three-second improvement on a 1,000-visit month is worth several extra applications.
Why does finance rank last on Core Web Vitals?
Because compliance and security tooling loads before content. Finance passes all three Core Web Vitals on mobile at 38.9%, the lowest of eight verticals measured and roughly 12 points below the 51.3% average. The structural causes are consistent: regulatory disclosure scripts, authentication flows, chat and identity widgets, rate-engine embeds and tag-manager sprawl. Many of these are genuinely required. The fixable share is usually third-party tags and unoptimised hero media, not the compliance layer itself.
Do AI crawlers read mortgage websites differently from Google?
Yes, and the difference decides whether your content exists inside AI answers. Roughly 94% of crawler fetches are raw HTML and only about 5.6% are JavaScript, because major AI crawlers do not execute JavaScript at all. Google renders, but rendering costs crawl budget and delays indexing. If your rate tables, location pages or FAQ content are client-side rendered, Googlebot may eventually see them and GPTBot, ClaudeBot and PerplexityBot never will. Server-side rendering or pre-rendering is now a requirement rather than a preference for lenders that want AI visibility.
What are the most common technical SEO problems on mortgage sites?
The audit of 284 lender sites is blunt about it: slow main content on 75.9% of sites, duplicate page titles on 70.3%, no sitemap on 45.5%, broken links on 38.5% and no robots.txt on 37.8%. Structured data appears on only 56.6% of sites, canonical tags on 60.5% and meta descriptions on 64.7%. Twenty-three of the 284 sites had no SSL at all. Most of these are hours of work, not a rebuild, which is why technical SEO usually outperforms additional content spend on a mortgage site.
Is schema markup worth implementing on a mortgage site?
Yes for rich results, with realistic expectations about AI. Site audits find 71% of sites deploy at least one schema type but only 22% pass Google's Rich Results Test cleanly across every detected type — the gap between deployed and valid is the cheapest lever available. Some research reports AI Overview citations running 3.1x higher on schema-valid pages, while other analyses argue the AI-citation uplift is not established. Treat rich results (FAQ, review, organization, local business) as the reliable payoff and any AI-citation benefit as an unpriced bonus.
Sources
Borah Labs — Mortgage & Loans Website Benchmarks (284 sites)
JustAnalytics — Core Web Vitals Statistics 2026
SEOmator — Crawl Waste Report 2026
SEOmator — 2026 SEO Benchmarks Report
Searchlab — Technical SEO Statistics 2026
PageSpeed Matters — Fastest and Slowest Industries 2026
The Stacc — Core Web Vitals Statistics 2026
Digital Applied — Bounce Rate Benchmarks 2026
Google Search Central — Inside Googlebot: Crawling, Fetching and Rendering
Json House — AI Crawler Ecosystem 2026
Presenc — State of Schema.org for AI Search 2026
Authority Specialist — Mortgage SEO Benchmarks from 38 Lending Firms