Table of contents

X sells the cheapest reach in paid social — $0.74 average CPC and $5.65 CPM — and the least trusted inventory in it, with only 4% of marketers calling it brand-safe. For a mortgage brokerage that combination leaves exactly one defensible use case.
Key Takeaways
- Average X CPC is $0.74 versus $1.41 on Meta; average CPM is $5.65–$6.46 versus $7.19.
- Reported cost per lead on X is about $41, with CPC ranging $0.20–$1.95 by audience.
- One benchmark set reports a $18.50 median CPA and 2.1% conversion rate; another reports $21.55 CPA at 0.02%.
- Median cost per engagement is $0.03–$0.13; average CTR is about 0.86%.
- Timeline and Trend Takeovers are priced at $150,000–$250,000+ per day.
- X reports 611 million monthly active users and 259 million daily; a separate estimate shows MAU falling 4.9% to ~557 million.
- US monthly active users are about 95.4 million, 15.6% of the global base.
- 63% of X users are on the platform primarily for news and current events.
- 47% of users are lurkers who rarely post; only 8% post daily.
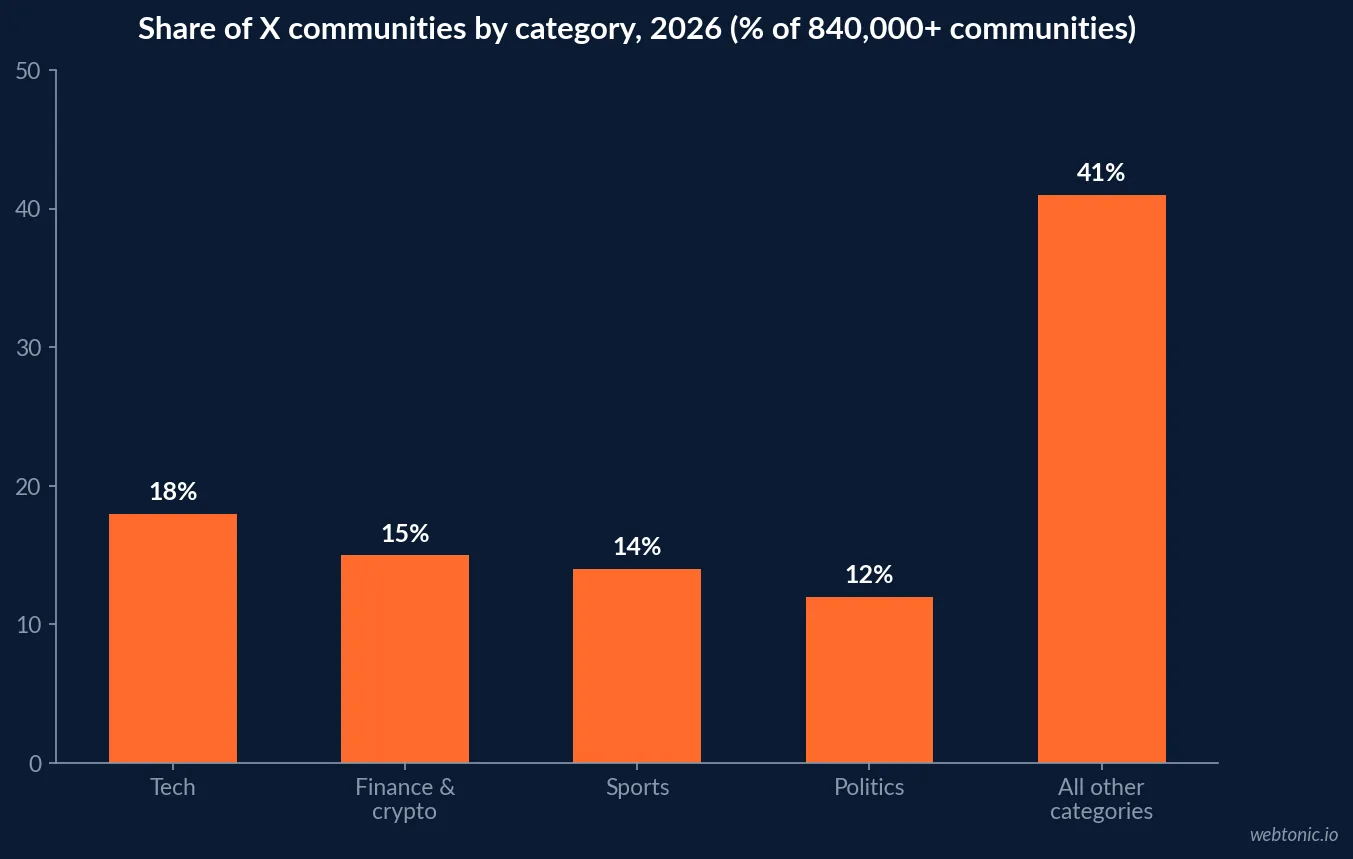
- Finance and crypto make up 15% of more than 840,000 X communities, which generate 2.7x the engagement of the main feed.
- Financial services is the fourth-largest US ad category on X at 11% of 2026 spend.
- Only 4% of marketers consider X ads brand-safe; trust fell from 22% (2022) to 12% (2024).
- 29% of marketers plan to cut X spend, up from 26%, with nearly one in eight exiting.
- X ad revenue reached $1.8 billion in 2025, up 7%, against $4.4 billion in 2022.
- Video views on X grew 42% year over year to about 8.2 billion per day.
- Keyword targeting on X reaches users who recently searched or engaged with a term — the platform’s one structural advantage for rate-driven offers.
- Financial ads must now carry a clickable disclaimer overlay showing regulatory status, license number and risk summary.
- Mortgage landing pages convert at 2.80% against a 4.02% all-industry average — the destination, not the channel, is usually the constraint.
The Cheapest Inventory in Paid Social
Every credible 2026 benchmark set agrees on direction: X is cheap. WebFX-derived benchmarks put X CPC at $0.74 against Meta’s $1.41, with CPM at $6.46 versus $7.19. Searchlab’s aggregation reports an average CPC of $0.74 across a $0.20–$1.95 range, a $5.65 CPM and a cost per lead near $41.
| Metric | X (Twitter) | Meta | |
|---|---|---|---|
| Average CPC | $0.74 | $1.41 | $5.00 – $8.00 |
| Average CPM | $5.65 – $6.46 | $7.19 | $30 – $60 |
| Cost per engagement | $0.03 – $0.13 | — | — |
| Average CTR | ~0.86% | ~0.90% | 0.44% – 0.65% |
| Reported cost per lead | ~$41 | $15 – $45 (mortgage) | $60 – $200 (mortgage) |
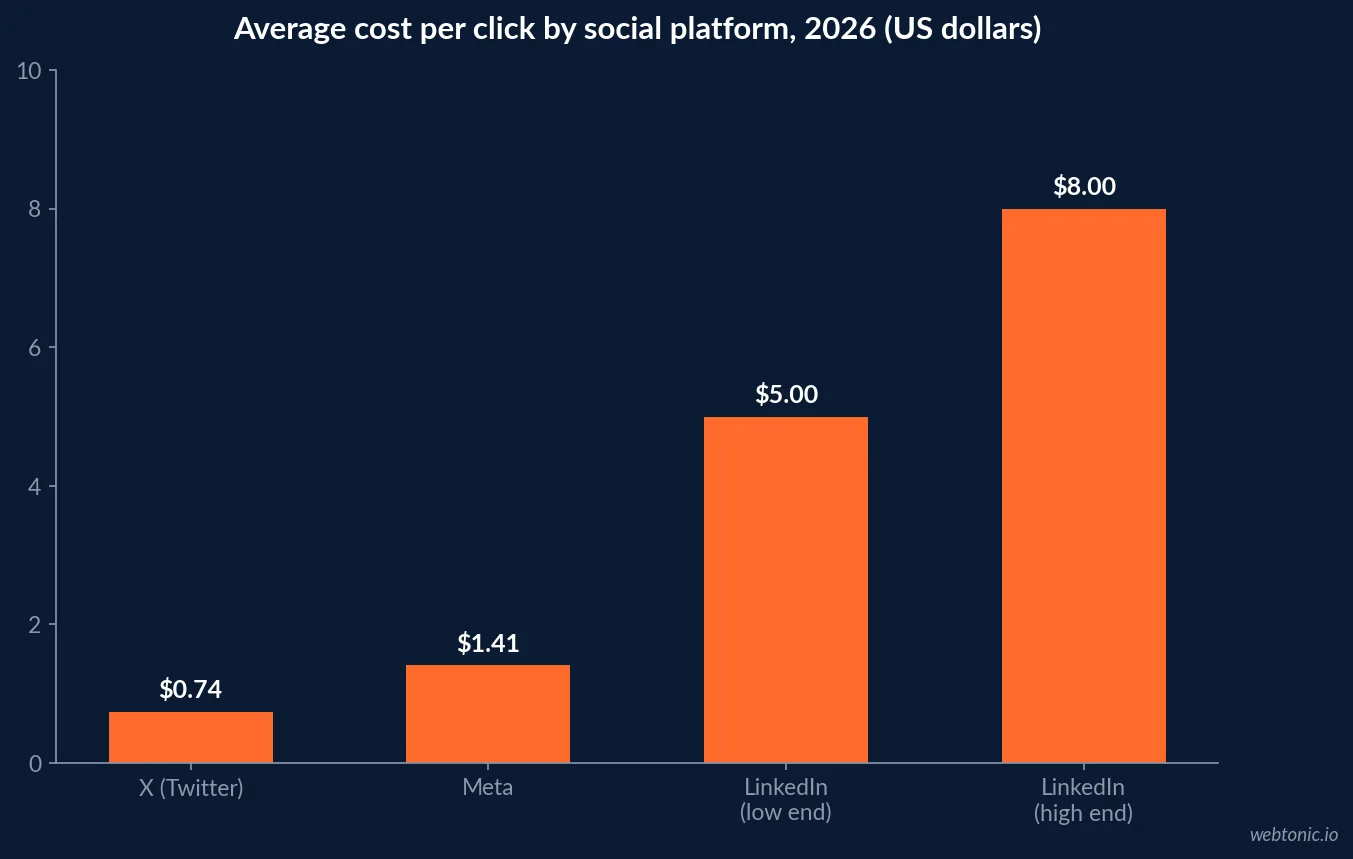
The discount has a cause worth stating plainly: it is a demand problem, not a quality dividend. Ad revenue fell from $4.4 billion in 2022 to $2.6 billion in 2024 before recovering to $1.8 billion in 2025 on the ads line, up 7% year over year but far below pre-acquisition levels. Fewer bidders means lower clearing prices. A lender buying X inventory is buying an auction other advertisers left.
The Conversion Data Contradicts Itself — Read the Scope
This is the most important table in this article, and the reason no lender should plan around an X “average.” Two credible datasets differ by two orders of magnitude on conversion rate because they count different advertisers and different events.
| Source view | Conversion rate | Median CPA | CPC | What is being counted |
|---|---|---|---|---|
| Practitioner median analysis | 2.1% | $18.50 | $0.85 | Direct-response accounts with pixel-tracked events |
| WebFX benchmark range | 1% – 3% | — | $0.50 – $2.00 | Promoted-post campaigns across mixed objectives |
| Large-sample platform aggregation | 0.02% | $21.55 | $0.18 | All campaigns including awareness and engagement |
| Managed takeover inventory | — | — | — | $150K–$250K+ per day, reserved for launches |
Note that CPA lands in the same neighbourhood either way — $18.50 versus $21.55 — while the conversion rate moves from 2.1% to 0.02%. That is a denominator story: the low-conversion dataset includes vast awareness impressions that were never meant to convert. The practical rule for a mortgage account is to ignore blended conversion rate as a planning input and hold the channel to cost per qualified conversation, benchmarked against the mortgage baselines summarised in our mortgage digital marketing statistics.
Who Is Actually on X in 2026
Even the audience size is contested, and both numbers deserve to be published. Statista and X Corp figures show 611 million MAU, up 4.3%, with 259 million daily users and 95.4 million in the US. Other 2026 analysis records MAU falling 4.9% to roughly 557 million — the first sustained decline since 2022 — while US unique visitors held flat at 127–133 million.
| Audience metric | Figure | Source basis | Relevance to a lender |
|---|---|---|---|
| Global MAU (platform reported) | 611M | Statista / X Corp 2026 | Directional only |
| Global MAU (independent estimate) | ~557M, −4.9% YoY | 2026 third-party analysis | The decline is real |
| US MAU | 95.4M | Statista / X Corp 2026 | The market that matters |
| US unique visitors | 127.3M – 132.8M, flat | Comscore via eMarketer | US demand is stable |
| Daily active users | 259M | X Corp / Bloomberg 2026 | Frequency is high among users |
| Primarily there for news | 63% | Pew Research 2026 | The rate-news opportunity |
| Lurkers who rarely post | 47% | Pew Research 2026 | Reach beats engagement metrics |
Two behavioural numbers matter more than the headline user count. 63% use X primarily for news and current events, and 47% are lurkers who read but almost never post — only 8% post daily. A lender evaluating X on engagement rate is measuring the 8%. The audience is a reading audience, which suits rate commentary and suits nothing about a like-and-share campaign.
The One Real Use Case: Rate-News Keyword Targeting
X’s keyword targeting reaches users who recently searched for or engaged with specific terms. In mortgage, demand is event-driven — a Fed decision, a CPI print, a rate headline — and X is where those events are discussed first.
| Trigger event | Keyword cluster to target | Offer that fits | Pause rule |
|---|---|---|---|
| Fed rate decision | fed, rate cut, fomc, mortgage rates | Rate-alert signup | 48 hours after the print |
| Weekly rate survey release | 30-year fixed, freddie mac, rate lock | Lock-versus-float explainer | 72 hours |
| Local market headline | [metro] housing, home prices [metro] | Metro affordability report | 7 days |
| Program or policy change | fha, va loan, dpa, first-time buyer | Eligibility checker | Until coverage fades |
| Competitor outage or news | Brand-adjacent keywords | Comparison landing page | Immediately if tone turns |
The community data supports the same play: more than 840,000 active X communities hold 126 million members, Finance and Crypto is the second-largest category at 15%, and communities generate 2.7x the engagement of the general feed. Video is also being algorithmically favoured, with views up 42% year over year to about 8.2 billion per day — relevant because the cheapest way to explain a rate move is a 45-second clip, the same asset class covered in our mortgage video marketing statistics.
One more datapoint that surprises most brokers: financial services is already the fourth-largest US ad category on X at 11% of 2026 spend, behind media and entertainment (24%), shopping (13%) and software (12%). Finance advertisers have not abandoned this platform; mortgage originators simply have not shown up in it.
The Brand-Safety and Trust Discount
The cheap CPM has a price attached, and a regulated lender should price it explicitly rather than discover it later.
| Advertiser sentiment signal | 2026 figure | Trend |
|---|---|---|
| Marketers who consider X ads brand-safe | 4% | Lowest of any major platform |
| Marketer trust in X ads | 12% (2024) vs 22% (2022) | Falling |
| Marketers planning to decrease X spend | 29% | Up from 26% |
| Marketers planning to exit entirely | ~1 in 8 | Rising |
| Kantar platform trust ranking | Last, 3 consecutive years | Unchanged |
Kantar’s survey work is the source of the widely quoted 4% brand-safety figure, and the same dataset records the drop in advertiser trust from 22% to 12%. Reporting also notes that part of the advertiser return happened under legal and regulatory pressure rather than restored confidence — which is context, not a benchmark, but it explains why spend recovered while sentiment did not.
For mortgage the mitigations are unglamorous and effective: keyword and placement exclusion lists reviewed weekly, creative that does not invite a comment thread on politically charged topics, conversation-button formats avoided on rate offers, and a hard budget cap so a bad news cycle cannot become a bad quarter. This is the same discipline our growth marketing team applies to any channel where brand risk is priced into the CPM.
Formats and the 2026 Compliance Layer
Every X ad unit is fundamentally a promoted post; the variation is what sits inside it. Format specs for 2026 cover image, video, carousel, vertical video, Amplify pre-roll, polls, conversation buttons and managed takeovers.
| Format | Best mortgage use | Cost profile | Caution |
|---|---|---|---|
| Promoted post (image) | Rate-alert signup | Cheapest test unit | Low ceiling on storytelling |
| Vertical video | 45-second rate explainer | Follows video CPM | Needs captions |
| Amplify pre-roll | Alignment with finance publishers | Premium CPM | Inventory varies by market |
| Carousel | Program comparison (FHA / VA / conventional) | Mid | Compliance copy per card |
| Conversation button | Engagement campaigns | Low CPE | Invites public replies — avoid on rates |
| Timeline / Trend Takeover | Brand moments only | $150K–$250K+ per day | Out of scope for most brokerages |
The compliance layer tightened in 2026. Financial advertisers must be certified, and X now requires financial ads to include a clickable disclaimer link that opens an in-app overlay showing regulatory status, license number, registered address and a plain-language risk summary; ads without it are rejected. Separately, X removed the blanket prohibited designation from the financial products category in early 2026 while keeping loans, investment services and buy-now-pay-later restricted under its Paid Partnership rules — so buying ads as a licensed lender and paying a creator to promote a loan product are governed by different policies. Certification also does not substitute for US federal or state advertising law, including TCPA consent on any lead capture.
What We Would Actually Fund
On the evidence above, X is not a primary mortgage acquisition channel and is a genuinely useful tactical one. The allocation we would defend:
- Cap it at 3–5% of paid social budget. Cheap inventory does not justify structural exposure.
- Buy keywords, not interests. The rate-news window is the only edge X has over Meta for lending.
- Run event-triggered flights with a pause rule. 48–72 hours around a print, then stop.
- Send traffic to one purpose-built page. Mortgage landing pages convert at 2.80% against a 4.02% all-industry average — fix the page before blaming the channel, as our mortgage landing page statistics show.
- Use X for referral-partner and recruiting reach. A reading audience of realtors, journalists and loan officers is cheaper to reach here than anywhere else.
- Maintain exclusion lists weekly. Treat brand safety as an operating task, not a setting.
- Ship the disclaimer overlay before launch. Non-compliant financial creative is rejected, not throttled.
- Judge it on cost per qualified conversation. Blended conversion rate on this platform is unusable, for the reasons in the scope table above.
Compared with the channels that actually carry mortgage volume — detailed in our mortgage social media marketing statistics and mortgage Google Ads statistics — X is a scalpel. Used as one, the cheapest CPM in social is a bargain. Used as a volume channel, it is the most expensive kind of cheap.
Frequently Asked Questions
How much do X (Twitter) ads cost in 2026?
X is the cheapest mainstream social inventory on impressions and clicks. Benchmark aggregations put average CPC at $0.74 and average CPM at $5.65–$6.46, against roughly $1.41 CPC and $7.19 CPM on Meta. Cost per engagement sits near $0.03–$0.13, and cost per lead is reported around $41. Managed takeover placements are a different market entirely — Timeline and Trend Takeovers are priced at $150,000–$250,000+ per day. The discount is real, and it exists because advertiser demand fell after 2022, not because the audience got more valuable.
Do X ads convert for mortgage lenders?
The honest answer is that the published data disagrees violently, and a lender should treat that as the finding. One benchmark set reports X conversion rates of 1–3% with a $18.50 median CPA; another, measuring a different advertiser mix, reports a 0.02% conversion rate with a $21.55 CPA. A two-orders-of-magnitude spread means the platform average is meaningless and the outcome is entirely determined by targeting and offer. For mortgage specifically there is no credible published CPL benchmark — which is itself a signal about how few lenders run the channel at scale.
What is the one thing X does better than Meta for mortgage?
Real-time keyword targeting. X lets you reach users who recently searched for or engaged with specific terms, which maps precisely onto rate-move moments — a Fed announcement, a jobs report, a mortgage-rate headline. 63% of X users use the platform primarily for news and current events, and Finance/Crypto is the second-largest community category at 15% of more than 840,000 active communities. No other platform lets a lender show up inside a rate conversation the same afternoon it happens.
Is X brand-safe enough for a regulated lender?
That is a risk decision, not a data question, but the data is unflattering. Kantar found only 4% of marketers believe an ad placed on X is brand-safe, 29% plan to decrease spend (up from 26%), nearly one in eight plan to exit entirely, and X has ranked last among global ad platforms for trust for three consecutive years. Advertiser trust in X ads fell from 22% in 2022 to 12% in 2024. For a lender bound by fair-lending and reputational scrutiny, the mitigations are keyword and placement exclusions, no comment-visible creative on sensitive topics, and a small, capped budget.
What are the current X advertising rules for financial services?
Financial advertising on X requires certification, and as of 2026 financial ads must carry a clickable disclaimer link opening an in-app overlay with the advertiser’s regulatory status, license number, registered address and a plain-language risk summary. Separately, X removed the blanket “Prohibited” designation on the financial products category in early 2026 while keeping loans, investment services and buy-now-pay-later restricted inside its Paid Partnership (creator promotion) rules. The distinction matters: a licensed lender can buy ads; paying a creator to post about a loan product is treated differently.
Sources
Searchlab — X (Twitter) Statistics 2026 (80+ benchmarks)
HeyOz — Are X (Twitter) Ads Worth It in 2026
Enrich Labs — X (Twitter) Advertising Benchmarks
Pryani — X (Twitter) Ads Median Benchmarks
True Interactive — Where Does X Stand With Advertisers in 2026
Digiday — X's Advertiser Base in 2026 (Sensor Tower)
Busyseed — X in 2026: Risk, Reach and Revenue
The Global Statistics — X Advertising Statistics 2026
Benly — X Ads Formats and Specs 2026
Audit Socials — X Ads Policy Violations and Fixes 2026
Heropost — X Marketing for Brands 2026
Benchmarketing — Mortgage Marketing Benchmarks 2026