Table of contents
X sells the cheapest thousand impressions in mainstream paid social — a $5.65 CPM — and it sells them at a discount because 52% of the advertisers who were there before the acquisition cut or killed their budgets. For a mold remediation company, that discount is worth exactly two things, and neither of them is a homeowner with mold in the shower wall.
Key Takeaways
- Average X CPC is $0.74, with a working range of $0.27–$1.95.
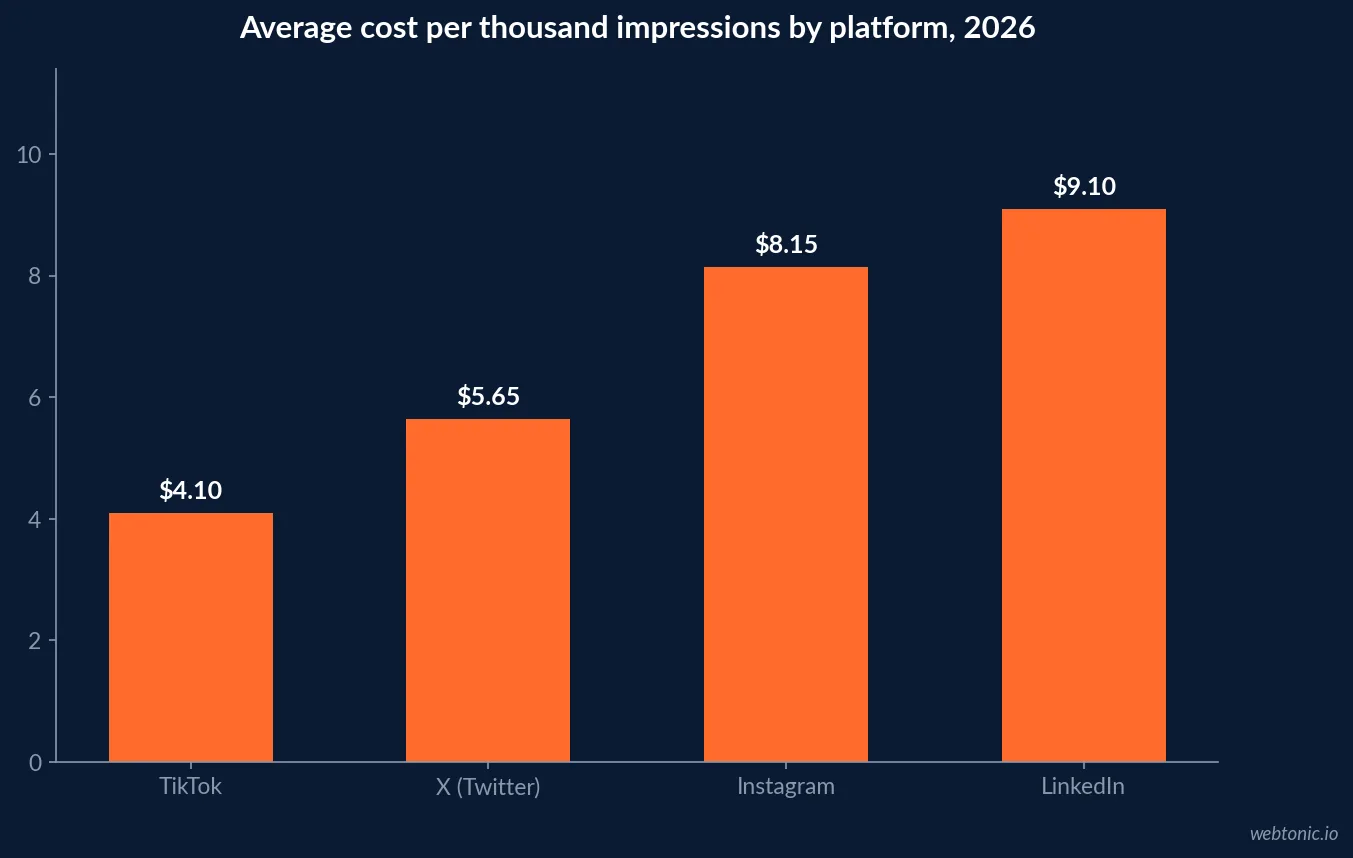
- Average CPM is $5.65, against $8.15 on Instagram, $9.10 on LinkedIn and $4.10 on TikTok.
- CPM has fallen roughly 38% since 2022 — a demand collapse, not a bargain by design.
- Average CTR is 0.86%; promoted video is the strongest format at 1.24%.
- Average cost per lead is $41, versus $24 on Facebook, $20 on TikTok and $82 on LinkedIn.
- Marketers report roughly 34% lower lead quality on X than on LinkedIn.
- Brand engagement on X averages 0.035% per post — the lowest of any major platform (Instagram 0.60%, TikTok 2.65%).
- 52% of pre-acquisition advertisers reduced or stopped spending; 18% increased it specifically because CPMs fell.
- 29% of marketers plan to cut X spend further, and nearly one in eight plan to exit the platform entirely.
- Keyword targeting — unique to X — delivers about 31% higher CTR than interest targeting.
- Reported average return is $2.70 per dollar spent, about 40% above the cross-media average, concentrated in time-sensitive campaigns.
- X has 611 million monthly active users and 259 million daily actives; the US base is 95.4 million.
- 63% of users are there mainly for news and current events — the behaviour a storm response can rent.
- 82% of X traffic is mobile, and 8.2 billion video views a day now run through the platform.
- Audience skew: 60.9% male, 42% college-educated, 37% above-median income, 68% urban.
- 20% of users generate 98% of all posts — interest signals are dominated by a tiny cohort.
- Vertical video ads report roughly 7x the engagement of home-timeline placements.
- Exclusive mold leads elsewhere cost $150–$400; shared leads run $45–$150.
- A severe remediation-and-rebuild job runs $10,000–$30,000, so one booked job pays for a year of testing.
- The US mold remediation services market is valued at about $1.4 billion in 2026, growing 4.1% a year.
- Referrals remain the top restoration lead source at 93%, while adjuster and agent relationships fell to 55% from 68%.
Why X Is Cheap, In One Table
Every number below is a symptom of the same event. The average X CPC in 2026 is $0.74 across a $0.27–$1.95 range, CPM is $5.65 (down about 38% since 2022), CTR averages 0.86%, and average cost per lead is $41. Cheap inventory is what an advertiser exodus looks like from the buy side.
| Metric | X (Twitter) | TikTok | ||
|---|---|---|---|---|
| Average CPC | $0.74 | — | — | $5–$8 |
| Average CPM | $5.65 | — | $4.10 | $9.10 |
| Average CTR | 0.86% | 0.90% | — | 0.65% |
| Average cost per lead | $41 | $24 | $20 | $82 |
| Brand engagement rate | 0.035% | — | 2.65% | 0.54% |
| Reported lead quality | 34% below LinkedIn | — | — | Benchmark |
Two of those rows should stop a remediation owner cold. A 0.035% brand engagement rate is the lowest of any major platform, and a cost per lead 71% above Facebook’s tells you the cheap click is not converting into a cheap conversation. Compare the same math in our mold removal Facebook Ads statistics before you move a dollar.
The Advertiser Exodus Is The Product
The discount exists because demand left. 52% of marketers who advertised on X before the rebrand have reduced or stopped spending, while 18% increased budgets precisely because CPMs collapsed — treating the platform as a bargain buy with intact reach. That split is the whole strategic question in one statistic.
Sentiment has not recovered either. 29% of marketers plan to decrease X spend, up from 26% the year before, with nearly one in eight planning to exit entirely, and the platform is recovering rather than recovered — revenue fell from $4.4 billion in 2022 to $2.6 billion in 2024 and $1.8 billion in 2025. A local remediation firm is not exposed to X’s solvency, but it is exposed to what the exodus signals: fewer serious competitors bidding, and fewer serious buyers to benchmark against.
| Signal | 2026 figure | What it means for a mold company |
|---|---|---|
| Advertisers who cut or stopped | 52% | Auction pressure is low — impressions are cheap |
| Advertisers who increased spend | 18% | A minority actively arbitrage the low CPM |
| Marketers planning further cuts | 29% | Cheap inventory likely persists into 2027 |
| Planning to exit entirely | ~1 in 8 | Do not build a pipeline that depends on X |
| Brand safety classification | High risk (GARM) | Adjacency risk is a real cost for a trust trade |
| Reported average return | $2.70 per $1 | Concentrated in time-sensitive campaigns |
Use Case One: The Storm Week
This is the only place X reliably beats its own averages. X performs best when the campaign matches the platform’s real-time nature — news cycles and live events create concentrated attention other platforms cannot replicate, and reported returns run about 40% higher in those contexts. Mold demand is weather-driven: flooding, hurricanes, burst-pipe cold snaps and humidity advisories all create a local news cycle before they create a phone call.
The mechanics matter. 63% of X users are on the platform primarily for news and current events, 82% of usage is mobile, and the platform now serves roughly 8.2 billion video views a day. A remediation company that publishes a same-day "what to do in the first 24 hours after water intrusion" video during a regional flood is buying attention at $5.65 per thousand while the search auction for the same intent is being bid up by every restoration firm in the market.
| Trigger event | Creative to run | Objective | Realistic budget |
|---|---|---|---|
| Regional flooding or storm | First-24-hours guidance video | Reach + site traffic | $150–$400 over 3–5 days |
| Cold snap and burst pipes | Pipe-freeze checklist | Reach | $100–$250 over 3 days |
| Humidity or air-quality advisory | Basement and crawlspace warning | Traffic | $100–$200 |
| Local mold news coverage | Clearance-testing explainer | Engagement | $75–$150 |
| Off-season baseline | Nothing — pause the account | — | $0 |
The discipline is the pause. X spend outside a trigger window buys the platform average, and the platform average is a $41 lead with 34% lower quality. Route the resulting traffic to a purpose-built emergency page, not the homepage — the reasoning is in our mold removal landing page statistics.
Use Case Two: The Commercial Net
The second defensible use is B2B, and it leans on a targeting option no other platform has. Keyword targeting on X — matching against what users recently posted and searched — delivers roughly 31% higher CTR than interest targeting, and the audience is unusually well-suited to commercial prospecting: 42% college-educated, 37% above-median income, 68% urban, 34% working in the knowledge economy.

That matters because commercial mold work is relationship work. Referrals remain the top restoration lead source at 93%, while adjuster and insurance-agent relationships dropped to 55% from 68% year over year — a gap that has to be refilled by deliberate visibility with property managers, facilities leads, landlords and adjusters rather than by another consumer ad.
| Audience to build | How to build it on X | Offer that fits |
|---|---|---|
| Property managers | Follower look-alikes of local PM firms | Portfolio-wide inspection agreement |
| Landlords and small investors | Keywords: tenant, rental, HVAC, basement | Turn-over mold screening |
| Insurance adjusters | Follower look-alikes of adjuster accounts | Documentation and scope-support package |
| Realtors | Local realtor association followers | 48-hour pre-closing clearance testing |
| Facilities and school boards | Keywords: facilities, HVAC, indoor air quality | Commercial remediation RFP capability |
| Past site visitors | Retargeting from your own pixel | Free scope review |
Budget it as prospecting, not lead generation, and measure it in meetings booked. For the commercial-lead economics side by side, our mold removal LinkedIn Ads statistics hold the comparison numbers.
The Lead Math That Decides It
Run the arithmetic before the campaign, not after. Shared mold remediation leads cost $45–$150 while exclusive leads from your own SEO or paid media run $150–$400, and a severe black-mold remediation and rebuild is a $10,000–$30,000 project. Local Services Ads in most US markets land at $35–$85 per lead with 40–60% lead-to-job conversion — acquiring a $5,000 water mitigation job for $150–$200 in marketing cost is normal there.
| Channel | Typical cost per lead | Lead-to-job | Where X sits |
|---|---|---|---|
| Local Services Ads | $35–$85 | 40–60% | X cannot match intent |
| Shared lead vendors | $45–$150 | Low (resold 3–4x) | X beats this on quality of control |
| Exclusive SEO or paid media | $150–$400 | High | Comparable spend, weaker intent |
| X (platform average) | $41 per lead | Unproven for mold | Cheap, low-intent |
| X (storm window) | Track cost per booked estimate | Situational | Best case for the channel |
The honest read: X’s $41 average cost per lead looks excellent against a $150–$400 exclusive lead until you weight it by intent and by the reported 34% quality gap. That is why the only defensible KPI here is cost per booked estimate. Wire it up properly first — see our mold removal marketing attribution statistics.
Brand Safety Is A Line Item
Cheap media with adjacency risk is not automatically cheap. X Ads offers the lowest cost per impression of the major platforms and the lowest brand safety scores, with GARM classifying the platform as high risk for brand adjacency. For a local trust business — a dental office, a med spa, a home-services brand — trust is fragile in a way a national brand can absorb and a neighbourhood operator cannot.
Mold adds a second layer: health adjacency. Implying diagnosis, quantifying illness risk or fear-selling toxic exposure is a policy problem and a licensing-credibility problem at once. Keep the claims operational — containment, moisture readings, clearance testing, timelines — and the risk stays manageable.
Formats And Creative That Actually Move
Where X still has real product strength is video. Vertical video ads on X report roughly 7x the engagement of home-timeline placements, users spend about 26% more time viewing ads on the platform than on comparable networks, and the First View unit lifts view duration by about 1.4x — while promoted video carries the highest average CTR of any X format at 1.24%.
| Format | Best use for a mold firm | Notes |
|---|---|---|
| Promoted video (vertical) | Storm-response guidance | Highest CTR format at 1.24% |
| Promoted post (image) | Commercial capability proof | Cheapest to produce, weakest CTR |
| Amplify pre-roll | Local news video adjacency | Buys context, costs more |
| Takeover units | Not applicable | Priced for national brands |
| Website card retargeting | Return visitors to the quote form | Best converting placement |
Keep videos short and captioned, front-load the wall-cavity reveal or the moisture meter, and reuse the assets you already shoot for other channels. Our mold removal ad creative statistics covers the production standard.
A Seven-Step X Test For A Mold Removal Company
- Cap the experiment at $300–$800 a month and set an end date before launch.
- Build keyword audiences first — the 31% CTR advantage over interest targeting is the platform’s only unique edge.
- Run only in trigger windows: storms, freezes, humidity advisories, local mold coverage.
- Use vertical promoted video, the 1.24% CTR format, and caption everything for a 82% mobile audience.
- Route traffic to an emergency-specific page with tap-to-call above the fold, never the homepage.
- Measure cost per booked estimate against your $150–$400 exclusive-lead benchmark — ignore CPC entirely.
- Kill it after 60 days if the commercial net is empty; keep it if property managers or adjusters replied.
X is not a lead engine for mold remediation and no amount of budget will make it one. It is a cheap, fast megaphone for the seventy-two hours after a weather event, and a keyword net for the commercial relationships that carry a remediation company through a slow quarter. Priced and paused accordingly, it earns a small line in the budget. For the channels that should carry the rest of it, start with our mold removal digital marketing statistics, or have our growth marketing team build the plan — you can also just get in touch.
Frequently Asked Questions
Do X (Twitter) Ads work for mold removal companies?
Not as a primary lead channel, and the data says why. X carries the lowest engagement rate of any major platform at roughly 0.035% per brand post, a 0.86% average ad CTR, and an average cost per lead of $41 with reported lead quality about 34% below LinkedIn. Homeowners with active mold do not search X; they search Google and the map pack. Where X earns its place in a remediation budget is cheap, fast reach during a weather or air-quality news cycle, and keyword-targeted prospecting against property managers, landlords, realtors and insurance adjusters — the people who hand out repeat commercial work.
What do X Ads cost in 2026?
The average CPC is $0.74 with a range of roughly $0.27 to $1.95, and the average CPM is $5.65 — the cheapest of the major platforms, against $8.15 on Instagram, $9.10 on LinkedIn and $4.10 on TikTok. CPM has fallen about 38% since 2022. Average cost per lead is $41, versus $24 on Facebook, $20 on TikTok and $82 on LinkedIn. The discount is a demand problem, not a generosity problem: 52% of advertisers who used the platform before the acquisition have cut or stopped spending.
What targeting should a mold remediation company use on X?
Keyword targeting first — it is unique to X, matches against what people have recently posted and searched, and delivers roughly 31% higher CTR than interest targeting. Build it around live-event language (flood, burst pipe, humidity advisory, storm names, "water in the basement") inside a tight geographic radius. Layer follower look-alikes of local property management firms, realtor associations and adjuster accounts, then retarget site visitors. Skip broad interest targeting: on a platform where 20% of users produce 98% of the posts, interest signals are dominated by a small, unrepresentative group.
Is X safe for a licensed remediation brand?
That is a judgement call, and it should be made deliberately. The Global Alliance for Responsible Media classifies X as high risk for brand adjacency, 29% of marketers plan to cut X spend, and roughly one in eight plan to exit entirely. For a trade that sells trust to homeowners in a health-adjacent category, adjacency risk is a real cost. Mitigations: run in-feed placements with conservative inventory filters, avoid politically charged trend targeting, never make health or mold-toxicity claims, and keep the account's organic voice purely operational — job footage, weather guidance, service updates.
How much should a mold company test on X?
Treat it as a $300 to $800 per month experiment against a fixed hypothesis, not a channel migration. At a $5.65 CPM, $500 buys roughly 88,000 local impressions — enough to test one storm-response creative and one commercial-partner creative. Hold it to a hard number: cost per booked estimate, not cost per click. Exclusive mold leads elsewhere run $150 to $400, and a single remediation job is worth $1,500 to $30,000, so X has to beat a $150 to $250 cost per qualified conversation to justify a second month.
Sources
Searchlab — X (Twitter) Statistics 2026: 80+ Facts
True Interactive — Where Does X Stand With Advertisers in 2026?
Market.biz — X Advertising Statistics and Facts (2026)
Digital Applied — X Platform Statistics 2026 (audited filing data)
Christoph Olivier Consulting — X (Twitter) Ads Cost in 2026
Adwave — X (Twitter) for Small Business: Does It Still Matter?
BuiltRight Digital — Mold Remediation Lead Generation Cost (2026)
Tygart Media — Restoration Lead Generation: 2026 Operator's Guide
Cleanfax — 2026 Restoration Benchmarking Survey Report
Coherent Market Insights — Mold Remediation Service Market 2026–2033
SQ Magazine — Twitter (X) Statistics 2026