Table of contents

Between 70% and 80% of restoration leads arrive by phone, 67% of home services companies cannot say which channel produced their last ten jobs, and call sources are mistagged 30–50% of the time. Mold removal does not have an attribution model problem. It has a wiring problem.
Key Takeaways
- 70–80% of restoration leads arrive as phone calls, making untracked ringing the single largest measurement gap in the trade.
- About 67% of home services companies report they cannot confidently identify which marketing channels are working.
- Customer service reps are reported to tag call sources incorrectly 30–50% of the time inside job-management software.
- Home services buyers pass through roughly 7–12 touchpoints before booking a contractor.
- Last-click models are estimated to overvalue paid search and undervalue brand channels by 40–60%.
- Multi-touch attribution adoption sits at 47%, up from 31% in 2023; last-touch is still running at 41%.
- Marketing mix modelling nearly tripled to 26% from 9% in 2023, and 33% of teams now run a hybrid of both.
- The unattributable “dark funnel” averages 38% of pipeline, with word-of-mouth alone accounting for 17%.
- Self-reported attribution surveys typically surface 30–50% of demand that tracking software never credits.
- 58.6% of marketers agree their organisation underinvests in channels it cannot measure properly.
- Without server-side conversion APIs, 30–50% of conversions go untracked on iOS traffic.
- Referrals remain a lead source for 93% of restoration contractors, and adjuster relationships fell to 55% from 68%.
- Only about 3% of contractors are paid by carriers inside one to two weeks; over 18% wait more than eight weeks.
- Days sales outstanding runs 45–60 days industry-wide, with the top quartile under 45.
- Customer acquisition cost benchmarks at $500–$1,000 per job, and under $500 in the top quartile.
- A mold remediation job averages $18,000 on insurance-scoped work against roughly $2,368 for a typical residential out-of-pocket job.
- Average web-lead response time is 23 minutes, while sub-five-minute responders convert at 3–4x the rate.
- Healthy restoration marketing returns $8–$12 per dollar; below $5 signals reallocation.
- Multi-touch adopters are reported to reallocate 20–30% of budget once they can see channel contribution.
- Attribution-capable teams spend 23% more on martech but report 1.6x larger marketing-sourced pipeline.
The Measurement Gap, Sized
Start with the structural fact that shapes everything else. In restoration, roughly 70–80% of leads come by phone. A frightened homeowner who has just found black staining behind a bathroom vanity does not fill in a contact form and wait. They tap the first number they trust. Every measurement decision downstream either captures that ring with its source attached, or throws the majority of the demand signal away.
The consequence shows up in survey data. About 67% of home services companies struggle to understand which channels work. And even firms that installed tracking lose fidelity at the human layer: call-source tagging inside job-management software is reported to be wrong 30–50% of the time, because a customer service rep triaging an emergency has better things to do than choose from a dropdown. Add platform-side signal loss — 30–50% of conversions go untracked on iOS without a server-side conversion API — and the picture is a leaking pipe with four holes rather than one.
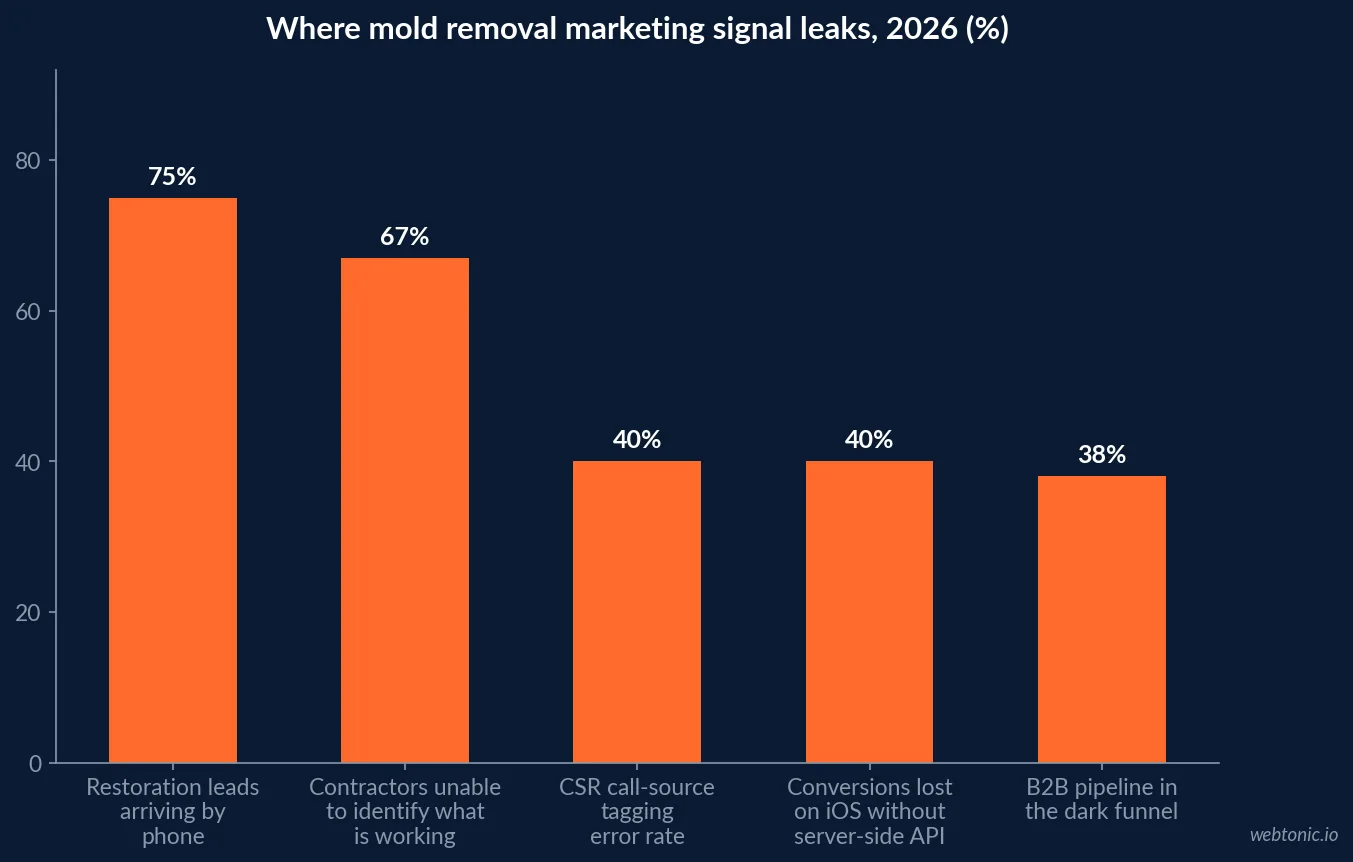
| Leak | Reported size | Where it happens | Fix |
|---|---|---|---|
| Phone-first demand | 70–80% of leads | Ring never tied to source | Dynamic number insertion on every asset |
| Human tagging error | 30–50% of calls | CSR dropdown in the CRM | Auto-populate source from the tracking number |
| iOS and browser signal loss | 30–50% of conversions | Ad platform pixel | Server-side API plus enhanced conversions |
| Dark funnel | ~38% of pipeline | Word-of-mouth, forums, DMs | Self-reported intake question |
| Offline outcome | Job value and margin | Between CRM and ad platform | Offline conversion import of booked revenue |
Cost Per Lead Ranks Channels Backwards
The most expensive attribution mistake in mold remediation is not using the wrong model — it is optimising the wrong metric. Cost per lead is the default because it is available on day one. Cost per acquired job requires the CRM to talk to the phone system, which is why most firms never get there.
The gap between the two numbers is not marginal. As the martech analysis puts it, a channel producing 50 leads a month at $100 each has an effective acquisition cost of $1,000 if only five convert. Restoration lead-to-booked-job rates cluster around 10–15% for purchased leads, while referral-sourced work converts far higher — the widely cited illustration is 100 paid leads yielding 8 jobs against 20 referrals yielding 12.
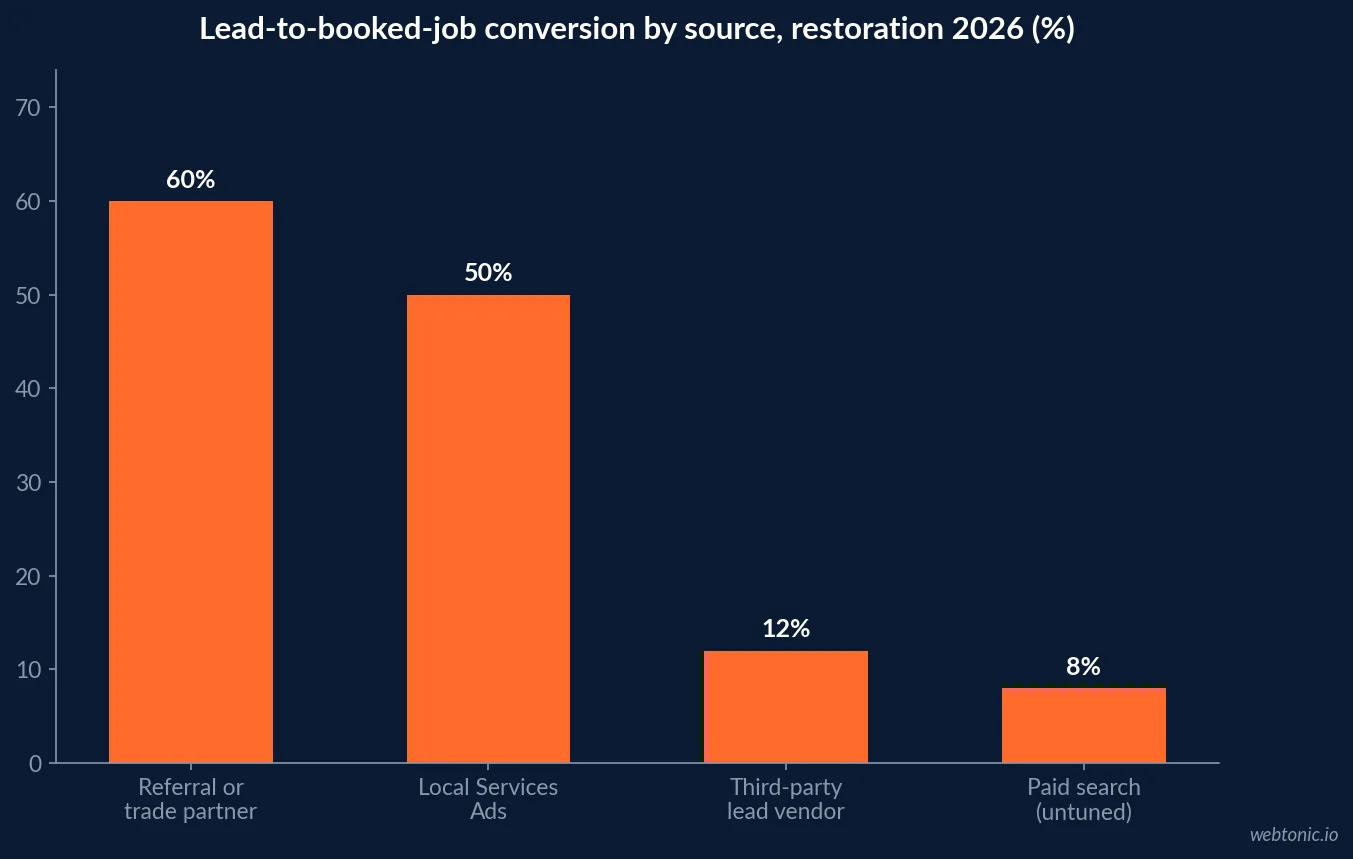
| Channel | Reported cost per lead | Lead-to-job | Implied cost per job |
|---|---|---|---|
| Referral / trade partner | $0–$50 (nurture cost) | ~60% | Lowest in the mix |
| Local Services Ads | $90–$250 per mold lead | 40–60% | $180–$500 |
| Paid search (tuned) | $60–$250 mold range | 10–20% | $400–$1,500 |
| Third-party lead vendor | $150–$400 | 10–15% | $1,200–$3,000 |
| Water damage comparison | $80–$180 | 10–15% | $600–$1,500 |
Against a benchmark customer acquisition cost of $500–$1,000 per job — under $500 in the top quartile — half the channels a mold firm buys are underwater the moment conversion rates are applied. That is invisible on a cost-per-lead dashboard and obvious on a cost-per-job one. Our mold removal analytics statistics break down the tracking layer that makes the second number possible.
The Journey Is Longer Than The Emergency Suggests
Restoration marketing narrates itself as an instant-response business, and operationally it is: average web-lead response time is 23 minutes, and firms answering inside five minutes are reported to convert at 3–4x the rate. But the buyer’s research does not start when they dial. Home services buyers pass through roughly 7–12 touchpoints before booking, and last-click attribution is estimated to overvalue paid search while undervaluing brand-building channels by 40–60%.
For mold specifically the pre-call sequence is unusually long, because the homeowner is diagnosing a health question before a purchase: symptom searches, forum threads, a testing-versus-remediation debate, review reading, then a shortlist. A single-touch system credits whichever asset happened to be last — usually the Google Business Profile — and quietly defunds the content and local presence that built the shortlist. Contractors who move to multi-touch reporting are reported to reallocate 20–30% of budget as a direct result.
| Journey stage | Typical mold-specific touch | What last-click credits |
|---|---|---|
| Symptom research | Search on health symptoms, forum threads | Nothing |
| Problem naming | Cost guides, testing-vs-remediation content | Nothing |
| Shortlisting | Map pack, reviews, neighbour recommendation | Nothing |
| Validation | Site visit, gallery, certification page | Sometimes the session |
| Contact | Phone call from profile or ad | 100% of the credit |
What The Wider Attribution Data Says
The broader benchmark picture explains why single-model reporting is losing ground everywhere, not just in the trades. In the 2026 attribution survey of 1,200+ teams, multi-touch adoption reached 47% (from 31% in 2023), last-touch still runs at 41%, hybrid multi-touch-plus-mix-modelling at 33%, marketing mix modelling at 26% (from 9%), and 7% of teams have no formal attribution at all. Shares exceed 100% because most teams now run two models in parallel.
| Model | 2026 adoption | Fit for a mold removal firm |
|---|---|---|
| Multi-touch attribution | 47% | Useful once call and CRM data are joined |
| Last-touch attribution | 41% | Default; systematically misprices brand and local |
| Hybrid MTA + mix modelling | 33% | Overkill below roughly $50K monthly spend |
| Marketing mix modelling | 26% | Only meaningful with multi-year seasonal data |
| First-touch attribution | 19% | Good sanity check against last-touch |
| No formal attribution | 7% | Where most independent contractors actually sit |
Two findings matter more than the adoption percentages. First, the dark funnel averages 38% of pipeline — decomposed as word-of-mouth and referrals 17%, dark social 12%, podcasts 6% and communities 5%. For a trade where 93% of contractors still name referrals as a lead source, that share is plainly higher, not lower. Second, self-reported attribution consistently reveals 30–50% of demand that software never credits — which is why a one-line intake question outperforms most paid tooling.
The cost of ignoring the gap is measurable in behaviour: 58.6% of marketers agree they underinvest in channels their organisation cannot measure. In mold removal that means underfunding exactly the referral, reputation and local-presence work that produces the highest-converting jobs.
The Insurance Payment Cycle Breaks Your ROI Window
Mold attribution has a complication no benchmark deck mentions: the revenue arrives long after the click. Only about 3% of restoration contractors are paid by carriers inside one to two weeks, and over 18% wait more than eight weeks. Days sales outstanding runs 45–60 days industry-wide. A campaign judged on a 30-day window is being judged before its revenue exists.
That has three practical implications. Book value at signature, not at payment, so the attribution loop closes when the job is sold. Track gross-margin-weighted revenue rather than invoice totals — mold remediation runs 40–50% gross margin against 70–80% on water mitigation, so a dollar of mold revenue is not a dollar of water revenue. And keep a separate payer dimension: adjuster-sourced work fell as a channel to 55% from 68%, which is a channel shift disguised as a receivables trend.
| Timing decision | Common practice | Better practice |
|---|---|---|
| Conversion event | Form fill or call | Booked job with value |
| Revenue recognition | Carrier payment | Signature date, flagged by payer |
| Reporting window | 30 days | 90 days rolling, cohorted by lead month |
| Value used | Invoice total | Gross margin by service line |
| Ticket assumption | One average | $18,000 insurance scope vs ~$2,368 retail job |
The ticket split matters for target setting. Insurance-scoped mold work benchmarks near $18,000 per job, while typical residential out-of-pocket remediation averages about $2,368. A blended average CPA target across both is guaranteed to overpay for one and starve the other.
The Stack That Actually Closes The Loop
Three systems, connected, beat any number of dashboards: a CRM, call tracking, and an attribution join between them. Call tracking surfaces source, recording and lead quality automatically, and entry pricing around $45 a month is trivial against a $500–$1,000 acquisition cost. The integration that matters in this trade is the one joining call source to booked job revenue in the field-service platform, because that is the only path from cost per lead to cost per job.
| Layer | Job | Typical monthly cost |
|---|---|---|
| CRM / job management | Single record per customer and job | $0–$400 |
| Call tracking (DNI) | Source per ring, recordings, keywords | $45–$150 |
| Analytics with call and form events | Session behaviour, phone-tap tracking | $0 |
| Offline conversion import | Booked revenue back to ad platforms | $0 (configuration) |
| Marketing add-on module | Attribution inside the FSM platform | $200–$600 |
One asymmetric advantage most firms leave on the table: the estimating data already sitting in the business. Average job value by damage type, seasonal loss frequency and the geographic concentration of specific damage types are marketing inputs, not accounting outputs. Firms that connect them allocate budget against value rather than volume — knowing, for example, that storm-driven claim spikes concentrate in a single quarter and that commercial mold work clusters in a handful of postcodes. Our mold removal local SEO statistics cover the geographic layer, and the disaster restoration analytics statistics show how the same joins play out across the wider restoration category.
A Ten-Step Attribution Build For A Mold Firm
- Put a dynamic tracking number on every asset — the profile, the ads, the truck, the yard sign. Phone is 70–80% of demand.
- Auto-populate lead source from the tracking number to defeat the 30–50% human tagging error rate.
- Add one intake question — “how did you hear about us” — to surface the 30–50% of demand software misses.
- Make lead source mandatory before a job can be scheduled, so the field cannot stay empty.
- Switch the primary KPI to cost per acquired job, not cost per lead.
- Import booked revenue back to the ad platforms and enable server-side conversions to recover the 30–50% iOS loss.
- Report on a 90-day rolling window cohorted by lead month, because DSO runs 45–60 days.
- Weight revenue by service-line margin — mold at 40–50%, water at 70–80%.
- Benchmark channel ROAS against $8–$12 and treat anything under $5 as a reallocation candidate.
- Review response time by channel — the gap between 23 minutes and five is a 3–4x conversion difference.
Attribution-capable teams spend about 23% more on measurement and report 1.6x the marketing-sourced pipeline. In a trade running 40–50% gross margins on its second most profitable service line, that ratio decides which firms can keep buying growth. If you want the join between calls, jobs and channels built properly, our data intelligence team does exactly this — or just get in touch.
Frequently Asked Questions
Why is marketing attribution so hard for mold removal companies?
Because most of the demand never touches a trackable web form. Roughly 70–80% of restoration leads arrive by phone, and about 67% of home services companies report they cannot confidently say which channels are working. Layer on referral-heavy demand — 93% of restoration contractors still name referrals as a lead source — and a payment cycle where more than 18% of firms wait over eight weeks for carrier money, and the feedback loop between spend and revenue can stretch a full quarter.
What should a mold remediation company measure instead of cost per lead?
Cost per acquired job, by channel. The arithmetic is unforgiving: a channel producing 50 leads a month at $100 each looks like a $100 cost per lead, but if only five book, the real acquisition cost is $1,000. Restoration lead-to-booked-job rates are commonly reported around 10–15% for purchased leads against roughly 60% for referrals, so cost per lead ranks channels in almost the opposite order to cost per job. Pair it with return on ad spend, where the healthy restoration band is reported at roughly $8–$12 of revenue per marketing dollar.
Does call tracking actually fix restoration attribution?
It fixes the volume problem, not the credit problem. Dynamic number insertion tags which source produced the ring, and CallRail starts around $45 a month for the volume a single-market contractor needs. But source tagging still depends on humans and settings: customer service reps are reported to mistag call sources 30–50% of the time in job-management workflows, and single-touch systems hand all the credit to the last click. The fix is joining call data to booked-job revenue in the CRM, not adding another dashboard.
How many touchpoints happen before someone books a mold job?
More than the emergency framing suggests. Home services buyers are reported to pass through roughly 7–12 touchpoints before booking a contractor, and last-click models are estimated to overvalue paid search while undervaluing brand-building channels by 40–60%. Even in an urgent mold situation, the homeowner has usually read a Reddit thread, glanced at a Google Business Profile, checked reviews and asked a neighbour before dialling — which is exactly the sequence single-touch reporting deletes.
Is multi-touch attribution worth it for a small mold removal firm?
Not as software, yes as discipline. Multi-touch adoption sits at about 47% of surveyed teams (up from 31% in 2023) and hybrid multi-touch-plus-mix-modelling at 33%, but those numbers come from B2B organisations with analysts. A three-truck mold firm gets most of the benefit from four cheap habits: dynamic call numbers on every asset, a mandatory lead-source field before a job can be scheduled, a “how did you hear about us” question on the intake script, and offline conversion imports pushing booked revenue back to the ad platform.
Sources
Cleanfax — The 2026 Restoration Benchmarking Survey Report
Tygart Media — The Restoration Company’s Martech Stack
Digital Applied — Marketing Attribution Statistics 2026 (140 data points)
PipelineOn — Multi-Touch Attribution for Home Service Companies
Click Vision — Home Services Marketing Statistics 2026
PPC Land — 58.6% of marketers underinvest in channels AI cannot measure (AppsFlyer)
Geisheker — Dark Funnel and Self-Reported Attribution 2026
Elev8 Operations — Contractor Marketing Statistics 2026
The Deal Sheet — Restoration Industry Unit Economics and KPIs 2026
UseCalcPro — Professional Mold Removal Cost 2026
CallRail — 31 Home Services Marketing Statistics for 2026