



Table of contents
Total marketing budgets fell to 9.6% of company budgets in 2026, the lowest since 2021, while digital marketing spending specifically grew 8.2% and is forecast to grow another 10.4% next year. That split, not a flat "increase mobile spend" instruction, is what should set a 2026 mobile marketing budget. This page breaks the budget question down by channel using the data that actually exists for push, SMS and the broader digital line mobile campaigns compete inside.
Key Takeaways
- Overall marketing budgets fell to 9.6% of company budgets in 2026, the lowest since 2021.
- Marketing spending as a share of revenue sits at 9.0%, also a multi-year low.
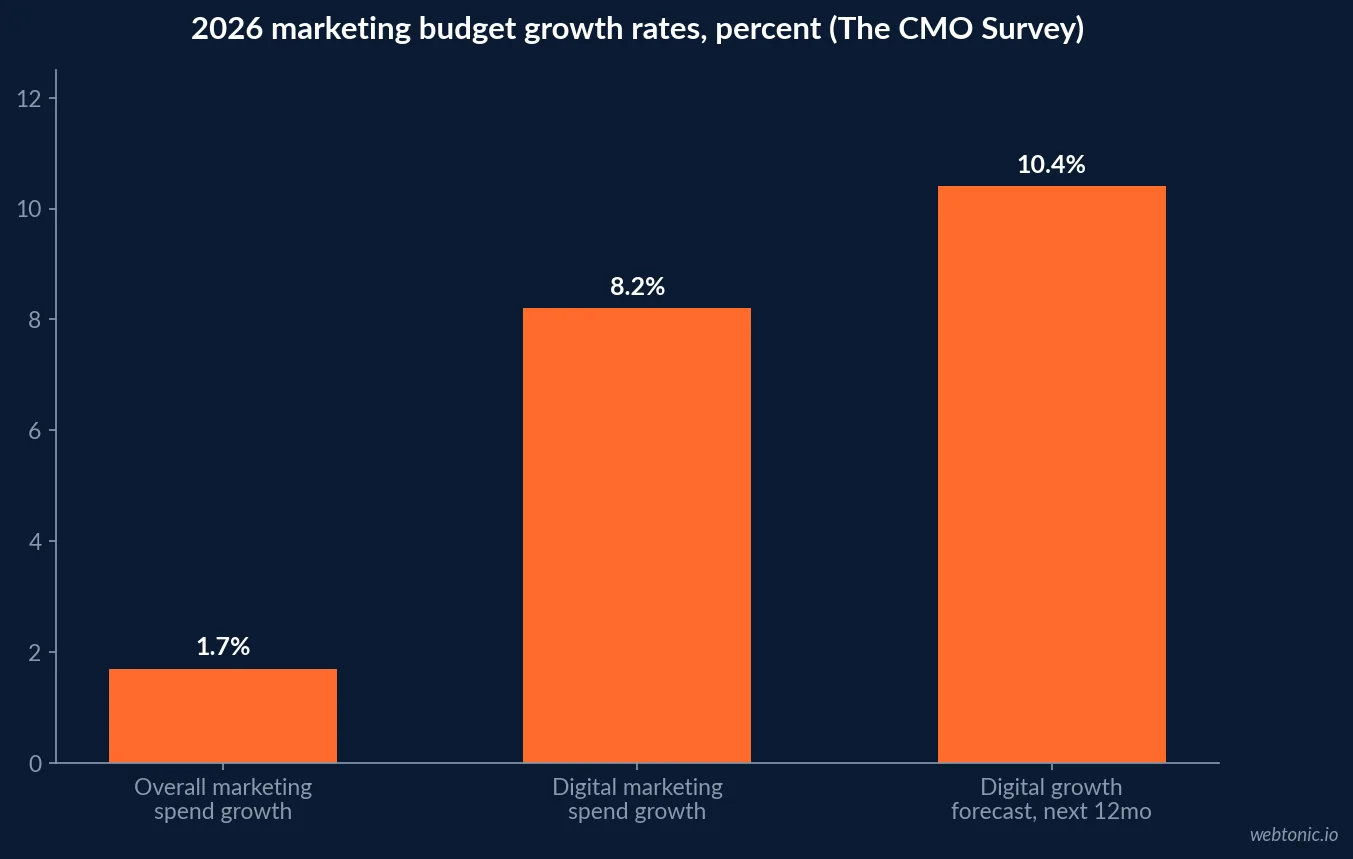
- Overall marketing spending grew just 1.7% over the prior 12 months.
- Digital marketing spending grew 8.2% in the same period, nearly 5x the overall rate.
- Marketers forecast 10.4% more digital growth over the next 12 months.
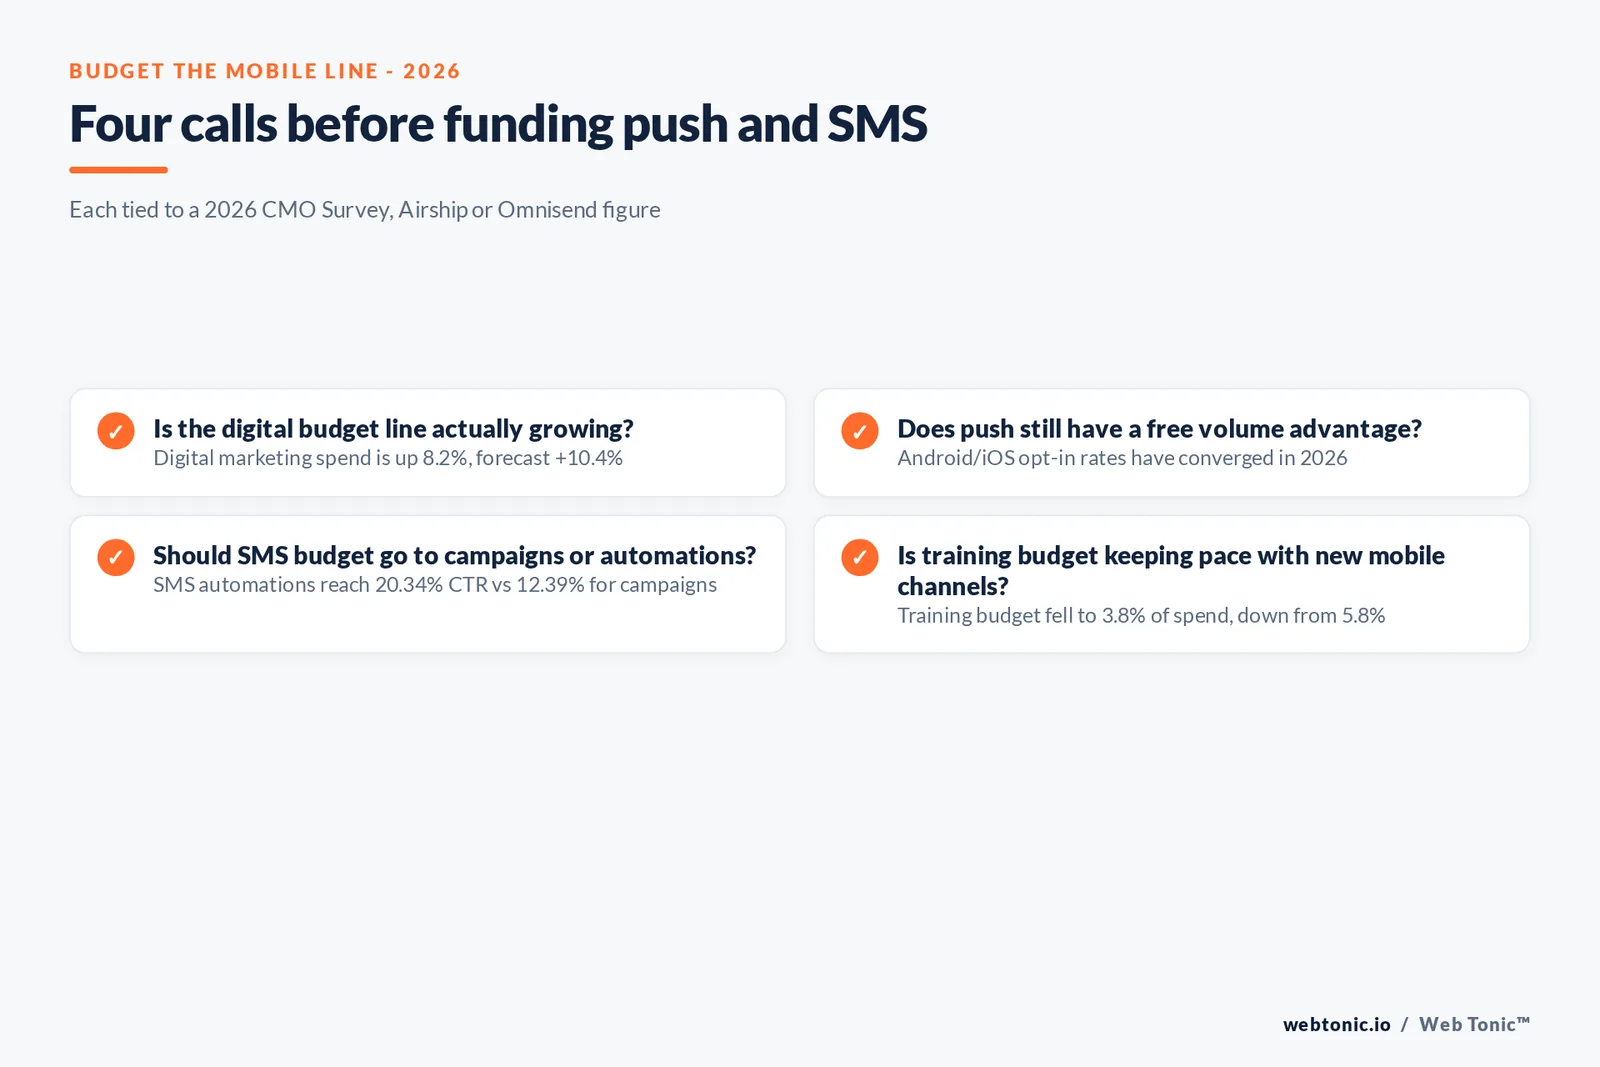
- Marketing training budgets fell to 3.8% of spend, down from a pre-pandemic 5.8%.
- Marketing gets cut 45.4% of the time when profits fall short of expectations.
- Airship's 2026 benchmark spans 681 billion push notifications to over 3 billion users.
- Android and iOS push opt-in rates have converged for the first time as Android 13+ closed the gap.
- Android's median push volume dropped 15% year over year even as top-tier senders doubled down.
- Omnisend's SMS dataset covers 246 million-plus campaign sends across 27,000-plus brands.
- SMS campaigns average a 12.39% click-through rate, versus 0.74% for email.
- SMS automations reach a 20.34% click-through rate, 8 points above campaign sends.
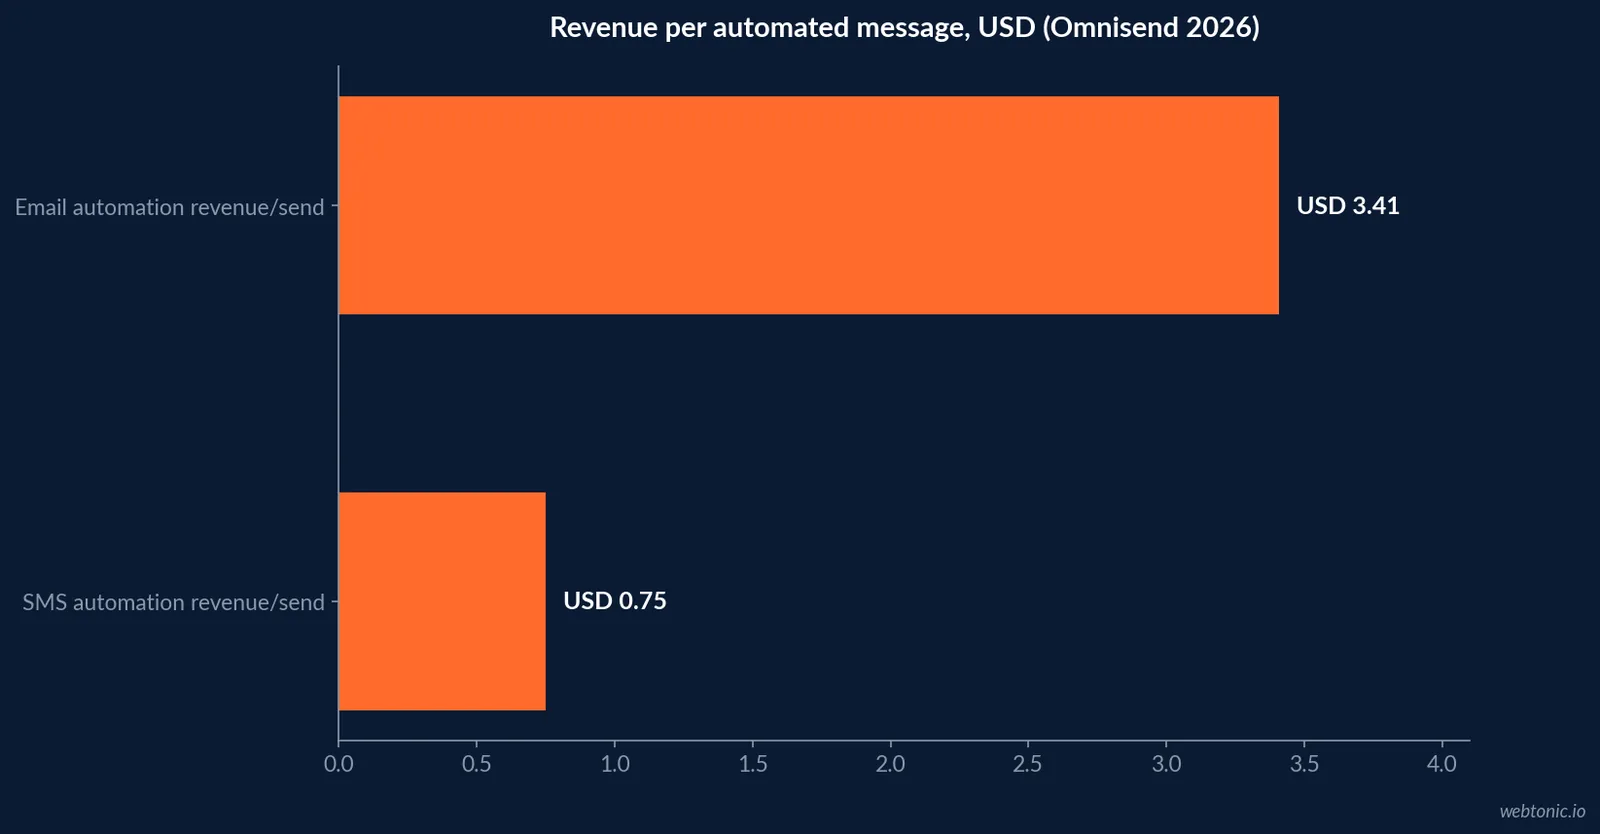
- Email automations generate USD 3.41 per send, well above SMS automation's USD 0.75.
- SMS campaign deliverability sits at 96.6%, versus 92.8% for automations.
- Nearly three in four companies rate digital's contribution to performance as strong, per the CMO Survey.
| Marketing budget benchmark, 2026 | Figure | Source |
|---|---|---|
| Overall marketing spend, share of company budget | 9.6%, lowest since 2021 | The CMO Survey, 35th edition |
| Overall marketing spend, share of revenue | 9.0% | The CMO Survey, 35th edition |
| Overall marketing spending growth, prior 12 months | 1.7% | The CMO Survey, 35th edition |
| Digital marketing spending growth | 8.2%, forecast +10.4% next 12 months | The CMO Survey, 35th edition |
| Marketing training budget, share of spend | 3.8%, down from 5.8% pre-pandemic | The CMO Survey, 35th edition |
| Share of profit shortfalls answered by cutting marketing | 45.4% of the time | The CMO Survey, 35th edition |
The budget context every mobile line item sits inside
Before setting a push or SMS budget, know the ceiling it competes for. The 2026 CMO Survey, fielded among 308 marketing leaders at US for-profit companies (97% VP-level or above), found total marketing budgets fell to 9.6% of overall company budgets and 9.0% of revenue, both multi-year lows. Overall marketing spending grew just 1.7% over the prior 12 months, the weakest rate since 2021.
Digital marketing spending is the exception inside that shrinking total, growing 8.2%, with marketers forecasting another 10.4% over the next 12 months, according to EMARKETER's FAQ on the 2026 marketing budget data. The underlying CMO Survey Topline Report puts the digital figure at 8.20% with a 95% confidence interval of 4.72% to 11.68%, a wide enough band that a single-quarter read should not set a full-year mobile number. Mobile channels compete for share of that digital line, not for a fresh allocation from the shrinking overall pool.
| Where the CMO Survey says budget is under pressure | 2026 figure | Context |
|---|---|---|
| Economic pessimism | Highest since June 2020 | Reshaping targeting and growth priorities |
| Companies cutting expenses on a profit miss | 53.1%, up from 46% | Marketing is cut 45.4% of the time when this happens |
| Time spent managing the present vs. preparing for the future | 68% present, 32% future | Short-term pressure crowds out planning |
| Digital's rated contribution to company performance | ~3 in 4 companies call it strong | The one budget line still expanding |
Push notifications: the free volume advantage is gone
Airship's 2026 Mobile App Push Notification Benchmarks, drawn from 681 billion push notifications sent to more than 3 billion users across 15 industry verticals, documents a structural shift: Android opt-in rates used to run artificially high because notifications were enabled by default, while iOS always required explicit consent. With universal adoption of Android 13+, that default-opt-in advantage has closed, and Android and iOS opt-in rates now sit near parity. Budget that used to lean on Android's free volume now needs to go into the value exchange that actually earns permission.
Send volume is also polarizing rather than converging toward a middle ground: the top 10th percentile of senders increased output further, while Android's median and low-tier campaigns cut volume by 15% year over year. Vertical execution spreads are wide too - Food and drink shows a 57.32-point spread on Android and 49.63 points on iOS between the 10th and 90th percentile, meaning a generic push strategy in that category is a liability, not a shortcut.
| Push notification budget signal, 2026 | Figure | Source |
|---|---|---|
| Notifications analyzed | 681 billion, 3 billion+ users, 15 verticals | Airship 2026 Benchmarks |
| Android opt-in advantage vs. iOS | Closed to near parity | Airship 2026 Benchmarks |
| Android median/low-tier volume, YoY | -15% | Airship 2026 Benchmarks |
| Food and drink vertical performance spread, Android | 57.32 percentage points | Airship 2026 Benchmarks |
SMS: the highest-engagement, not the highest-revenue, mobile channel
Omnisend's 2026 SMS Marketing Benchmarks, based on more than 246 million SMS campaign sends and 20 million automation sends across 27,000-plus brands, show SMS campaigns averaging a 12.39% click-through rate, against just 0.74% for email campaigns in the same brand base. Automated SMS performs even better on engagement, reaching a 20.34% click-through rate and a 0.78% conversion rate, both ahead of campaign-send averages, because the message responds to something the subscriber just did.
The budget nuance is on revenue per message, where email pulls ahead: email automations generate USD 3.41 per send against USD 0.75 for SMS automations. SMS earns its budget on speed and attention, not on being the higher-revenue-per-send channel, so a mobile budget that reallocates entirely from email to SMS on click-through rate alone is reading the data wrong.
| SMS vs. email, Omnisend 2026 dataset | SMS | Winner | |
|---|---|---|---|
| Campaign click-through rate | 12.39% | 0.74% | SMS |
| Automation click-through rate | 20.34% | 4.66% | SMS |
| Campaign conversion rate | 0.12% | 0.08% | SMS |
| Automation conversion rate | 0.78% | 1.49% | |
| Revenue per automated send | USD 0.75 | USD 3.41 | |
| Campaign deliverability | 96.6% | - | SMS-specific metric |
Building the budget line by line
Treat push and SMS as two different jobs rather than one "mobile" line. Push earns its keep on retention and re-engagement of an existing installed base, so its budget should track app active-user counts, not campaign volume alone - the data above shows that sending more into a shrinking opt-in base backfires. SMS earns its keep on speed: fund automation triggers (cart abandonment, post-purchase, list-join) ahead of one-off promotional blasts, since the automation numbers in Omnisend's data outperform campaign sends on every engagement metric that matters.
Fund both from the digital line growing at 8.2%, not from the shrinking overall marketing budget, and expect scrutiny: the CMO Survey shows marketing absorbs the cut 45.4% of the time a company misses its profit target, more often than most other expense lines.
Where the training and headcount gap bites
One line item is easy to underfund and hard to notice until a campaign underperforms: marketing training budgets have fallen to 3.8% of marketing spend, down from a pre-pandemic 5.8%, even as marketing headcount growth slowed sharply. A mobile program built on new channels like SMS automation or push orchestration needs a training allocation to run it well, and that line is shrinking faster than the campaign budget itself.
If your team needs a partner to stand up the push and SMS measurement layer this data argues for, our growth marketing team builds exactly that inside a broader digital budget plan. Duke's Fuqua School, which has run The CMO Survey since 2008 in partnership with Deloitte, publishes the full topline data set twice a year, which is worth bookmarking against your own budget cycle.
Setting next quarter's number
A defensible mobile marketing budget for the next quarter starts from three figures on this page: the 8.2% digital growth rate as your ceiling for reallocation, the push opt-in convergence as the reason to fund creative and value-exchange work over raw send volume, and the SMS automation engagement gap as the reason to prioritize trigger-based sends before adding a new campaign cadence.
For the paid-media side of a mobile budget, see our guide to what paid social actually costs in 2026, or talk to our team about phasing a mobile budget against these numbers.
What to skip funding this year
The same data set is just as useful for cutting a line item as it is for justifying one. A generic, high-volume push notification cadence with no segmentation is the clearest candidate: the Airship data shows the middle ground between high-frequency and highly curated sending is disappearing, so a program stuck in the middle is losing opt-ins to both more disciplined competitors and to Android's newly tightened consent requirements. Similarly, a one-off promotional SMS blast with no automation trigger behind it is the weakest-performing configuration Omnisend measured, at a 0.12% conversion rate against automation's 0.78%.
Reallocating even a modest share of a generic-blast budget into segmentation and automation tooling is supported by every metric in this page's tables, not just a general best practice.
| Mobile marketing tactic | 2026 verdict | Supporting figure |
|---|---|---|
| Generic, unsegmented push cadence | Cut or redesign | Middle-tier push volume fell 15% YoY on Android |
| One-off promotional SMS blast | Deprioritize vs. automation | 0.12% conversion rate vs. 0.78% for automation |
| SMS automation triggers | Fund first | 20.34% CTR, 0.78% conversion rate |
| Push value-exchange redesign | Fund | Opt-in rates now converged; the exchange itself must earn permission |
Frequently Asked Questions
How much should a marketing team budget for mobile campaigns in 2026?
Start from the CMO Survey's own numbers: total marketing budgets fell to 9.6% of overall company budgets in 2026, the lowest since 2021, while digital marketing spending specifically rose 8.2% and is forecast to grow 10.4% more over the next 12 months. Mobile channels such as push and SMS should be funded from that growing digital slice, not from a shrinking total budget.
Is push notification budget still worth funding in 2026?
Yes, but the easy gains are gone. Airship's 2026 benchmark report, built from 681 billion push notifications sent to more than 3 billion users, found Android and iOS opt-in rates have converged for the first time as Android 13+ closed the default-opt-in gap. Budget now needs to go into the value exchange that earns permission, not the assumption that Android delivers a free volume advantage.
How does SMS marketing compare to email for budget allocation?
On engagement, SMS wins clearly: Omnisend's 2026 benchmarks, from 246 million-plus SMS sends across 27,000-plus brands, found SMS campaigns average a 12.39% click-through rate against 0.74% for email. On revenue per automated message, email pulls ahead at USD 3.41 per send versus USD 0.75 for SMS, so the two channels justify different jobs rather than competing for the same budget line.
Why did overall marketing budgets shrink even as digital spend grew?
The 2026 CMO Survey attributes it to economic pessimism at its highest level since the pandemic, with executives cutting expenses rather than investing in growth when profits fall short. Marketing gets cut 45.4% of the time when that happens, more often than most other expense categories, even as digital and mobile lines keep growing their own share inside a smaller total.
What is the single most cost-effective mobile channel to test first?
SMS automation, on the data available: Omnisend found automated SMS reaches a 20.34% click-through rate and a 0.78% conversion rate, both well above campaign-send averages, because the message is triggered by something the subscriber just did. It requires far less creative and media spend than a paid mobile ad test to validate.
Sources
The CMO Survey - Marketing Contracts Under Economic Pressure Despite Growing Value and AI Gains (35th edition, 2026)
EMARKETER - FAQ on marketing budgets: Growth benchmarks, digital allocation, and the brand-performance imbalance
Airship - Guide to the Mobile App Push Notification Benchmarks 2026
Omnisend - SMS Marketing Benchmarks 2026
The CMO Survey - Topline Report 2026 (PDF)
Deloitte - The CMO Survey program page


