



Table of contents
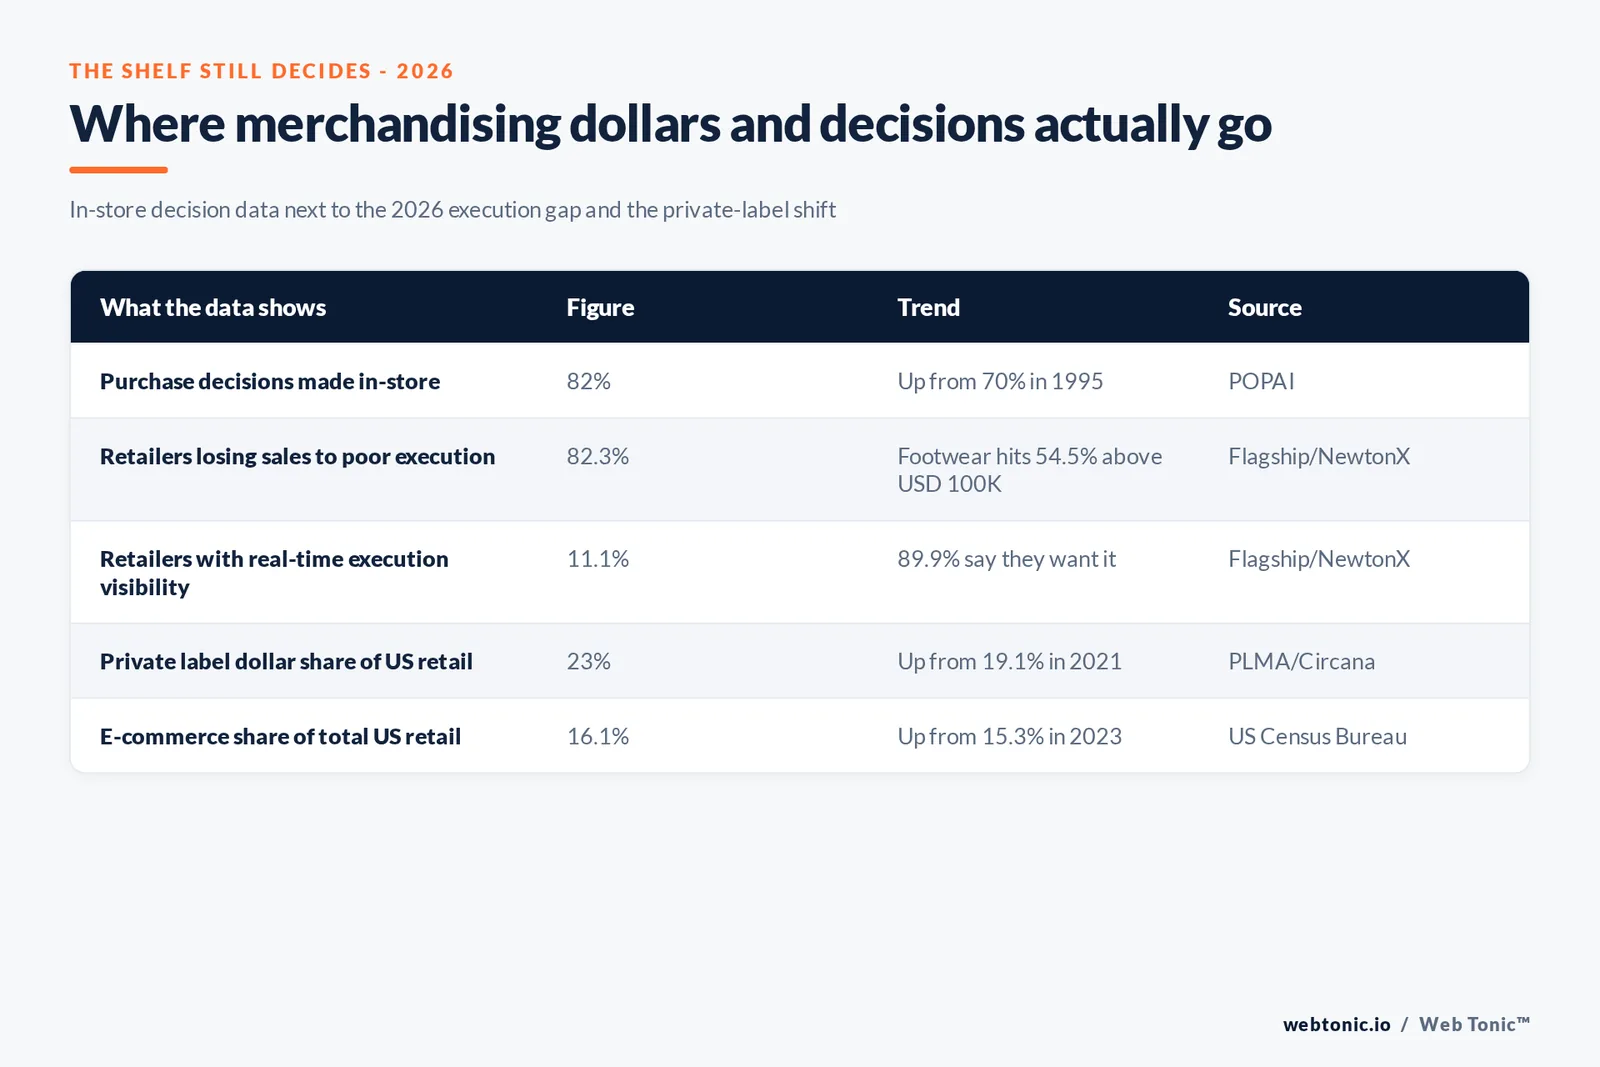
82% of shopping decisions are made inside the store, and 82.3% of retailers lost real revenue to poor merchandising execution last year — the same physical floor that drives most purchases is also where most of the preventable losses happen. This page lines up the 2026 execution data against the longer-running research on what actually moves shoppers.
Key Takeaways
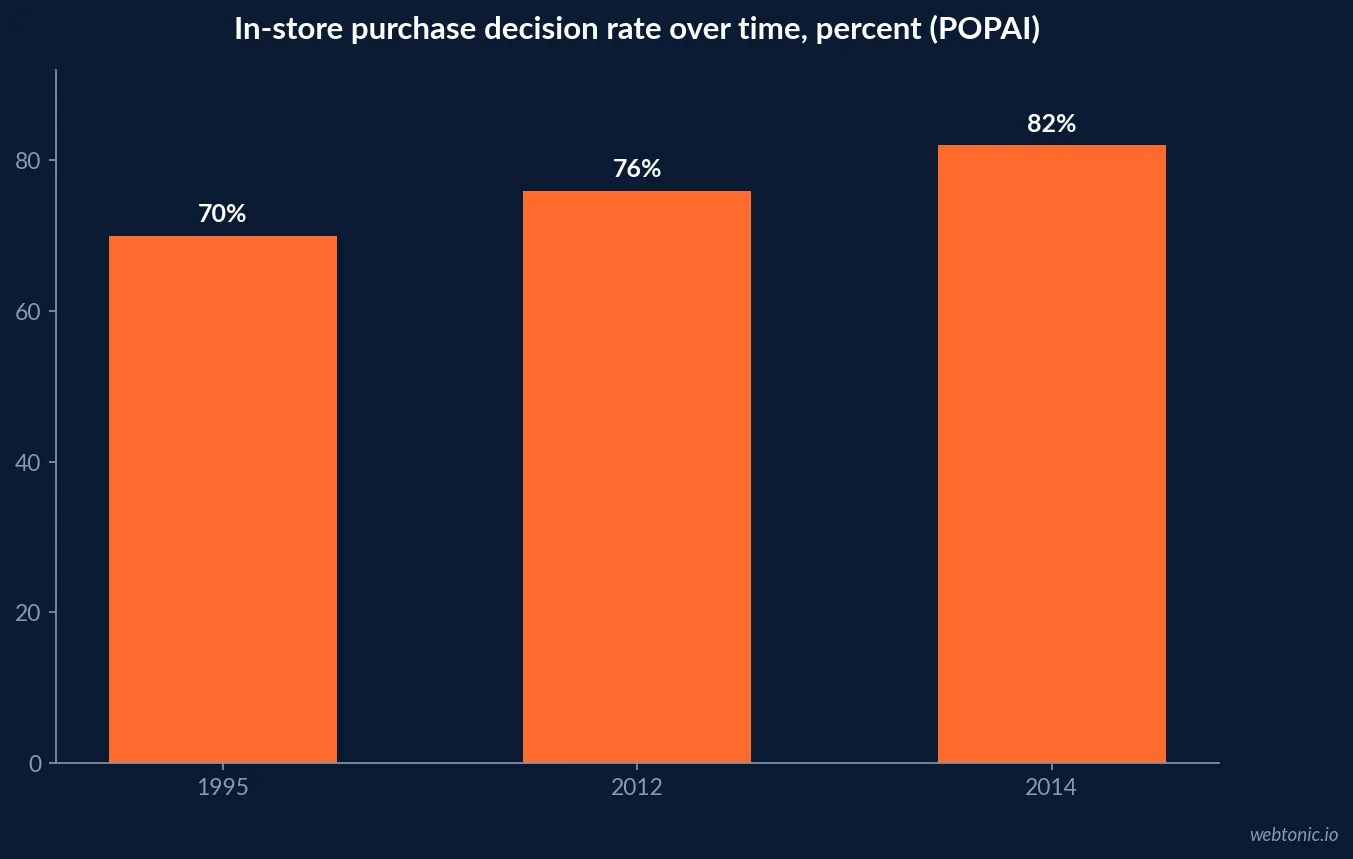
- 82% of shopping decisions are made in-store, up from 76% in 2012.
- More than 1 in 6 purchases follow a specific in-store display for that brand.
- 82.3% of retailers report sales losses from poor execution in the past year.
- 31.1% lost more than USD 100,000 to execution failures.
- Footwear brands are most exposed, at 54.5% above that loss threshold.
- 68.9% call inconsistent execution their top challenge; beauty brands hit 88.9%.
- 35.6% have zero real-time visibility into store compliance.
- 40% still run visual merchandising manually in 2026.
- 89.9% want real-time insights, but only 11.1% have them.
- 88% of C-level retail leaders expect visual merchandising to blend art with tech.
- 38.8% plan to boost physical-store investment over the next two years.
- US private label sales reached USD 330 billion in 2025.
- Private label holds a 23% dollar share of total US retail.
- Private label dollar sales rose 30% over five years, 2021 to 2025.
- US retail sales are forecast to reach USD 5.6 trillion in 2026, up 4.4%.
- E-commerce is still just 16.1% of total US retail sales.
Most purchase decisions are still made on the floor
POPAI's Mass Merchant Shopper Engagement Study found the in-store decision rate climbed to an all-time high of 82% by 2014, and POPAI's earlier tracking shows that rate rising steadily from 70% in 1995 to 76% in 2012 before reaching 82%. More than 1 in 6 purchases were made specifically because a display for that brand was present in the store at the moment of decision — the single clearest evidence that merchandising execution is a revenue lever, not a cosmetic one.
| In-store decision metric | 1995 | 2012 | 2014 | Source |
|---|---|---|---|---|
| In-store decision rate | 70% | 76% | 82% | POPAI |
| Displays placed in secondary locations | 47% | 60% | n/a | POPAI |
| Purchases tied to a specific display | n/a | n/a | >1 in 6 | POPAI |
The 2026 execution gap: the same floor, less consistent control
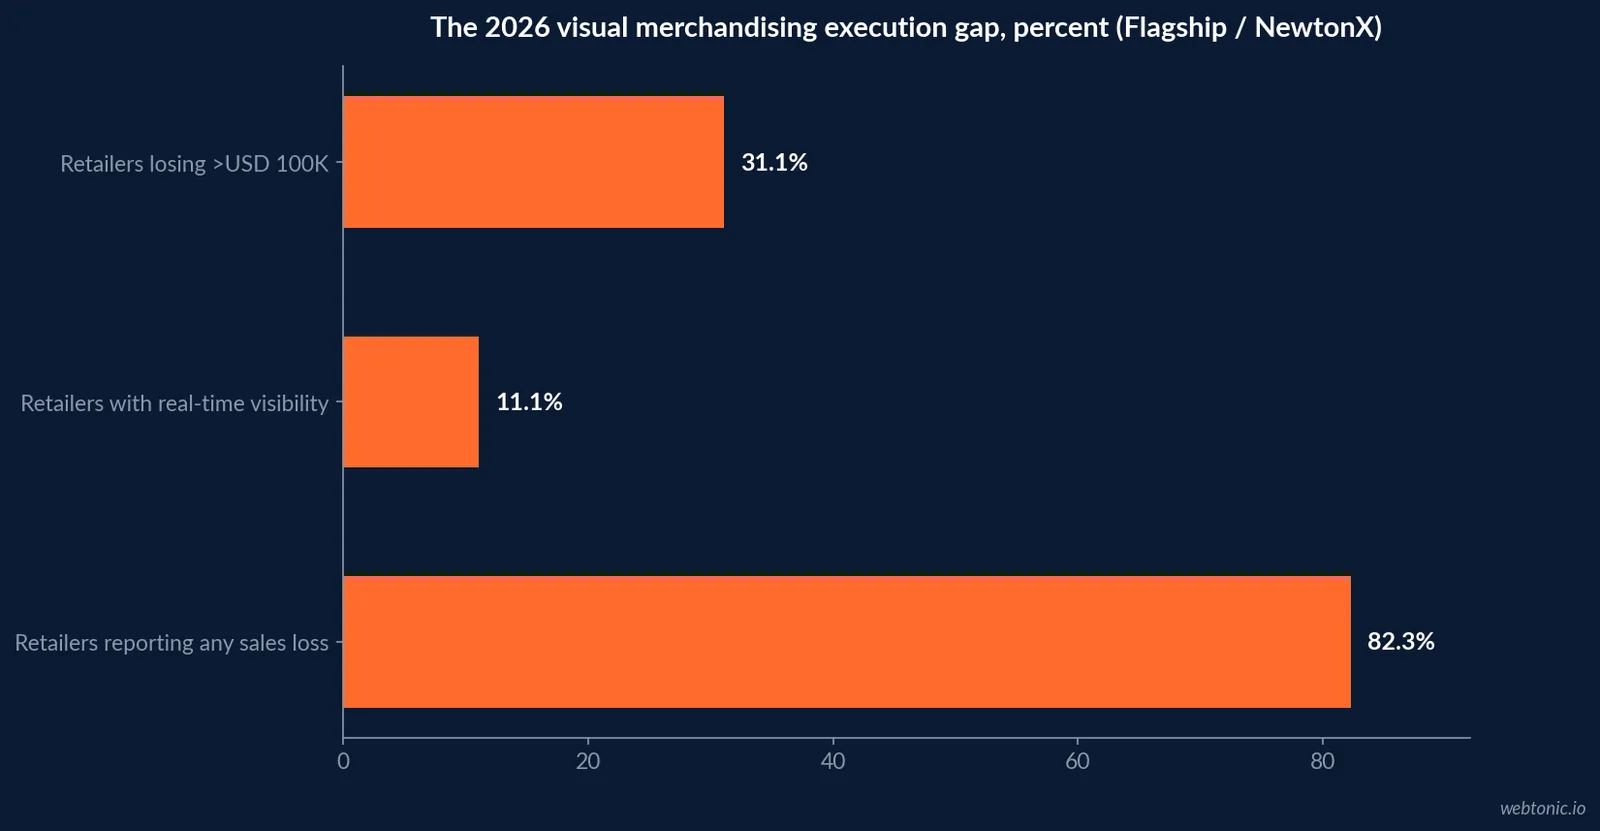
Flagship's 2026 State of Visual Merchandising Report, built with research firm NewtonX across top fashion, footwear, department store, beauty and jewelry brands, found 68.9% of retail leaders call inconsistent execution their top challenge — rising to 88.9% in beauty specifically. 82.3% report real sales losses from poor execution in the past year, and 31.1% lost more than USD 100,000, with footwear brands the most exposed at 54.5% above that threshold.
| Execution-gap metric (2026) | Figure | Notes | Source |
|---|---|---|---|
| Inconsistent execution is top challenge | 68.9% | Rises to 88.9% in beauty | Flagship / NewtonX |
| Retailers reporting sales losses from execution | 82.3% | In the past year | Flagship / NewtonX |
| Retailers who lost over USD 100K | 31.1% | Footwear hits 54.5% | Flagship / NewtonX |
| Zero real-time compliance visibility | 35.6% | n/a | Flagship / NewtonX |
| Still running visual merchandising manually | 40% | n/a | Flagship / NewtonX |
| Want real-time insight but don't have it | 89.9% want / 11.1% have | 78.8-point gap | Flagship / NewtonX |
Why retailers are recommitting to the physical floor
Despite the execution gap, 88% of C-level retail leaders in Flagship's survey expect visual merchandising to blend art with technology going forward — real-time dashboards, AI-assisted displays and data-driven creativity replacing anecdotal store feedback. 38.8% of retailers plan to increase investment in physical stores over the next two years, outpacing planned online investment, a direct response to how much revenue is being left on the table by inconsistent execution rather than a retreat from e-commerce.
The retail backdrop those decisions sit inside
The National Retail Federation forecasts total US retail sales will grow 4.4% in 2026 to USD 5.6 trillion, outpacing the 3.6% average annual growth of the prior decade. Set against that, the US Census Bureau reports e-commerce accounted for just 16.1% of total retail sales in 2024, up from 15.3% in 2023 — meaning close to 84% of a USD 5.6 trillion market still transacts somewhere a shelf, an endcap or a window display can decide the sale.
| Retail backdrop metric | Figure | Source |
|---|---|---|
| US retail sales forecast, 2026 | USD 5.6 trillion (+4.4%) | National Retail Federation |
| 10-year average annual retail growth | 3.6% | National Retail Federation |
| E-commerce share of US retail sales, 2024 | 16.1% | US Census Bureau |
| E-commerce share of US retail sales, 2023 | 15.3% | US Census Bureau |
| Share of retail still transacted off-line | ~84% | US Census Bureau |
Private label is the fastest-growing line on the shelf
Circana's research for PLMA found US private label sales reached USD 330 billion in 2025, capturing a 24% unit share and a 23% dollar share of total retail — and PLMA's own 2026 report shows that over the five years from 2021 to 2025, private label dollar sales rose USD 64.8 billion, or 30%, with dollar share climbing from 19.1% to 21.3%. Merchandising private label alongside national brands — shelf position, endcap rotation, signage — is now a margin decision with a nine-figure line item attached, not a secondary category.
| Private label metric | 2021 | 2025 | Change | Source |
|---|---|---|---|---|
| Dollar share of total US retail | 19.1% | 21.3% | +2.2 pts | PLMA / Circana |
| Five-year dollar sales growth | n/a | +USD 64.8B | +30% | PLMA / Circana |
| 2025 total private label sales | n/a | USD 330 billion | n/a | Circana |
| Unit share of total US retail | n/a | 24% | n/a | Circana |
Category exposure to execution failure is not even
Flagship's 2026 data shows the execution gap hits categories unevenly. Beauty brands report the sharpest challenge overall, with 88.9% naming inconsistent execution their top problem against 68.9% across all categories measured, while footwear brands carry the heaviest financial exposure, with 54.5% reporting losses above USD 100,000 against 31.1% across the full sample. Both categories share dense SKU counts and frequent seasonal resets, which is exactly the combination that makes manual, anecdotal store feedback the weakest control.
| Category | Execution challenge intensity | Financial exposure | Source |
|---|---|---|---|
| Beauty | 88.9% cite inconsistent execution | Above category average | Flagship / NewtonX |
| Footwear | Above category average | 54.5% lost over USD 100K | Flagship / NewtonX |
| All categories (blended) | 68.9% cite inconsistent execution | 31.1% lost over USD 100K | Flagship / NewtonX |
Turning the data into a floor-level plan
Three numbers set the priority order: 82% of decisions are still made in-store, so execution quality is a revenue lever, not a design preference; 89.9% of retail leaders already know real-time visibility would help but only 11.1% have it, so closing that gap is the highest-leverage fix available; and private label's 23% dollar share means shelf strategy now has to account for margin as well as brand loyalty. None of these require guessing — each has a named 2026 benchmark attached.
Our creative and merchandising work is built against exactly this kind of execution data, and our take on what makes a strong retail marketing partner covers the broader agency-selection side of the same decision.
What the technology shift actually looks like
The 88% of C-level leaders who expect visual merchandising to blend art with technology are not describing a distant roadmap. Flagship's 2026 findings tie that expectation directly to the compliance gap: retailers moving from anecdotal store-visit feedback to real-time dashboards are the ones most likely to close the 78.8-point gap between wanting execution visibility and actually having it. The technology itself is not the differentiator — dense SKU categories like beauty and footwear already have the display hardware. What changes is whether headquarters finds out about a compliance failure the same week it happens or the same quarter.
Margin pressure is pushing shelf strategy toward private label
The 23% dollar share private label now holds is not a one-year spike. PLMA's data shows it climbing steadily for five straight years, and Circana's research frames the driver as structural rather than promotional: retailers are treating store brands as a strategic growth lever rather than a discount alternative, which changes how much shelf space and end-cap priority a merchandising plan should allocate to them relative to national brands carrying thinner margins.
The number retailers should track next
The 78.8-point gap between wanting real-time execution insight (89.9%) and actually having it (11.1%) is the single most useful benchmark in this data set, because it is the one every retailer can move without waiting for a market shift. Closing even a third of that gap would put a retailer ahead of the 68.9% currently naming inconsistent execution their top unsolved problem.
Talk to us if a merchandising or in-store creative audit is the next step, or read our agency background for how we approach retail execution work end to end.
Frequently Asked Questions
What percentage of purchase decisions are made in the store?
POPAI's Mass Merchant Shopper Engagement Study found the in-store decision rate reached 82% in 2014, up from 76% in 2012 and 70% in 1995. More than 1 in 6 purchases were made specifically because a display for that brand was present in the store — meaning merchandising execution, not just product selection, was directly deciding a meaningful share of sales even before mobile shopping accelerated in-aisle research.
How much revenue is lost to poor merchandising execution?
Flagship's 2026 State of Visual Merchandising Report, built with research firm NewtonX, found 82.3% of retailers reported sales losses due to poor execution in the past year, and 31.1% lost more than USD 100,000 — with footwear brands the most exposed, at 54.5% reporting losses above that threshold. Beauty brands reported the sharpest execution challenge overall, with 88.9% citing inconsistent execution as their top problem.
Do retailers have real-time visibility into merchandising compliance?
Mostly not yet. Flagship's 2026 data found 89.9% of retail leaders say real-time insights would improve execution, but only 11.1% actually have them today — most still rely on anecdotal store feedback. 35.6% report zero real-time visibility into store compliance, and 40% still run the process manually.
How big is the private label share of retail sales now?
It keeps growing. PLMA and Circana's 2026 Private Label Report found US private label sales reached USD 330 billion, a 24% unit share and a 23% dollar share of total retail. Over the five years from 2021 to 2025, private label dollar sales rose USD 64.8 billion — up 30% — with dollar share climbing from 19.1% to 21.3%.
Is physical retail merchandising still worth investing in given e-commerce growth?
The 2026 data says yes. The US Census Bureau puts e-commerce at 16.1% of total US retail sales in 2024, meaning nearly 84% of retail still happens somewhere a shelf, an endcap or a window display can influence the sale. Flagship's 2026 survey found 38.8% of retailers plan to increase investment in physical stores over the next two years, outpacing planned online investment — a direct response to how much revenue execution gaps are already costing them.
Sources
POPAI - 2014 Mass Merchant Shopper Engagement Study results
Supermarket News - POPAI in-store decision rate coverage
Flagship / NewtonX - The 2026 State of Visual Merchandising Report
National Retail Federation - 2026 annual retail sales forecast
US Census Bureau - Quarterly Retail E-Commerce Sales, Q4 2024
Circana - US private label CPG sales reach USD 330 billion
PLMA - Private Label Report 2026, industry facts and figures


